Abstract
The Cancer Genome Atlas (TCGA) research network has made public a large collection of clinical and molecular phenotypes of more than 10 000 tumor patients across 33 different tumor types. Using this cohort, TCGA has published over 20 marker papers detailing the genomic and epigenomic alterations associated with these tumor types. Although many important discoveries have been made by TCGA's research network, opportunities still exist to implement novel methods, thereby elucidating new biological pathways and diagnostic markers. However, mining the TCGA data presents several bioinformatics challenges, such as data retrieval and integration with clinical data and other molecular data types (e.g. RNA and DNA methylation). We developed an R/Bioconductor package called TCGAbiolinks to address these challenges and offer bioinformatics solutions by using a guided workflow to allow users to query, download and perform integrative analyses of TCGA data. We combined methods from computer science and statistics into the pipeline and incorporated methodologies developed in previous TCGA marker studies and in our own group. Using four different TCGA tumor types (Kidney, Brain, Breast and Colon) as examples, we provide case studies to illustrate examples of reproducibility, integrative analysis and utilization of different Bioconductor packages to advance and accelerate novel discoveries.
INTRODUCTION
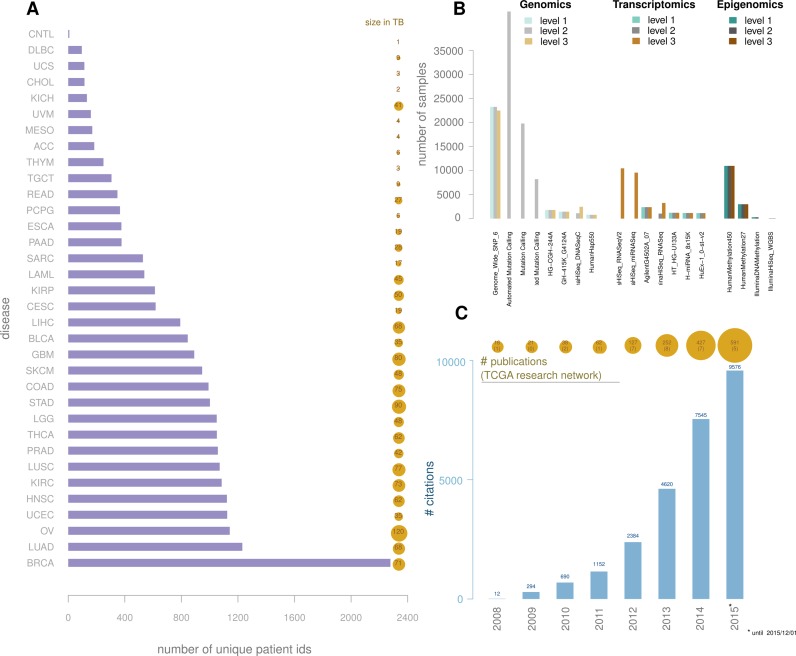
Cancer is among the leading causes of death worldwide, and treatments for cancer range from clinical procedures such as surgery to complex combinations of drugs, surgery and chemoradiation (1). The Cancer Genome Atlas (TCGA), which began in 2006 with the aim of collecting and analyzing both clinical and molecular data on over 33 different tumor types by sampling across 500 cases per tumor type, has to date generated the most comprehensive repository of human cancer molecular and clinical data (Figure 1A) (2). Tumors profiled by TCGA range from solid to hematological types, from mildly to severely aggressive in terms of survival and from benign to metastatic. For each cancer case, DNA, RNA and protein were extracted, and genomic, transcriptomic, epigenomic and (recently) proteomic (Figure 1B) profiling was then performed using a diverse set of ‘omics’ platforms, from custom microarrays to large-scale genomic sequencing. The TCGA consortium is organized into several working groups, each responsible for generating, collecting and coordinating data production (Biospecimen core resource and Data coordinating center) or analyzing the data (Genome data analysis center) (https://wiki.nci.nih.gov/display/TCGA/TCGA+Wiki+Home). Analysis working groups (AWGs) are formed by members of the scientific community to lead the data analysis for each tumor type (e.g. Breast or Kidney) and, more recently, for system-specific cancers (e.g. central nervous system or reproductive system) or pan-cancer (all tumor types together) (2–6). AWG members download and analyze the currently publicly available data through the TCGA data portal (https://tcga-data.nci.nih.gov/tcga/). Members generally include experts in one or more data type (e.g. DNA methylation, expression, copy number or whole-genome sequencing) and experts in disease (generally oncologists specializing in each particular studied tumor). Using the collective knowledge gained by the experts in each platform and disease, a formal characterization and report is generated and published as a landmark TCGA marker (3,5–9).
Figure 1.
TCGA data overview. (A) bars represent number of patients by disease; bubbles represent the available data size in TB by disease; (B) number of samples by platform and by level, grouped by type: genomic, transcriptomic and epigenomic. (C) Barplot: number of citations for TCGA papers. Bubble plot: number of TCGA papers, in parenthesis the number of papers published by the TCGA Research Network. Source: Scopus search for 'TCGA', adding TCGA Research Network papers that were not found during this search.
These findings have generated a wealth of advanced knowledge on the tumors reported and have led to the development of clinical prognostic and diagnostic biomarkers as well as redefinitions of prior classifications of tumors, as recently described in a study of lower-grade gliomas (3). The scientific cancer community has used TCGA data to advance their research and to provide even greater insight into these debilitating diseases, as evidenced by the growing number of citations of TCGA landmark papers (Figure 1C). In addition to advancing understanding of cancer, the TCGA data offer opportunities to develop novel statistical methodologies and create resources to integrate with other data consortia, such as the Roadmap (10) and Encode projects (11), as has been illustrated in a recent study by Yao et al. (12).
Despite the wealth and accessibility of its data, TCGA presents several major challenges for bioinformaticians, clinicians and molecular biologists interested in harnessing TCGA data to further their own research (2,13,14). Among these researchers are data analysts who are interested in reproducing some of the major findings by the TCGA AWGs and incorporating novel methodologies into the preprocessing, processing and filtering steps, such as normalization, feature selection and downstream integrative analyses (13). However, the TCGA data and archives are constantly changing, either because of newly created data or because some data sets have been retracted by the families of the patients or the data were later discovered to be from the wrong tissue source or to be of low quality. To keep up with the dynamic and ever-changing structure of the TCGA data repository, the Data Coordination Center's Web Service (DCCWS) was made available to access the TCGA database (https://wiki.nci.nih.gov/display/TCGA/TCGA+DCC+Web+Service+User's+Guide). The DCCWS contains information about the centers, platforms, archives and other information relevant to the project. In addition, methodologies applied to analyze the TCGA data have mostly been presented in Sweave R documents or in-house R scripts (15–17), thus making it challenging for many to harness the discoveries. Many studies, including TCGA marker papers, deposit supplementary tables with external websites, as PDF files, or Excel tables (https://tcga-data.nci.nih.gov/docs/publications/), thus making the effort to reproduce these findings or integrate them with one's own data even more challenging.
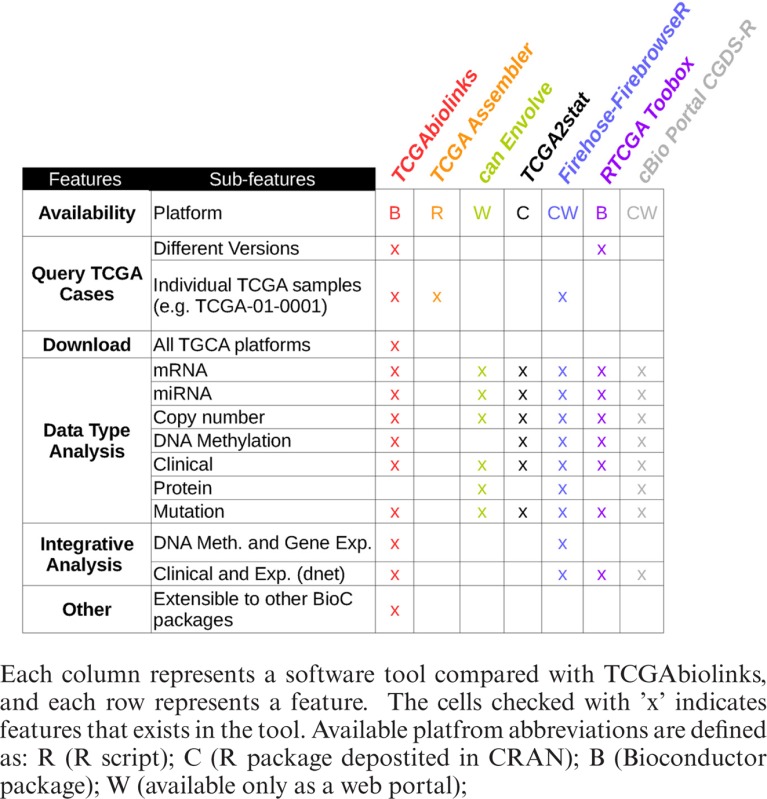
Recently, several tools to retrieve TCGA data sets have been made available, as summarized in Table 1 (detailed summary provided in Supplementary text). These tools include TCGA-Assembler (17), CGDS-R (https://github.com/cBioPortal/cgdsr), canEnvolve (18), the Broad Institute GDAC Firehose (http://gdac.broadinstitute.org/), RTCGAToolbox (19) and cBioPortal (20). These tools can be divided into three representative categories. The first category comprises tools mainly used to download cancer genomics data, such as TCGA-Assembler and CGDS-R. The second category includes tools that focus mainly on data analysis and integration, such as canEnvolve. The third category comprises tools to download and analyze data, such as RTCGAToolbox, Firehose and cBioPortal. RTCGAToolbox is a tool that systematically accesses Firehose preprocessed data and performs basic analysis and visualization of an individual data type (expression, mutation or methylation). Despite the existence of TCGA-specific software packages, none of these tools perform the integrative analysis harnessing methodologies designed by TCGA AWGs, such as identifying epigenetically silenced genes (represented in a starburst plot (16)) or functional copy number identification (6), nor can these tools download archived data (versions), which are critical for reanalyzing prior TCGA studies. Although RTCGAToolbox can download and analyze Firehose-generated data, neither tool can provide the downloaded data as a ‘SummarizedExperiment’ object, which is critical for allowing the full integration and use of other popular Bioconductor packages, an integral aspect of Bioconductor (21,22). Briefly, the SummarizedExperiment class is a matrix-like container in which rows represent ranges of interest (as a GRanges or GRangesList object) and columns represent samples (with sample data summarized as a DataFrame). A SummarizedExperiment contains one or more assays, each represented by a matrix-like object of numeric or other mode.
Table 1. A comparison of different tools for retrieving and analysis of TCGA's data.
|
Here, we describe a new software tool called TCGAbiolinks that aids in querying, downloading, analyzing and integrating TCGA data within a single collective Bioconductor package. TCGAbiolinks was developed exclusively in R and features many of the Bioconductor-specified package and object designs, which are necessary for integration with other Bioconductor packages. The Bioconductor project ensures high-quality, well-documented and interoperable software and the possibility of integration with hundreds of available packages within R (21). The Bioconductor project was also endorsed by the editors at Nature Genetics as a bioinformatics resource (23).
The aim of TCGAbiolinks is four-fold: (i) to facilitate data retrieval via TCGA's DCCWS; (ii) to prepare the data using the appropriate preprocessing strategies; (iii) to provide a means to conduct different standard analyses and advanced integrative analyses and (iv) to allow the user to download a specific version of the data and thus easily reproduce earlier research results. We introduce public methods used in several marker papers to integrate DNA methylation and gene expression data. In addition, our tool extracts published molecular subtype information for each TCGA sample within a tumor type (generally embedded in supplementary tables, PDFs or external websites). Because our tool was developed in the language of R specifically for integration within the Bioconductor project, we have provided most of the TCGA data objects as the Bioconductor-specified ‘SummarizedExperiment’ class (22), thereby allowing easy integration with other data types and statistical methods that are common in the Bioconductor repository.
To introduce and describe the utility and application of TCGAbiolinks, we used four different TCGA cancer types (Brain, Kidney, Breast and Colon) as examples. For each tumor type, we describe methods to extract the different experimental types and integrate the information into a cohesive, biologically specific and hypothesis-driven approach. We also describe how to generate a starburst plot (16). The starburst plot was introduced to illustrate the results of integrating DNA methylation and gene expression data. In addition, we describe how TCGAbiolinks prepares data for integration with other recently published packages, such as ELMER (12), a new Bioconductor package designed to identify candidate regulatory elements in the non-coding regions of the genome associated with cancer, and DNET (24), a new R package designed to uncover the existence of an underlying gene network that is defined by somatic mutations and that at least partially controls cancer survival independently of tumor origin and type. Our package is freely available within the Bioconductor project at http://bioconductor.org/packages/TCGAbiolinks/.
MATERIALS AND METHODS
TCGAbiolinks package
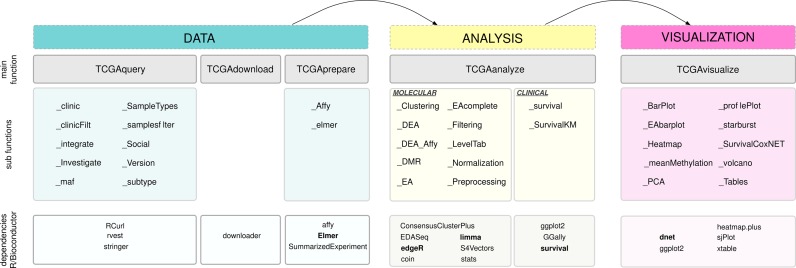
TCGAbiolinks is an R package, which is licensed under the General Public License (GPLv3), and is freely available through the Bioconductor repository (21). By conforming to the strict guidelines for package submission to Bioconductor, we were able to utilize and incorporate existing R/Bioconductor packages and statistics to assist in identifying differentially altered genomic regions defined by mutation, copy number, expression or DNA methylation; to reproduce previous TCGA marker studies; and to integrate data types both within TCGA and across other data types outside of TCGA. TCGAbiolinks consists of functions that can be grouped into three main levels: Data, Analysis and Visualization. More specifically, the package provides multiple methods for the analysis of individual experimental platforms (e.g. differential expression analysis or identifying differentially methylated regions or copy number alterations) and methods for visualization (e.g. survival plots, volcano plots and starburst plots) to facilitate the development of complete analysis pipelines. In addition, TCGAbiolinks offers in-depth integrative analysis of multiple platforms, such as copy number and expression or expression and DNA methylation, as demonstrated and applied in our recent TCGA study of 1122 gliomas (6). These functions can be used independently or in combination to provide the user with fully comprehensible analysis pipelines applied to TCGA data. A schematic overview of the package is presented in Figure 2. We will describe each of the three main levels (Data, Analysis and Visualization) below, highlighting the importance and utility of each associated function and subfunction. We will then introduce four tumor case studies, which will help clarify the utility of TCGAbiolinks for the reader. We have also compiled an in-depth vignette, which describes every function in detail. Here, we will summarize the main functions.
Figure 2.
Overview of TCGAbiolinks functions. TCGAbiolinks is organized in three categories. In the first category (Data), functions to query the TCGA database, to download the data and to prepare it are made available. The second category (Analysis) contains functions that allow the user to carry out different types of analyses; these include clustering (TCGAanalyze_Clustering), differential expression analysis (TCGAanalyze_DEA) and enrichment analysis (TCGAanalyze_EA). Finally, the obtained results can be visualized using the functions in the third category (Visualization): these include principal component analysis (TCGAvisualize_PCA), starburst plots (TCGAvisualize_starburst) and survival curves (TCGAvisualize_SurvivalCoxNET). The different dependencies to other R/Bioconductor packages are specified in the last row of the figure.
DATA
Data handles the retrieval and query of TCGA's data and is divided into three main functions: TCGAquery, TCGAdownload and TCGAprepare.
TCGAquery allows the user to query recent and archived data from the TCGA data portal and to identify samples to download. We have provided extensive subfunctions to allow all types of queries of the TCGA repository (Supplementary Text). The TCGA portal provides data on more than 24 cancer types and 6 different molecular data types (mRNA, SNP, Protein, miRNA, Methylation and Exome) as well as 3 different types of clinical reports (clinical tables, pathology reports and histology image slides). The pathology reports and histology image slides are not prepared but are downloaded to a directory if requested by the user. The full clinical report and molecular data are prepared after download into a SummarizedExperiment object or data frame. TCGA data are organized into three levels: (i) raw, (ii) processed and (iii) interpreted. The TCGAbiolinks user can access all three levels, provided that TCGA has not restricted access due to privacy concerns. In addition, users can retrieve archived data from past projects.
TCGAdownload is a function that downloads the data described in the sample list provided by TCGAquery. There is an option to download the entire '*.tar.gz' folder or to download specific files using the type parameter or the samples parameter (Supplementary Methods). If a sample was previously downloaded by TCGAdownload, the function will not re-download unless the force parameter is set to TRUE. TCGAdownload allows a list of TCGA samples to be downloaded as the output of TCGAquery, e.g. by selecting a level (1, 2 or 3) or common samples between two or three different platforms. This parameter is important if the user is interested in a selected subtype or set of TCGA samples (e.g. young versus old patients; patients treated with or without a specific drug; or patients with good survival versus poor survival).
TCGAprepare is a function that reads data from level three experiments and prepares them for downstream analysis. Specifically, the objects are summarized in a ‘SummarizedExperiment’ object (3) to allow easy integration with other Bioconductor packages, such as GRanges (25), IRanges (25), limma (26) and edgeR (27). The samples are always referred to by their given TCGA barcode. If the user prefers raw data not prepared in a ‘SummarizedExperiment’, there is an option to set the argument ‘SummarizedExperiment’ to FALSE; the data are then prepared as a standard data frame object (rows and columns). Depending on the data type, TCGAprepare can prepare the data for inclusion in an affy object, limma object or another Bioconductor specific package object, such as the newly available ELMER package (12), which integrates gene expression and DNA methylation with known transcription factor-binding elements, as described in use-case #4.
ANALYSIS
The analysis functions and subfunctions are designed to analyze TCGA data through both common and novel methods. The main function, called TCGAanalyze, comprises two distinct types of analysis: molecular analysis and clinical analysis. Once the data are prepared into data matrices (genes/loci in rows and samples in columns) or a SummarizedExperiment using TCGAprepare, the downstream analysis can be divided into (i) supervised analysis: differential expression analysis, enrichment analysis and master regulator analysis or (ii) unsupervised analysis: inference of gene regulatory network, cluster, classification, ROC, AUC, feature selection and survival analysis (Supplementary Text).
TCGAanalyze_Normalization allows users to normalize mRNA transcripts and miRNA using the EDASeq package (28). This function uses within-lane normalization procedures to adjust for GC-content effects (or other gene-level effects) on read counts: LOESS robust local regression and global-scaling, full-quantile and between-lane normalization procedures to adjust for distributional differences between lanes (e.g. sequencing depth).
TCGAanalyze_DEA allows the user to identify differential expression or regions between two populations or conditions. In particular, we used the edgeR package from Bioconductor, which uses the quantile-adjusted conditional maximum likelihood (qCML) method for experiments with a single factor to detect differentially expressed genes (DEGs) (27). Compared to several other estimators, qCML is the most reliable in terms of bias on a wide range of conditions; specifically, qCML performs best in situations involving many small samples with a common dispersion (29). The P-values generated from the analysis are sorted in ascending order and corrected using the Benjamini & Hochberg procedure for multiple testing correction (30). After running TCGAanalyze_DEA, it is possible to filter the output by fold change and/or significance and to use the ‘TCGAanalyze_LevelTab’ function to create a table of DEGs, including fold change (FC), false discovery rate (FDR), gene expression levels of samples under conditions of interest and delta values (the difference in gene expression multiplied by logFC).
TCGAanalyse_DMR allows the user to identify differentially methylated regions (DMRs) between two groups with a DNA methylation difference above a certain threshold. To calculate P-values, this subfunction uses the Wilcoxon rank-sum statistical non-parametric test and adjusts the values using the FDR method.
TCGAanalyze_Clustering allows the user to perform a hierarchical cluster analysis through two methods: ward.D2 and ConsensusClusterPlus (31).
VISUALIZATION
The visualization section allows the user to visualize the results generated by the analysis sections using heatmap, cluster, plots with incremental layers (ggplot2), pathway enrichment analysis and PCA. Furthermore, we provide methods to generate a starburst plot, which was first introduced in 2010 and integrates TCGA gene expression and DNA methylation data (16). The main function can be invoked using TCGAvisualize (see Supplementary Text for more details).
TUMOR TYPES
To illustrate the use of TCGAbiolinks and to highlight some of the main functions above, we selected four TCGA tumor types (Breast, Brain, Kidney and Colon) recently characterized by the TCGA research network (3,32–35).
EXPERIMENTAL AND STATISTICAL ANALYSIS
Using TCGAbiolinks, all TCGA samples were drawn from the TCGA repository, and statistical analyses were applied as described in the Supplementary Text (vignette). In addition, a user guide is provided that details each command and output.
RESULTS
Case study 1 (BRCA downstream analysis with gene expression)
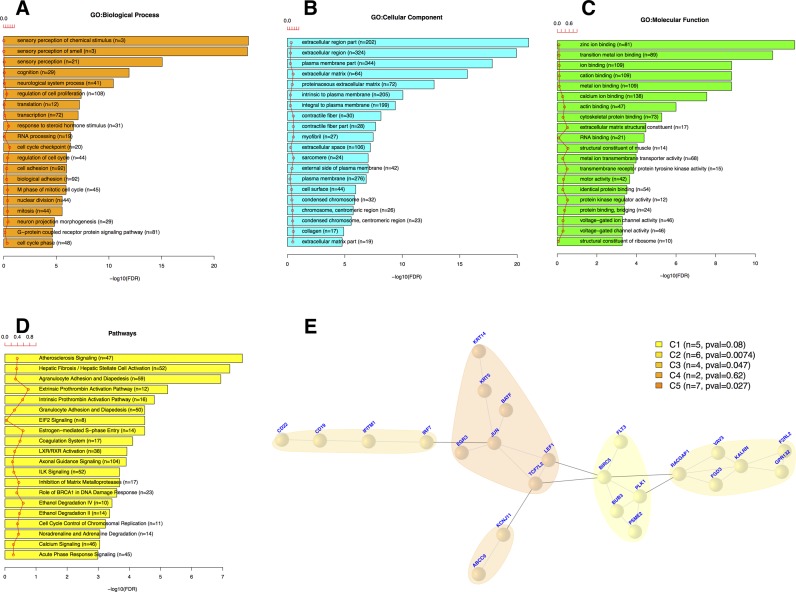
For this case study, we downloaded 114 normal and 1097 breast cancer (BRCA) samples using TCGAquery, TCGAdownload and TCGAprepare to identify differentially expressed genes that might play an important role in survival. Using TCGAanalyze_DEA, we identified 3390 DEGs (log fold change ≥ 1 and FDR < 1%) between the 114 normal (NT) and 1097 BRCA (TP) samples. To deduce the underlying biological process from the DEGs, we performed an enrichment analysis using the TCGAanalyze_EA_complete function (Figure 3A–C). TCGAbiolinks outputs a bar chart with the numbers of genes assigned to the main categories of three ontologies (GO: biological process, GO: cellular component and GO: molecular function). In addition, pathways enriched in DEGs are presented as a bar plot (Figure 3D).
Figure 3.
Integrative analysis of BRCA data using TCGA clinical data and subtypes. Case study n.1 Integrative (or Downstream) analysis of gene expression and clinical data from BRCA disease with univariate and multivariate survival analysis using DNET package. (A–D) Top 20 GO, BP, CC, MF (Biological Process, Cellular Component, Molecular Function) and Pathways enriched by DEGs respectively. Gene annotation by DAVID's database. (E) Significant genes univariate Kaplan-Meier and multivariate with Cox regression, in a net of five communities with same P-values using DNET package, and interactions among genes by STRING's database.
A Kaplan-Meier analysis was used to compute univariate survival curves, and a log-ratio test was applied to assess statistical significance by using the TCGAanalyze_SurvivalKM function, which identified 555 genes whose expression changed significantly with P-values < 0.05. A Cox regression analysis was used to compute multivariate survival curves, and Cox P-values were computed to assess statistical significance by using the TCGAnalyze_SurvivalCoxNET function. The multivariate survival analysis revealed 160 significant genes according to the Cox P-value FDR = 0.05. These genes were found to correlate significantly with survival by both univariate and multivariate analyses, and this gene set was used in the subsequent network analysis.
An interactome network graph was generated using STRING,org.Hs.string version 10 (Human functional protein association network) (24). The network graph was resized with the DNET package (24), considering only multivariate survival genes, with strong interactions (threshold = 700). We obtained a subgraph of 24 nodes and 31 edges (Figure 3E).
Case study 2 (LGG downstream analysis with gene expression)
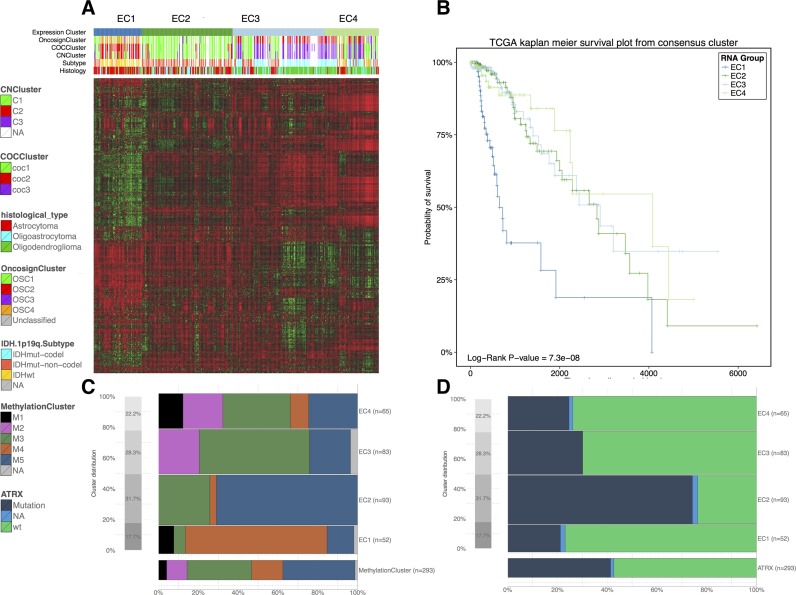
For this case study, we used the recently available lower-grade glioma (LGG) data to investigate the reported subtypes (IDHmutant, IDHwildtype and IDHmutant codels) on the basis of gene expression (3). In particular, we used TCGAbiolinks to download 293 samples profiled using messenger RNA expression (IlluminaHiSeq RNASeqV2) with available molecular subtypes. After the data were downloaded and prepared using TCGAquery, TCGAdownload and TCGAprepare, we searched for possible outliers using the TCGAanalyze_Preprocessing function, which performs an Array Intensity correlation (AAIC). Using the TCGAanalyze_Normalization function, we normalized the mRNA transcripts, and using the TCGAanalyze_Filtering function, we applied three filters to remove features/mRNAs with low signals across samples, obtaining 4578, 4284 and 1187 mRNAs, respectively. Then, we applied hierarchical cluster analyses to the 1187 mRNAs after the three filters described above to confirm the absence of batch effects (data not shown). We then applied the ConsensusClusterPlus package (31) and identified four distinct groups of samples (EC1-EC4) (Figure 4A). The survival curves for each cluster were generated using TCGAanalyze_survival and are shown in Figure 4B. As expected, each cluster effectively separated IDHwildtype tumors (EC1) from IDHmutant-non-codel (EC2) and IDHmutant-codel tumors (EC3 and EC4) (3) (Figure 4C). Additional biological subtypes (DNA methylation subtypes) were reproduced as expected (Figure 4D) (3).
Figure 4.
Case study n.2 Integrative (or Downstream) analysis of gene expression and clinical data from LGG disease with unsupervised clustering and crossing expression clusters with clinical and molecular information. (A) Heatmap of 1187 more variables genes clustered with tree k = 4 in EC1, EC2, EC3, EC4. (B) Kaplan Meier survivals plot for EC clusters. (C and D) Distribution of the DNA Methylation clusters and ATRX mutation within the EC clusters.
Case study 3 (downstream analysis integration of gene expression and methylation data)
The DNA methylation of specific promoter CpG islands has the potential to influence gene expression. In this case study, we used TCGAbiolinks to examine the biological relationship between DNA methylation and gene expression in colon adenocarcinoma (COAD). Using TCGAquery, TCGAdownload and TCGAprepare, we obtained DNA methylation data (Infinium HumanMethylation450 and Infinium HumanMethylation27 platforms) and gene expression data (IlluminaGA_RNASeqV2 platform) for the same COAD samples (34). For some of the downloaded tumor samples, subgroup information (CIMP-Low [CIMP.L] and CIMP-High [CIMP.H]) was available and was downloaded along with the molecular data (34).
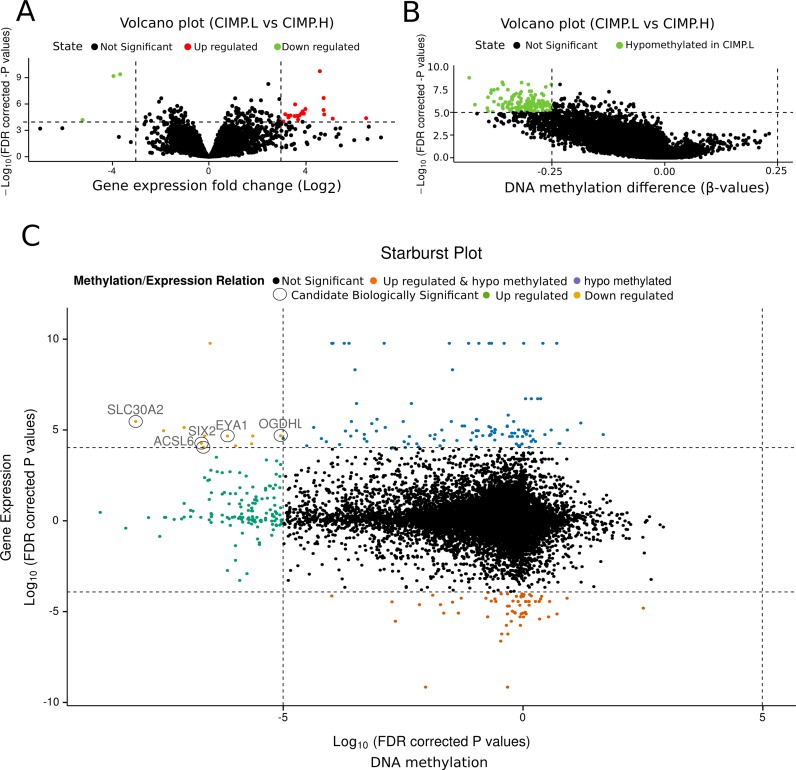
As in case #2, we identified outliers, applied normalization methods and filtered weakly transcribed genes in the downloaded TCGA COAD gene expression data. Using TCGAanalyze_DEA, we identified 34 DEGs (log fold change > 3.0 and FDR < 10e-4), which were represented in a volcano plot (Figure 5A) created using TCGAVisualize_volcano. Using TCGAanlayze_DMR, we identified 73 CpG-methylated probes (DNA methylation difference ≥ 0.25 and correct P-value < 10e-5; Figure 5B). We integrated the DNA methylation and gene expression results as in the previous TCGA marker paper (16,34), by generating a starburst plot (Figure 5C) in which the x-axis is the log10 of the correct P-value for DNA methylation and the y-axis is the log10 of the correct P-value for the expression data. The starburst plot highlights nine distinct quadrants. To incorporate the DNA methylation difference cut-off into the graph, we highlighted genes that might have the potential for silencing due to epigenetic alterations. We highlighted five genes, EYA1, SIX2, ACSL6, OGDHL and SLC30A2, that showed a difference in DNA methylation greater than 0.25 beta-value and a log2 FC greater than 3.0 between CIMP.L and CIMP.H.
Figure 5.
Case study n.3 Integrative analysis of gene expression and DNA methylation data from COAD disease, comparing groups CIMP.L and CIMP.H. (A) Expression volcano plot: fold change of expression data versus significance. (B) DNA methylation volcano plot: difference of DNA methylation versus significance. (C) Starburst plot: DNA methylation significance versus gene expression significance.
Case study 4 (downstream analysis integration of gene expression and methylation data: working with ELMER package)
The interoperability of Bioconductor and the adoption of a common data structure allow the use of multiple packages to apply different analyses to the user's own data. One such example is a newly deposited Bioconductor package called ELMER (12). ELMER analyzes DNA methylation to identify enhancers and correlates the enhancer state with the expression of nearby genes to identify candidate transcriptional targets. The ELMER package selects the distal enhancer probes and then identifies hypomethylated CpGs within the tumor group compared to a matched normal group. For each hypomethylated probe, ELMER then extracts 20 nearby genes (10 downstream and 10 upstream). Finally, it identifies significant probe-gene pairs and identifies enriched DNA signatures, which are then correlated to the gene expression profile.
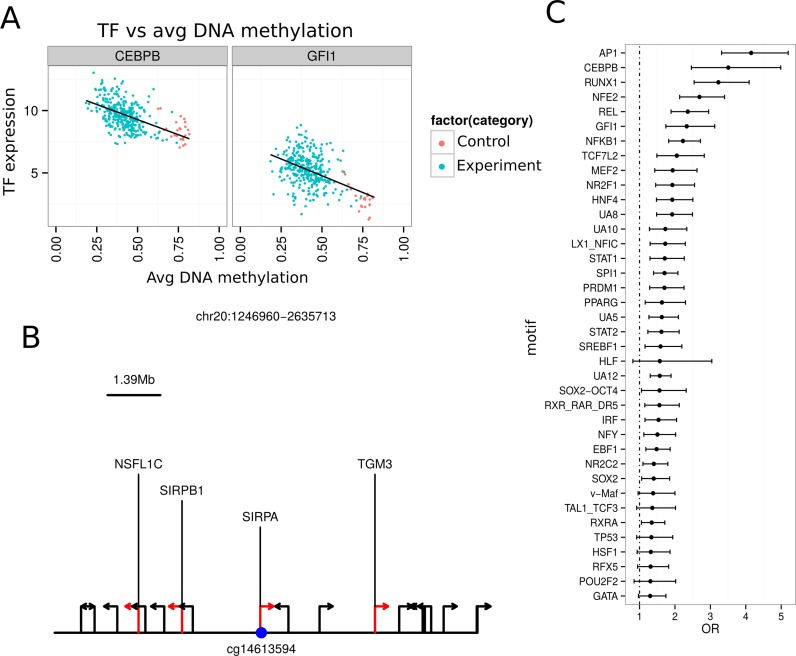
We were able to reproduce the results presented by the ELMER package developer by using TCGA kidney tumor samples (KIRC). Interestingly, we found specific hypomethylated probes associated with three new transcription factors (TFs): STAT2, HNF4A and PRDM1 (Figure 6A,B). This finding may be due to the inclusion of newly generated TCGA KIRC samples not introduced in the original ELMER analysis. For each of the identified motifs, ELMER provides a list of all TFs ranked by association (Figure 6C).
Figure 6.
Case study n.4 TCGAbiolinks integration: integrative analysis using ELMER. (A) Each scatter plot showing the average DNA methylation level of sites with the AP1 motif in all KIRC samples plotted against the expression of the transcription factor CEBPB and GFI1, respectively. (B) The schematic plot shows probe colored in blue and the location of nearby 20 genes, the genes significantly linked to the probe are in red. (C) The plot shows the Odds Ratio (x axis) for the selected motifs with OR above 1.1 and lower boundary of OR above 1.1. The range shows the 95% confidence interval for each Odds Ratio.
DISCUSSION
The wealth of cancer data currently made available by the TCGA consortium offers an enormous opportunity to interpret cancer etiology and progression as well as promote discoveries of novel treatment protocols to reduce both the morbidity and mortality associated with cancer. However, the tools available to exploit these data are not comprehensive, lack complete access to the ever-changing dynamic repository or do not offer users a workflow to reproduce, integrate and/or reanalyze TCGA data in an environment that can also provide access to other statistical analysis methods, such as those provided by the increasingly popular Bioconductor repository (21–23).
Here, we present a new tool called TCGAbiolinks, which is freely available within the Bioconductor project. TCGAbiolinks provides several useful functions to search, download and prepare TCGA samples for data analysis. These functions provide the end user with an opportunity to collect TCGA data fairly easily without the effort of navigating through different data portal sites. Although many tools exist to download TCGA data, none have previously been able to download archived data or published clinical subtypes, which is important for users who need to either reproduce the results presented by the TCGA research network or integrate their own results with TCGA's published work (23) (Table 1). Some tools have been able to perform individual molecular experimental analyses (gene expression and copy number); however, to our knowledge, there was previously no available tool that could fully integrate gene expression and DNA methylation or copy number and gene expression data, thus representing a major challenge in the cancer field (36). These types of analyses have been performed by our group in our recent TCGA papers (3,6,16,35) but were never implemented in a reproducible and standard package until now. We have shown that using TCGAbiolinks, we could reproduce results of previous studies presented by the TCGA Research network, and we have demonstrated methods to advance new findings in the area of genomics and epigenomics research. In addition, by incorporating the available clinical and molecular subtype information, users can now identify biomarkers for specific tumor subtypes based on survival correlation. Our tool provides a comprehensive suite of pipelines, offering users an opportunity to reproduce and perform integrative analyses of TCGA data. As a Bioconductor package, our tool can prepare downloaded TCGA data for integration with existing Bioconductor packages, offering the end user access to a wealth of statistical analyses that are just now being fully explored by the TCGA Research Network and cancer researchers worldwide.
AVAILABILITY
The TCGAbiolinks package is released under GPLv3 License. TCGAbiolinks is freely available within the Bioconductor project at http://bioconductor.org/packages/TCGAbiolinks/.
Supplementary Material
Acknowledgments
We are grateful to Martin Bizet for suggestions in the TCGAbiolinks project.
SUPPLEMENTARY DATA
Supplementary Data are available at NAR Online.
FUNDING
The project was supported by the BridgeIRIS project [http://mlg.ulb.ac.be/BridgeIRIS], funded by INNOVIRIS, Region de Bruxelles Capitale, Brussels, Belgium, and by GENGISCAN: GENomic profiling of Gastrointestinal Inflammatory-Sensitive CANcers, [http://mlg.ulb.ac.be/GENGISCAN] Belgian FNRS PDR [T100914F to G.B.] and by the São Paulo Research Foundation (FAPESP) [2015/02844-7 to T.C.S. & H.N., 2014/02245-3 to T.M.M. & H.N., 2015/07925-5 to H.N.]. Funding for open access charge: São Paulo Research Foundation (FAPESP) [2015/07925-5].
Conflict of interest statement. None declared.
REFERENCES
- 1.Rubin G., Berendsen A., Crawford S.M., Dommett R., Earle C., Emery J., Fahey T., Grassi L., Grunfeld E., Gupta S., et al. The expanding role of primary care in cancer control. Lancet Oncol. 2015;16:1231–1272. doi: 10.1016/S1470-2045(15)00205-3. [DOI] [PubMed] [Google Scholar]
- 2.Weinstein J.N., Collisson E.A., Mills G.B., Shaw K.R., Ozenberger B.A., Ellrott K., Shmulevich I., Sander C., Stuart J.M. The Cancer Genome Atlas Pan-Cancer analysis project. Nat. Genet. 2013;45:1113–1120. doi: 10.1038/ng.2764. [DOI] [PMC free article] [PubMed] [Google Scholar]
- 3.Brat D.J., Verhaak R.G., Aldape K.D., Yung W.K., Salama S.R., Cooper L.A., Rheinbay E., Miller C.R., Vitucci M., Morozova O., et al. Comprehensive, Integrative Genomic Analysis of Diffuse Lower-Grade Gliomas. N. Engl. J. Med. 2015;372:2481–2498. doi: 10.1056/NEJMoa1402121. [DOI] [PMC free article] [PubMed] [Google Scholar]
- 4.Hoadley K.A., Yau C., Wolf D.M., Cherniack A.D., Tamborero D., Ng S., Leiserson M.D., Niu B., McLellan M.D., Uzunangelov V., et al. Multiplatform analysis of 12 cancer types reveals molecular classification within and across tissues of origin. Cell. 2014;158:929–944. doi: 10.1016/j.cell.2014.06.049. [DOI] [PMC free article] [PubMed] [Google Scholar]
- 5.Network T.C.G.A.R. Comprehensive molecular characterization of gastric adenocarcinoma. Nature. 2014;513:202–209. doi: 10.1038/nature13480. [DOI] [PMC free article] [PubMed] [Google Scholar]
- 6.Ceccarelli M., Barthel F.P., Malta T.M., Sabedot T.S., Salama S.R., Murray B.A., Morozova O., Newton Y., Radenbaugh A., Pagnotta S.M., et al. Molecular profiling reveals biologically discrete subsets and pathways of progression in diffuse glioma. Cell. 2016;164 doi: 10.1016/j.cell.2015.12.028. In Press. [DOI] [PMC free article] [PubMed] [Google Scholar]
- 7.Cancer Genome Atlas Research Network. Integrated genomic characterization of papillary thyroid carcinoma. Cell. 2014;159:676–690. doi: 10.1016/j.cell.2014.09.050. [DOI] [PMC free article] [PubMed] [Google Scholar]
- 8.Cancer Genome Atlas Research Network. Comprehensive molecular profiling of lung adenocarcinoma. Nature. 2014;511:543–550. doi: 10.1038/nature13385. [DOI] [PMC free article] [PubMed] [Google Scholar]
- 9.Cancer Genome Atlas Research Network. Comprehensive genomic characterization defines human glioblastoma genes and core pathways. Nature. 2008;455:1061–1068. doi: 10.1038/nature07385. [DOI] [PMC free article] [PubMed] [Google Scholar]
- 10.Bernstein B.E., Stamatoyannopoulos J.A., Costello J.F., Ren B., Milosavljevic A., Meissner A., Kellis M., Marra M.A., Beaudet A.L., Ecker J.R., et al. The NIH Roadmap Epigenomics Mapping Consortium. Nat. Biotechnol. 2010;28:1045–1048. doi: 10.1038/nbt1010-1045. [DOI] [PMC free article] [PubMed] [Google Scholar]
- 11.Myers R.M., Stamatoyannopoulos J., Snyder M., Dunham I., Hardison R.C., Bernstein B.E., Gingeras T.R., Kent W.J., Birney E., Wold B., et al. A user's guide to the encyclopedia of DNA elements (ENCODE) PLoS Biol. 2011;9:e1001046. doi: 10.1371/journal.pbio.1001046. [DOI] [PMC free article] [PubMed] [Google Scholar]
- 12.Yao L., Shen H., Laird P.W., Farnham P.J., Berman B.P. Inferring regulatory element landscapes and transcription factor networks from cancer methylomes. Genome Biol. 2015;16:105. doi: 10.1186/s13059-015-0668-3. [DOI] [PMC free article] [PubMed] [Google Scholar]
- 13.Chin L., Hahn W.C., Getz G., Meyerson M. Making sense of cancer genomic data. Genes Dev. 2011;25:534–555. doi: 10.1101/gad.2017311. [DOI] [PMC free article] [PubMed] [Google Scholar]
- 14.Goldman M., Craft B., Swatloski T., Cline M., Morozova O., Diekhans M., Haussler D., Zhu J. The UCSC Cancer Genomics Browser: update 2015. Nucleic Acids Res. 2015;43:D812–D817. doi: 10.1093/nar/gku1073. [DOI] [PMC free article] [PubMed] [Google Scholar]
- 15.Hinoue T., Weisenberger D.J., Lange C.P., Shen H., Byun H.M., Van Den Berg D., Malik S., Pan F., Noushmehr H., van Dijk C.M., et al. Genome-scale analysis of aberrant DNA methylation in colorectal cancer. Genome Res. 2012;22:271–282. doi: 10.1101/gr.117523.110. [DOI] [PMC free article] [PubMed] [Google Scholar]
- 16.Noushmehr H., Weisenberger D.J., Diefes K., Phillips H.S., Pujara K., Berman B.P., Pan F., Pelloski C.E., Sulman E.P., Bhat K.P., et al. Identification of a CpG island methylator phenotype that defines a distinct subgroup of glioma. Cancer Cell. 2010;17:510–522. doi: 10.1016/j.ccr.2010.03.017. [DOI] [PMC free article] [PubMed] [Google Scholar]
- 17.Zhu Y., Qiu P., Ji Y. TCGA-assembler: open-source software for retrieving and processing TCGA data. Nat. Methods. 2014;11:599–600. doi: 10.1038/nmeth.2956. [DOI] [PMC free article] [PubMed] [Google Scholar]
- 18.Samur M.K., Yan Z., Wang X., Cao Q., Munshi N.C., Li C., Shah P.K. canEvolve: a web portal for integrative oncogenomics. PLoS One. 2013;8:e56228. doi: 10.1371/journal.pone.0056228. [DOI] [PMC free article] [PubMed] [Google Scholar]
- 19.Samur M.K. RTCGAToolbox: a new tool for exporting TCGA Firehose data. PLoS One. 2014;9:e106397. doi: 10.1371/journal.pone.0106397. [DOI] [PMC free article] [PubMed] [Google Scholar]
- 20.Gao J., Aksoy B.A., Dogrusoz U., Dresdner G., Gross B., Sumer S.O., Sun Y., Jacobsen A., Sinha R., Larsson E., et al. Integrative analysis of complex cancer genomics and clinical profiles using the cBioPortal. Sci. Signal. 2013;6:pl1. doi: 10.1126/scisignal.2004088. [DOI] [PMC free article] [PubMed] [Google Scholar]
- 21.Gentleman R.C., Carey V.J., Bates D.M., Bolstad B., Dettling M., Dudoit S., Ellis B., Gautier L., Ge Y., Gentry J., et al. Bioconductor: open software development for computational biology and bioinformatics. Genome Biol. 2004;5:R80. doi: 10.1186/gb-2004-5-10-r80. [DOI] [PMC free article] [PubMed] [Google Scholar]
- 22.Huber W., Carey V.J., Gentleman R., Anders S., Carlson M., Carvalho B.S., Bravo H.C., Davis S., Gatto L., Girke T., et al. Orchestrating high-throughput genomic analysis with Bioconductor. Nat. Methods. 2015;12:115–121. doi: 10.1038/nmeth.3252. [DOI] [PMC free article] [PubMed] [Google Scholar]
- 23.Credit for code. Nat. Genetics. 2014;46:1. doi: 10.1038/ng.2869. [DOI] [PubMed] [Google Scholar]
- 24.Fang H., Gough J. The ‘dnet’ approach promotes emerging research on cancer patient survival. Genome Med. 2014;6:64. doi: 10.1186/s13073-014-0064-8. [DOI] [PMC free article] [PubMed] [Google Scholar]
- 25.Lawrence M., Huber W., Pages H., Aboyoun P., Carlson M., Gentleman R., Morgan M.T., Carey V.J. Software for computing and annotating genomic ranges. PLoS Comput. Biol. 2013;9:e1003118. doi: 10.1371/journal.pcbi.1003118. [DOI] [PMC free article] [PubMed] [Google Scholar]
- 26.Ritchie M.E., Phipson B., Wu D., Hu Y., Law C.W., Shi W., Smyth G.K. limma powers differential expression analyses for RNA-sequencing and microarray studies. Nucleic Acids Res. 2015;43:e47. doi: 10.1093/nar/gkv007. [DOI] [PMC free article] [PubMed] [Google Scholar]
- 27.Robinson M.D., McCarthy D.J., Smyth G.K. edgeR: a Bioconductor package for differential expression analysis of digital gene expression data. Bioinformatics. 2010;26:139–140. doi: 10.1093/bioinformatics/btp616. [DOI] [PMC free article] [PubMed] [Google Scholar]
- 28.Risso D., Schwartz K., Sherlock G., Dudoit S. GC-content normalization for RNA-Seq data. BMC Bioinformatics. 2011;12:480. doi: 10.1186/1471-2105-12-480. [DOI] [PMC free article] [PubMed] [Google Scholar]
- 29.Robinson M.D., Smyth G.K. Small-sample estimation of negative binomial dispersion, with applications to SAGE data. Biostatistics. 2008;9:321–332. doi: 10.1093/biostatistics/kxm030. [DOI] [PubMed] [Google Scholar]
- 30.Benjamini Y., Hochberg Y. Controlling the False Discovery Rate: A Practical and Powerful Approach to Multiple Testing. J. R. Stat. Soc. B (Methodological) 1995;57:289–300. [Google Scholar]
- 31.Wilkerson M.D., Hayes D.N. ConsensusClusterPlus: a class discovery tool with confidence assessments and item tracking. Bioinformatics. 2010;26:1572–1573. doi: 10.1093/bioinformatics/btq170. [DOI] [PMC free article] [PubMed] [Google Scholar]
- 32.Cancer Genome Atlas Research Network. Comprehensive molecular portraits of human breast tumours. Nature. 2012;490:61–70. doi: 10.1038/nature11412. [DOI] [PMC free article] [PubMed] [Google Scholar]
- 33.Davis C.F., Ricketts C.J., Wang M., Yang L., Cherniack A.D., Shen H., Buhay C., Kang H., Kim S.C., Fahey C.C., et al. The somatic genomic landscape of chromophobe renal cell carcinoma. Cancer Cell. 2014;26:319–330. doi: 10.1016/j.ccr.2014.07.014. [DOI] [PMC free article] [PubMed] [Google Scholar]
- 34.Cancer Genome Atlas Research Network. Comprehensive molecular characterization of human colon and rectal cancer. Nature. 2012;487:330–337. doi: 10.1038/nature11252. [DOI] [PMC free article] [PubMed] [Google Scholar]
- 35.Brennan C.W., Verhaak R.G., McKenna A., Campos B., Noushmehr H., Salama S.R., Zheng S., Chakravarty D., Sanborn J.Z., Berman S.H., et al. The somatic genomic landscape of glioblastoma. Cell. 2013;155:462–477. doi: 10.1016/j.cell.2013.09.034. [DOI] [PMC free article] [PubMed] [Google Scholar]
- 36.Laird P.W. Principles and challenges of genomewide DNA methylation analysis. Nat. Rev. Genet. 2010;11:191–203. doi: 10.1038/nrg2732. [DOI] [PubMed] [Google Scholar]
Associated Data
This section collects any data citations, data availability statements, or supplementary materials included in this article.


