

Abstract
Background:
In order to ascertain the impact of a biomarker-based (personalized) strategy, we compared outcomes between US Food and Drug Administration (FDA)–approved cancer treatments that were studied with and without such a selection rationale.
Methods:
Anticancer agents newly approved (September 1998 to June 2013) were identified at the Drugs@FDA website. Efficacy, treatment-related mortality, and hazard ratios (HRs) for time-to-event endpoints were analyzed and compared in registration trials for these agents. All statistical tests were two-sided.
Results:
Fifty-eight drugs were included (leading to 57 randomized [32% personalized] and 55 nonrandomized trials [47% personalized], n = 38 104 patients). Trials adopting a personalized strategy more often included targeted (100% vs 65%, P < .001), oral (68% vs 35%, P = .001), and single agents (89% vs 71%, P = .04) and more frequently permitted crossover to experimental treatment (67% vs 28%, P = .009). In randomized registration trials (using a random-effects meta-analysis), personalized therapy arms were associated with higher relative response rate ratios (RRRs, compared with their corresponding control arms) (RRRs = 3.82, 95% confidence interval [CI] = 2.51 to 5.82, vs RRRs = 2.08, 95% CI = 1.76 to 2.47, adjusted P = .03), longer PFS (hazard ratio [HR] = 0.41, 95% CI = 0.33 to 0.51, vs HR = 0.59, 95% CI = 0.53 to 0.65, adjusted P < .001) and a non-statistically significantly longer OS (HR = 0.71, 95% CI = 0.61 to 0.83, vs HR = 0.81, 95% CI = 0.77 to 0.85, adjusted P = .07) compared with nonpersonalized trials. Analysis of experimental arms in all 112 registration trials (randomized and nonrandomized) demonstrated that personalized therapy was associated with higher response rate (48%, 95% CI = 42% to 55%, vs 23%, 95% CI = 20% to 27%, P < .001) and longer PFS (median = 8.3, interquartile range [IQR] = 5 vs 5.5 months, IQR = 5, adjusted P = .002) and OS (median = 19.3, IQR = 17 vs 13.5 months, IQR = 8, Adjusted P = .04). A personalized strategy was an independent predictor of better RR, PFS, and OS, as demonstrated by multilinear regression analysis. Treatment-related mortality rate was similar for personalized and nonpersonalized trials.
Conclusions:
A biomarker-based approach was safe and associated with improved efficacy outcomes in FDA-approved anticancer agents.
Recently, a deeper understanding of cancer biology has begun to change old paradigms in cancer treatment. Molecular abnormalities are being described as oncogenic or as markers that permit differentiation of normal elements from malignant ones, offering a unique opportunity for target-directed treatment. The US Food and Drug Administration (FDA) has recently granted marketing authorization for the first next-generation genomic sequencer (1), which, along with rapidly declining costs, is moving genomic diagnostic tests to practice.
In 2004, only 11 targeted anticancer agents had entered clinical trials (2), while in 2013 seven new targeted agents received approval by the FDA for cancer treatment, adding to an extensive list (3). Additionally, many new molecular targeted agents are in development. Strategies to better select patient populations for these new drugs in order to maximize their benefits are in development as well.
Historically, many drugs were approved without a biomarker for patient selection, including most cytotoxic chemotherapies and some targeted agents. Treatment selection based on biomarkers reflecting biology-specific features that permit differentiation of normal vs malignant cells have brought remarkable advances in oncology. Illustrative examples are imatinib for the treatment of Bcr-Abl–aberrant chronic myelogenous leukemia (4) and trastuzumab for HER-2 overexpressing breast cancer (5), which, according to the FDA, started the concept of personalized medicine in cancer (6). In some cancers, a subgroup of patients whose tumors do not present the biomarker may actually have worse outcomes when treated with targeted agents (7,8).
Despite these examples, the evidence supporting the benefit of a personalized (biomarker-based) approach to cancer treatment is still a matter of debate, with a need for an overview of existing quality data (9). Therefore, we performed a comprehensive analysis of clinical trials that led to FDA drug approval between September 1998 and June 2013. Our analysis included meta-analysis, meta-regression, Wilcoxon test, and weighted least regression analysis applied as appropriate to the 57 randomized trials and the 112 total trials (randomized and nonrandomized). We aimed to compare efficacy outcomes between approved treatments that employed a personalized therapy strategy (matching a molecularly targeted compound with individuals harboring the cognate target) vs those who did not.
Methods
Search Strategy
Anticancer agents newly approved between September 1998 (which represents FDA approval of trastuzumab for metastatic breast cancer, starting an era of biomarker-driven therapies) and June 2013 were identified on the FDA website (10). Agents approved for the treatment of advanced solid and hematologic malignancies were selected for analysis. Agents approved for pediatric cancer, supportive care, loco-regional treatment, hormonal therapies, vaccines, and agents whose basic compound had already been approved before September 1998 were excluded from analysis. The original and most recent package inserts for each agent were reviewed to identify original and posterior indications and clinical trials leading to agent approval. Reports of original trials were obtained through MEDLINE or the ASCO meetings website (11) (if the clinical trial was not yet published). Whenever appropriate, we followed the Preferred Reporting Items for Systematic Reviews and Meta-Analysis (PRISMA) statement (12).
For the purpose of our analysis, personalized therapy and biomarker-based strategy were used interchangeably and carried the same meaning as “matched targeted therapy.” If a targeted agent was used, but it was not matched to the patient population, it was not considered personalized. We defined personalized therapy when a treatment met one of the following criteria: 1) Cognate biomarker was used to select patients for treatment or; 2) No biomarker was used, but at least 50% of patients are known to harbor the cognate biomarker. Homogeneity of biomarkers is generally found only in rare tumor types that are often defined by their specific molecular characteristic. Examples include (but are not limited to) hairy cell leukemia (~100 percent have BRAF mutations) and chronic myelogenous leukemia (~100% carry Bcr-Abl rearrangements) (13,14). In all common solid tumors, any one biomarker is found in only a small subset of patients. A drug was considered personalized if the half maximal inhibitory concentration (IC50) impacted the target at low nM range (<100nM) (for small molecule inhibitors) or if the target was the primary one recognized by an antibody.
A list of biomarkers accepted for classification of personalized therapy in this study is available online (Supplementary Table 1, available online).
Study Selection and Data Extraction
To be included in the analysis, a trial referred from package insert must have evaluated a drug in an experimental arm, either as a single agent or a combination and reported efficacy endpoints. When the agent was approved in combination, the experimental drug was used for classification. We considered response rate (RR), progression-free survival (PFS) or time to tumor progression (TTP) when PFS was not available, and overall survival (OS) as acceptable efficacy endpoints. Further clinical trials of the same drug were included in the analysis if a new indication for a different tumor type and/or a new combination and/or a new biomarker for patient selection were approved. In these cases, the trials leading to the change in the FDA indication were included as part of the data analysis. Data extraction was conducted independently by two investigators (DLFJ and MS) and any discrepancies were resolved by consensus in frequent meetings in the presence of the principal investigator (RK). All deaths reported by investigators as “possibly,” “probably,” or “definitely” related to treatment were considered toxicity-related deaths.
Responses were recorded according to the response criteria adopted in the trial: for solid tumors, partial and complete responses as per Response Evaluation in Solid Tumors Criteria (RECIST) (15) or World Health Organization Criteria (WHO) (16); for chronic myelogenous leukemia (CML), major cytogenetic responses; for multiple myeloma (MM), partial and complete responses; for acute myelogenous leukemia (AML), complete responses; and for lymphomas, partial and complete responses by WHO criteria. We considered as valid biomarkers results from mutational analysis, cytogenetic or fluorescence in situ hybridization (FISH) tests,or immunohistochemistry assays (for anti-HER2 therapies or for hematological surface markers).
Statistical Analyses
All statistical analyses were performed/confirmed by statisticians (CW and JJL). The primary outcome of this meta-analysis was to compare efficacy outcomes (RR, PFS, and OS) and treatment-related mortality between agents developed under a biomarker-based rational (personalized therapy) vs those that did not. For the subgroup of randomized trials in which an experimental arm was compared with a control, we performed a meta-analysis of hazards ratios (HRs) for PFS/TTP and OS and relative response rate ratio (RRR) for personalized trials vs nonpersonalized using a random effects model. The random effects model takes into account of both within-study variation and between-study variation. Relative risk for response ratio was calculated as the response rate in the experimental arm divided by the response rate in the control arms. Randomized trials in which both arms were considered personalized were excluded from this analysis.
For the trials providing only the hazard ratios without 95% confidence intervals (CIs), we used the method by Tierney et al. (17) to estimate 95% confidence intervals when a P value for the hazard ratio was available. For the randomized trials with a 1:1 randomization ratio where the hazard ratio was not provided but the number of events and the number of randomized patients was available, we used the method of Tierney et al. (17) to estimate the HR and then used the method of Altman (18) to estimate the 95% confidence intervals for the hazard ratios when a P value for the difference between the experimental arm and the control arm was available.
A random effects model based on estimate (log of the response rate, log relative response rate ratios, log hazard ratios) and their standard error was used to pool the estimate across studies using the DerSimonian-Laird method (19). Random effects meta-regression model (18,20) via linear mixed model was used to assess the relationship between the estimates and personalized therapy status, adjusted for other potential confounders/mediators. For the meta-regression models, we assessed these mediators as potential confounders: 1) Type of tumor: solid vs hematologic, 2) Previous treatment: yes vs no, 3) Control arm (placebo or BSC vs drug), 4) Allowance of cross-over (for OS only). Heterogeneity between studies was quantified by the between-study variance tau2 and the Cochran’s Q test and/or the I2 statistics, which describes the percentage of variation across studies that is because of heterogeneity rather than chance (21). Studies were classified as presenting low (I2 ≤ 50%), moderate (I2 > 50% and ≤ 75%), or high heterogeneity (I2 ≥75%).
Similarly, for randomized and nonrandomized trials combined, we performed a pooled analysis of the response rates (RRs) for experimental arms using the random effects model and used the meta-regression model to adjust for mediators/confounders: 1) Type of tumor: solid vs hematologic, 2) Study design: randomized vs nonrandomized, 3) Previous chemotherapy: yes vs no, 4) Number of patients evaluable for response in the experimental arm (>178 vs <178). For randomized and nonrandomized trials (single-arm studies) we also compared a pooled analysis of median PFS and OS for experimental arms. To account for differences between studies, we weighted the analysis in proportion to the study sample size using a weighted least-squares analysis. Statistical dispersion was measured by the interquartile range (IQR; the distance between the 75th and the 25th percentile). Assessment of independent samples was done using the Wilcoxon rank-sum test. Multiple linear regression models were fit to assess the association between PFS and OS and several independent variables, in which the variables included the study design (randomized vs nonrandomized), enrichment for molecular targets (personalized vs not personalized), previous systemic therapies (chemo naive vs pretreated), FDA approval date (before the median vs after; the median date was 10/01/2007), number of patients per arm (6–178; 179–839), type of treatment (chemotherapy vs targeted), administration route (oral vs injection), single agent vs combination, and tumor type (solid vs liquid). The final model for PFS analysis contained only the independent variables that were statistically significant in the univariate analysis, while for OS analysis variables with P values of less than .2 were also included. A P value of .05 or less was considered statistically significant. All statistical tests were two-sided.
Statistical analyses were done with R (http://www.r-project.org/) using packages “meta” and “metaphor” and SPSS version 22 (SPSS) software.
Results
Search Results
We identified 74 FDA-approved drugs for adult cancer treatment indications. After applying previously described criteria, we included 58 approved drugs. Most of the drugs (n = 43, 74%) were classified as targeted agents and approved exclusively for treatment of solid tumors (n = 34, 59%). Review of the package insert from included drugs identified 57 randomized (18 [32%] personalized) and 55 nonrandomized trials (26 [47%] personalized), which were the basis of our analysis. A diagram describing the inclusion of trials in the different analyses is available online (Supplementary Figure 1, available online). These trials enrolled a total of 38 104 patients (30 701, randomized; 7403, nonrandomized trials) (Supplementary Tables 2 and 3, available online).
Characteristics of Trials
Personalized trials accrued a median number of 152 patients (range = 7–533) per experimental arm compared with 204.5 (33–862) for nonpersonalized trials (P = .29). Agents that were tested with a personalized strategy were all considered to be targeted agents (Table 1). In contrast, only 65% were classified as targeted when a nonpersonalized approach was employed (P < .001). Statistically significant differences between personalized vs nonpersonalized trials were also detected regarding increased use of oral (68% vs 35%, P = .001) and single agents (89% vs 71%, P = .04), respectively. Allowance for crossover to the experimental arm was higher in randomized trials with personalized treatments in comparison with nonpersonalized (67% vs 28%, P = .009). There was a suggestion for nonpersonalized trials to be more frequently randomized, although with no statistical significance (P = .12) (Table 1; Supplementary Table 4, available online).
Table 1.
Comparison of the main characteristics between personalized and nonpersonalized trials
| Characteristic | Personalized trials (n = 44) | Non-personalized trials (n = 68) | P* |
|---|---|---|---|
| Median number of patients per experimental arm (range)† | 152 (7–553) | 204.5 (33–862) | .29 |
| Trial design, No. (%) | |||
| Randomized | 18 (41) | 39 (57) | .12 |
| Nonrandomized | 26 (59) | 29 (43) | |
| Class agent, No. (%) | |||
| Cytotoxic | 0 | 24 (35) | <.001 |
| Targeted | 44 (100) | 44 (65) | |
| Tumor type, No. (%) | |||
| Solid | 20 (45) | 47 (69) | .02 |
| Hematologic | 24 (55) | 21 (31) | |
| Route, No. (%) | |||
| Intravenous | 14 (32) | 44 (65) | .001 |
| Oral | 30 (68) | 24 (35) | |
| Treatment, No. (%) | |||
| Single agent | 39 (89) | 48 (71) | .04 |
| Combination | 5 (11) | 20 (29) | |
| Population, No. (%) | |||
| Treatment-naïve | 13 (30) | 18 (26) | .83 |
| Previous treatment | 31 (70) | 50 (74) | |
| Control arm (for randomized trials), No. (%) | |||
| Active treatment | 13/18 (72) | 28/39 (72) | 1.00 |
| Placebo/BSC | 5/18 (28) | 11/39 (28) | |
| Crossover allowed (for randomized trials), No. (%) | |||
| Yes | 12/18 (67) | 11/39 (28) | .009 |
| No | 6/18 (33) | 28/39 (72) | |
* Wilcoxon rank-sum test (two-sided).
† Not including control arm for randomized trials. BSC = best supportive care.
Meta-Analysis of Relative Benefits of Personalized Therapy in Randomized Registration Trials
We performed a meta-analysis of relative benefits in RR, PFS, and OS between the experimental arms and their corresponding control arms for randomized registration trials (Table 2). Fifty-one studies were included in the RRR and PFS analysis. The RRR analysis showed a higher likelihood of response with a personalized compared with nonpersonalized strategy (RRR = 3.82, 95% CI = 2.51 to 5.82, vs 2.08, 95% CI = 1.76 to 2.47, P = .009) (Figure 1A). After adjusting for other mediators in the meta-regression model, personalized therapy remained as a statistically significant predictor of RRR (adjusted P = .03) (Table 2).
Table 2.
Meta-analysis (univariate and multivariate) using random effects model according to trial characteristics (including personalized vs non-personalized drugs) in randomized registration trials
| Characteristic | Relative response rate ratio | PFS | OS | |||
|---|---|---|---|---|---|---|
| N | RRR (95% CI) | N | HR (95% CI) | N | HR (95% CI) | |
| Personalized status | ||||||
| Personalized | 14 | 3.82 (2.51 to 5.82) | 13 | 0.41 (0.33 to 0.51) | 13 | 0.71 (0.61 to 0.83) |
| Non-personalized | 37 | 2.08 (1.76 to 2.47) | 38 | 0.59 (0.53 to 0.65) | 33 | 0.81 (0.77 to 0.85) |
| P (univariate) | .009 | .004 | .11 | |||
| P (meta-regression)*,† | .03 | <.001 | .07 | |||
| Control arm | ||||||
| Placebo | 16 | 7.03 (4.27 to 11.58) | 15 | 0.42 (0.37 to 0.48) | 15 | 0.81 (0.74 to 0.90) |
| Active treatment | 35 | 2.08 (1.75 to 2.47) | 36 | 0.60 (0.54 to 0.67) | 31 | 0.78 (0.74 to 0.83) |
| P (univariate) † | <.001 | <.001 | .51 | |||
| P (meta-regression) *,† | <.001 | <.001 | NA | |||
| Tumor type | ||||||
| Solid | 43 | 2.27 (1.92 to 2.69) | 44 | 0.56 (0.50 to 0.62) | 41 | 0.81 (0.77 to 0.85) |
| Hematologic | 8 | 3.30 (1.93 to 5.63) | 7 | 0.42 (0.33 to 0.54) | 5 | 0.60 (0.49 to 0.73) |
| P (univariate) † | .2 | .04 | .004 | |||
| P (meta-regression) *,† | NA | .004 | .006 | |||
| Treatment status | ||||||
| Naïve | 22 | 2.23 (1.76 to 2.83) | 23 | 0.54 (0.46 to 0.63) | 20 | 0.77 (0.71 to 0.84) |
| Pretreated | 29 | 2.70 (2.09 to 3.50) | 28 | 0.54 (0.47 to 0.61) | 26 | 0.81 (0.76 to 0.87) |
| P (univariate) † | .29 | .99 | .37 | |||
| Cross-over allowed | ||||||
| Yes | 23 | 3.67 (2.86 to 4.69) | 22 | 0.42 (0.37 to 0.47) | 21 | 0.76 (0.68 to 0.85) |
| No | 28 | 1.68 (1.45 to 1.95) | 29 | 0.65 (0.58 to 0.72) | 25 | 0.80 (0.76 to 0.84) |
| P (univariate) † | <.001 | <.001 | .48 | |||
| P (meta-regression)*,† | NA | NA | .32 | |||
* Meta-regression analysis was performed including only factors considered statistically significant in univariate analysis. In the case of allowance for crossover for RRR and PFS analysis, meta-regression was not performed because crossover occurred after progression and could therefore not confound responses or PFS. HR = hazard ratio; N = number of trials included; NA = not applicable; OS = overall survival; PFS = progression-free survival; RRR = relative response rate ratio.
† P values were two-sided.
Figure 1.
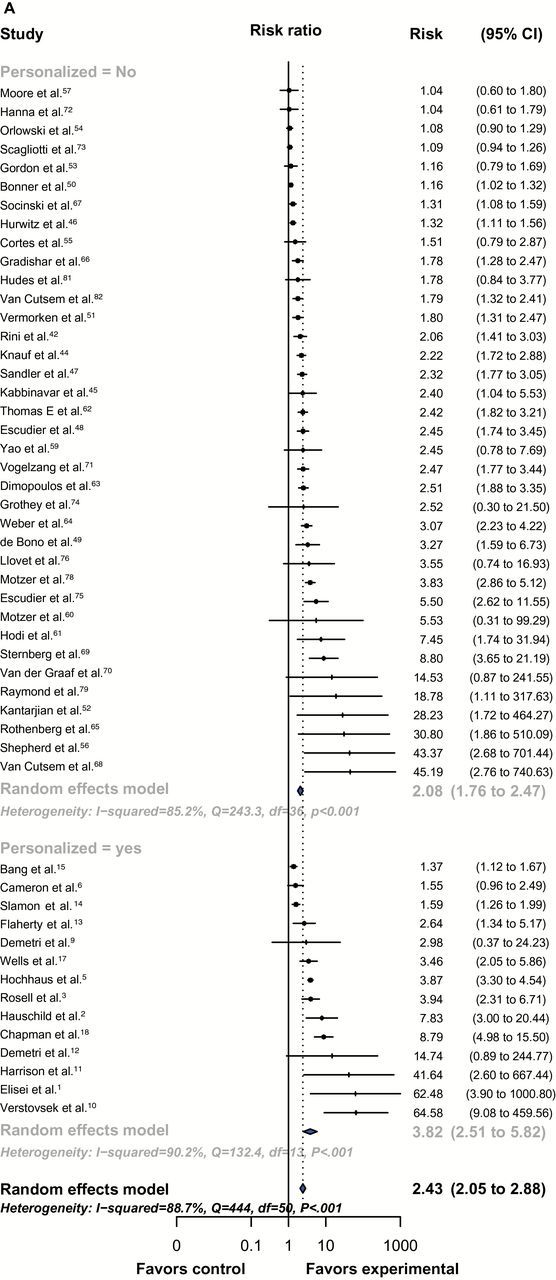
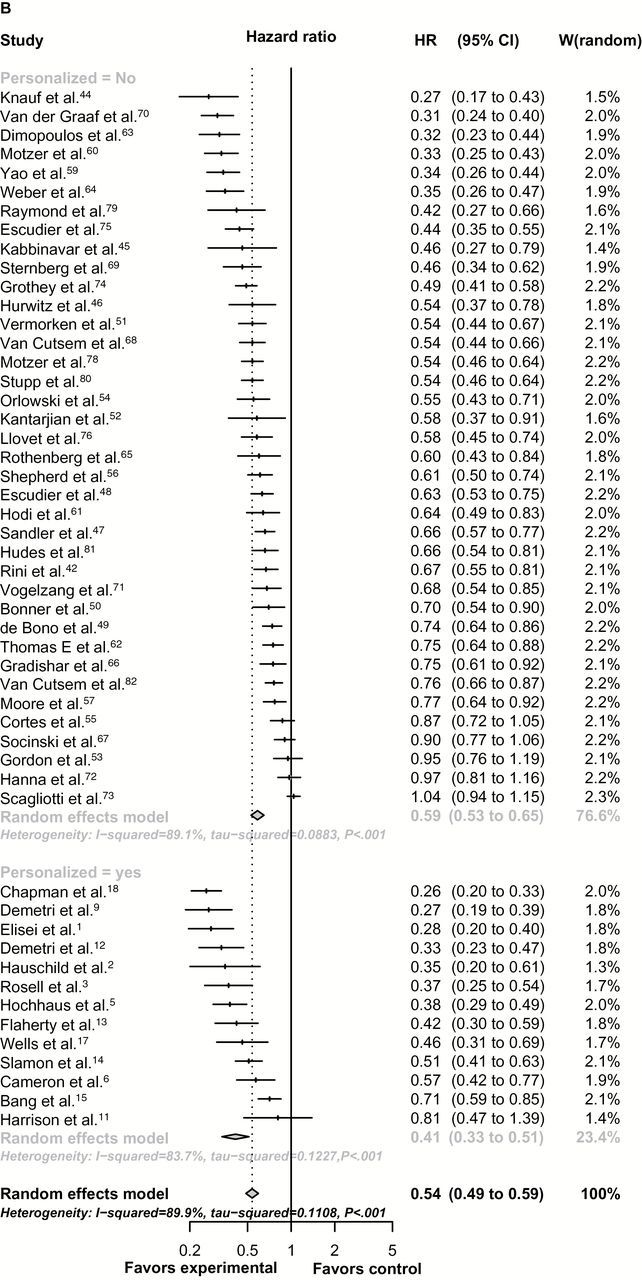
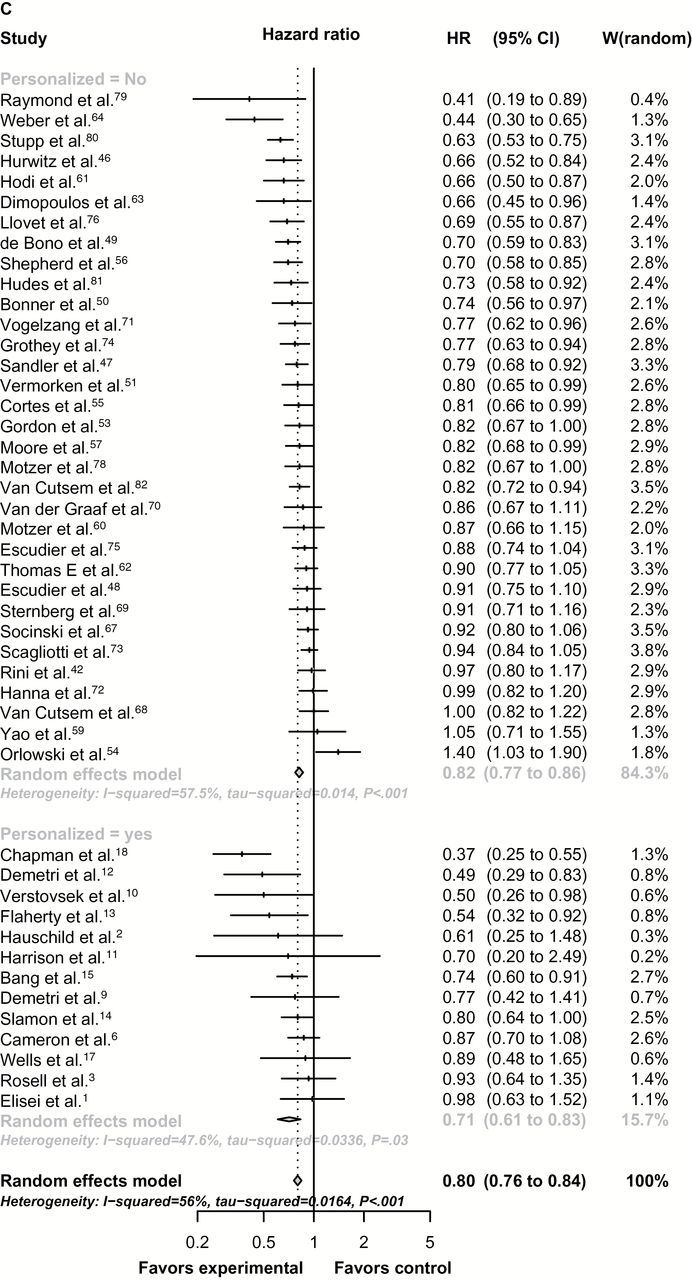
Forest-plot representing the relative response rate ratio (A), hazard ratios for progression-free survival (PFS) (B), and overall survival (OS) (C) between experimental and control arms by personalized therapy status in randomized registration trials. Studies are labeled by first author’s last name, and references were numbered according to supplementary references. In (A), RRR is shown and lines to the right of the vertical line indicate improvement in the experimental arm. In (B and C), the plots show hazard ratios (HRs) and, therefore, lines to the left of the vertical line indicate improvement (ie, lower HR for PFS or OS) for the experimental arm. P values were tested for subgroup differences (chi-square) and are two-sided. df = degree of freedom; Q = Cochran’s Q test.
In randomized trials, the estimated hazard ratio for PFS of experimental compared with control arms was 0.41 (95% CI = 0.33 to 0.51) for personalized compared with 0.59 (95% CI = 0.53 to 0.65) for nonpersonalized studies (nonadjusted P = .004), indicating a greater improvement in PFS in the personalized approach (Figure 1B), which was confirmed in the meta-regression model (adjusted P < .001). In RRR and PFS analysis, heterogeneity between studies within personalized and nonpersonalized cohorts was classified as high (I2 > 75%).
For the 46 randomized trials where the hazard ratio of OS and corresponding 95% confidence interval were provided, the estimated hazard ratios for OS were 0.71 (95% CI = 0.61 to 0.83) for personalized compared with 0.81 (95% CI = 0.77 to 0.85) for nonpersonalized studies. This difference was not statistically significant (Figure 1C). With adjustment for other mediators, including crossover to experimental arm and type of tumor (solid vs hematologic), personalized therapy was associated with slightly lower hazard ratios for OS (adjusted P = .07). Heterogeneity between studies within personalized and nonpersonalized cohorts was classified as moderate (50% < I2 ≤ 75%).
An exploratory univariate analysis suggested, amongst biomarker-driven trials, response rate was improved for trials adopting biomarkers such as immunohistochemistry or FISH vs mutation analysis, while for RRR the opposite was true (Supplementary Table 5, available online). The number of studies in these analyses is small and might be subject to bias, and this statistical significance did not hold in multivariate analysis (results not shown). In addition, no statistically significant differences were observed for PFS or OS in the same stratified analysis.
Personalized Therapy and Response Rate in All Trials
Of the 111 trials (both randomized and nonrandomized) reporting responses, the RR in the experimental arm was statistically significantly higher in the personalized trials compared with nonpersonalized trials (random effect model meta-analysis) (RR = 48%, 95% CI = 42% to 55%, vs RR = 23%, 95% CI = 20% to 27%, respectively, P < .001), even within randomized and nonrandomized subgroups (Table 3). We also observed higher RRs in nonrandomized vs randomized studies (40% vs 25%, P < .001), treatment-naïve vs pretreated population (40% vs 29%, P = .01), trials with a smaller number of patients (38% vs 27%, P = .04), and hematologic vs solid tumors (46% vs 24%, P < .001). After adjustments for statistically significant factors, personalized therapy remained a statistically significant determinant of response rate in experimental arms of registration trials, with an adjusted relative risk ratio of 2.22 (95% CI = 1.64 to 3.02) when compared with nonpersonalized arms (P < .001). In addition, trials involving hematologic tumors and a treatment-naïve population were also statistically significantly associated with higher RR in the meta-regression model.
Table 3.
Meta-analysis (univariate and multivariate) using random effects model comparing the response rate in the experimental arms between personalized and nonpersonalized registration trials. Unlike Table 2, data from both randomized and nonrandomized trials were included
| Characteristic | Response rate in the experimental arm | |
|---|---|---|
| No. of studies | RR % (95% CI) | |
| Personalized status | ||
| Personalized | 44 | 48 (42 to 55) |
| Nonpersonalized | 67 | 23 (20 to 27) |
| P (univariate) | <.001 | |
| P (meta-regression)* | <.001 | |
| Study design† | ||
| Randomized | 56 | 25 (21 to 31) |
| Nonrandomized | 55 | 40 (35 to 45) |
| P (univariate) | <.001 | |
| P (meta-regression)* | .14 | |
| Tumor type | ||
| Solid | 66 | 24 (20 to 28) |
| Hematologic | 45 | 46 (40 to 53) |
| P (univariate) | <.001 | |
| P (meta-regression)* | <.001 | |
| Treatment status | ||
| Naïve | 30 | 40 (33 to 49) |
| Pretreated | 81 | 29 (25 to 34) |
| P (univariate) | .01 | |
| P (meta-regression)* | <.001 | |
| Class of agent | ||
| Cytotoxic | 23 | 30 (24 to 36) |
| Targeted | 88 | 33 (28 to 38) |
| P (univariate) | .44 | |
| P (meta-regression)* | NA | |
| Single agent | ||
| Yes | 87 | 31(27 to 36) |
| No | 24 | 35 (28 to 43) |
| P (univariate) | .39 | |
| P (meta-regression)* | NA | |
| Patients per arm‡ | ||
| 6–178 | 56 | 38 (33 to 44) |
| 179–839 | 55 | 27 (22 to 32) |
| P (univariate) | .04 | |
| P (meta-regression)* | .19 | |
| Route | ||
| Oral | 53 | 26 (23 to 35) |
| Intravenous | 58 | 36 (31 to 41) |
| P (univariate) | .09 | |
| P (meta-regression)* | NA | |
| Approval date‡ | ||
| 09/1998-09/2007 | 53 | 35 (29 to 42) |
| 10/2007-06/2013 | 58 | 30 (25 to 35) |
| P (univariate) | .23 | |
| P (meta-regression)* | NA | |
* Meta-regression analysis was performed, including only factors considered statistically significant in univariate analysis; otherwise, analysis was not applicable for the characteristic. All P values were two-sided. CI = confidence interval; RR = rate ratio.
† Response rates (95% CI) in the experimental arm were 41% (30%-52%) for randomized personalized trials (n = 18 studies), 20% (15%-25%) for randomized nonpersonalized trials (n = 38), 54% (46%-61%) for nonrandomized personalized trials (n = 26), and 29% (26%-34%) for nonrandomized nonpersonalized trials (n = 29); all P values were less than .001 for comparison of personalized vs nonpersonalized trials within randomized and nonrandomized trials.
‡ Cutoff used was the median of distribution.
Personalized Therapy and Progression-Free Survival
Of the 112 trials included in our analysis, 90 (80%) reported PFS as an efficacy outcome. The median PFS for the experimental arm of these trials was 6.2 months (interquartile range [IQR] = 5). For 13 trials, the data were not available, and for nine the median PFS was “not reached” (all personalized). These trials were excluded from the analysis. Experimental arms that included a personalized therapy had a median PFS of 8.3 months (IQR = 5) vs 5.5 months (IQR = 5) for nonpersonalized therapy (P < .001) (Table 4). In addition, treatment-naïve population was also a statistically significant factor associated with longer PFS in the univariate analysis (P = .004), but only the adoption of a personalized strategy for treatment selection in a trial was confirmed as an independent predictor of longer PFS in the multilinear regression analysis (P = .002).
Table 4.
Survival outcomes of patients on randomized and nonrandomized registration trials of anticancer agents from 09/1998 to 06/2013
| Characteristics | Progression-free survival | Overall survival | ||||||||
|---|---|---|---|---|---|---|---|---|---|---|
| Studies, No. | Patients, N | Median, mo (IQR) | P* | Multilinear† | Studies, No. | Patients, N | Median, mo (IQR) | P* | Multilinear† | |
| Total studies | 90 | 18 455 | 6.2 (5) | 60 | 13 865 | 14.2 (9) | ||||
| Personalized | ||||||||||
| Yes | 28 | 4137 | 8.3 (5) | <.001 | 0.002 | 11 | 1842 | 19.3 (17) | .01 | 0.04 |
| No | 62 | 14 318 | 5.5 (5) | Coeff: 3.52 SE:1.08 | 49 | 12 023 | 13.5 (8) | SE: 3.21 Coeff: 6.72 | ||
| Study design | ||||||||||
| Randomized | 54 | 14 936 | 6.7 (6) | .17 | 37 | 11 294 | 14.4 (9) | .16 | 0.56 | |
| Nonrandomized | 36 | 3519 | 5.65 (5) | 23 | 2571 | 13.7 (10) | SE: 2.87 Coeff: 1.69 | |||
| Treatment status | ||||||||||
| Naïve | 27 | 6765 | 7.4 (5) | .004 | 0.07 | 20 | 5460 | 15.3 (13) | .11 | 0.39 |
| Pretreated | 63 | 11 690 | 5.6 (5) | SE: 0.93 Coeff: 1.72 | 40 | 8405 | 14 (8) | SE: 2.30 Coeff: 2.01 | ||
| Approval date‡ | ||||||||||
| 09/1998-09/2007 | 44 | 7558 | 6.4 (5) | .84 | 30 | 6142 | 14.5 (11) | .91 | ||
| 10/2007-06/2013 | 46 | 10 897 | 6 (5) | 30 | 7723 | 13.7 (9) | ||||
| Patients per arm‡ | ||||||||||
| 6–178 | 44 | 4000 | 6.7 (5) | .61 | 25 | 2300 | 14.5 (13) | .96 | ||
| 179–839 | 46 | 14 455 | 6.2 (4) | 35 | 11 565 | 13.8 (8) | ||||
| Agent | ||||||||||
| Cytotoxic | 22 | 5100 | 5.6 (3) | .11 | 18 | 4371 | 13.4 (5) | .14 | 0.20 | |
| Targeted | 68 | 13 355 | 6.7 (5) | 42 | 9494 | 15.7 (12) | SE: 2.53 Coeff: 3.27 | |||
| Route | ||||||||||
| Oral | 38 | 8030 | 6.8 (6) | .11 | 22 | 5276 | 16.5 (11) | .19 | 0.79 | |
| Intravenous | 52 | 10 425 | 5.8 (5) | 38 | 8589 | 13.6 (6) | SE: 2.38 Coeff: 0.62 | |||
| Single agent | ||||||||||
| Yes | 65 | 10 939 | 5.7 (5) | .13 | 40 | 7852 | 14 (9) | .25 | ||
| No | 25 | 7486 | 6.9 (5) | 20 | 6013 | 14.2 (11) | ||||
| Tumor type | ||||||||||
| Solid | 64 | 15 618 | 6.2 (5) | .39 | 46 | 12 117 | 13.5 (10) | .51 | ||
| Hematologic | 26 | 2837 | 6.9 (5) | 14 | 1748 | 15.7 (8) | ||||
* Wilcoxon rank-sum test (univariate analysis). All P values were two-sided. Coeff = coefficients; FDA = US Food and Drug Administration; IQR = interquartile range; SE = standard error.
† For progression-free survival analysis, multilinear regression analysis included only factors considered statistically significant on univariate analysis, while for OS factors with P values of less than .2 were included in the model.
‡ Cutoff used was the median of distribution.
Personalized Therapy and Overall Survival
Of the 112 trials, the median OS of the experimental arm was reported in 60 (54%). Median OS in these trials was 14.2 months (IQR = 9). For 22 trials, the data were not available, and for 30 trials the median OS was not reached (23 of them were personalized). Trials employing a personalized therapy strategy described a statistically significant longer OS (19.3 months, IQR = 17) compared with nonpersonalized therapy (13.5 months, IQR = 8, P = .01) (Table 4). In the multilinear regression model, personalized therapy remained as the only factor selected as an independent predictor of survival (P = .04).
Eighty-one trials (72%) had information about treatment-related deaths. Treatment-related mortality was 1.6 percent (95% CI = 1% to 2.4%) for personalized vs 1.4 percent (95% CI = 1% to 2%) for nonpersonalized trials, which was not statistically different (P = .74).
Discussion
Our comprehensive review of trials leading to FDA approval of oncology drugs included a meta-analysis, in which the adoption of a biomarker-based (personalized) approach was an independent factor associated with a higher RRR (P = .03) and prolongation of PFS (P < .001), and a suggestion towards longer OS, although not statistically significant (P = .07) compared with a nonpersonalized therapy strategy in randomized trials. Our results demonstrated a relative increase in median PFS for the use of personalized vs nonpersonalized agents against their respective control arms in randomized trials and a relative increase in median OS. In addition, a systematic review of all registration trials (both randomized and nonrandomized) confirmed that personalized therapy was statistically significantly and independently associated with higher RR (P < .001) and longer PFS (P = .002) and OS (P = .04), even after adjustments for confounding variables.
Personalized therapy trials also had treatment-related mortality rates similar to nonpersonalized trials. The toxicity-mortality rate described herein is similar to that in a previous report of phase I trials that evaluated anticancer drugs studied by the National Cancer Institute (mortality that was possibly drug related = 0.49%) (22,23). Other studies have also shown that safety and dose in early trials is highly predictive for later trials, possibly accounting in part for the low drug-related death rates in our registration trials (24).
In our study, registration trials for FDA approval of new anticancer agents included 57 randomized and 55 nonrandomized trials (38 104 patients). A meta-analysis of hazard ratios for time-to-event endpoints using the random-effects model is the most acceptable statistical approach to compare the efficacy of two different strategies amongst heterogeneous trials. However, this type of analysis was not possible (for PFS and OS) in most of our nonrandomized trials because the confidence intervals or the variances for the medians were not reported. Therefore, the meta-analysis was applied to the randomized studies for the hazard ratios for PFS/OS and RRR and to all studies for response rates (because the latter data were fully available in both randomized and nonrandomized studies). Importantly, in our group of studies personalized trials were more often nonrandomized (59% vs 43% for nonpersonalized), although not statistically significant (P = .12). Because the decision to not randomize a trial is often based on having observed high response rates in earlier clinical trials, the trend to nonrandomization, and hence exclusion of a higher number of trials in the personalized group, could have attenuated the effects observed in the meta-analysis (25).
In order to include both randomized and nonrandomized studies in PFS/OS analysis, we performed a weighted data analysis of the 112 registration trials. Although using median survival times at a particular point in time (rather than hazard ratios between experimental and control arms) has intrinsic limitations (26), the advantage of this approach was that substantially more trials were included, as we were no longer limited to randomized trials. However, inclusion of the nonrandomized trials may lead to unrecognized bias arising from different populations being compared without the reference of a control group. In addition, the weighted analysis can also introduce a bias, because some authors have shown that personalized trials tend to be smaller (27), perhaps because the hypothesized response rates are higher and some molecular subtypes of cancers are rare. We also observed a smaller number of patients on experimental arms of personalized trials vs nonpersonalized (median = 152 vs 204 patients), though this difference was not statistically significant (P = .29). Finally, there was a statistically significantly higher number of studies not reaching a median PFS/OS within the personalized category (P < .001). Because no median was available, we excluded these studies, though these trials might be expected to have the longest PFS/OS. This approach might have biased the analysis against personalized trials. Despite these factors, our results revealed better outcomes with a personalized strategy. All personalized drugs were classified as targeted agents, and no cytotoxic agents were considered personalized. This finding may reflect the fact that the precise mechanism of action of cytotoxic agents and the biomarkers for them have only recently been explored (28,29).
The hazard ratio for overall survival in the randomized trials was better with personalized treatment, although this did not reach statistical significance in multivariate analysis (P = 0.07). A possible explanation for this finding was a statistically significantly higher crossover to the experimental arm in personalized trials. In addition, the small number of randomized trials (evaluable = 46 in total with 13 being personalized) may have precluded definitive associations with survival. Successful drugs developed with a strong biologic rationale, including a biomarker for treatment selection, often demonstrate higher antitumor activity in early trials (30,31). This is a plausible reason for the majority of personalized trials allowing crossover to the experimental arm, confounding the assessment of OS (32–35). When both randomized and nonrandomized trials were included in the survival multilinear regression analysis, personalized therapy was the only independent factor associated with longer OS. It is conceivable that a personalized approach might show even greater impact earlier in the disease course (36).
Our study is not the first to demonstrate the benefit of a personalized treatment approach. Von Hoff et al. (37) showed that treatment matched to profiled tumors rendered a statistically significantly longer PFS when compared with the patient’s previous PFS on a nonselected treatment. Other studies with a similar design (using patients as their own controls) suggested that a personalized approach was feasible and more effective than using a nonselected treatment (38–40) Indeed, in melanoma, the median PFS on personalized phase I therapy was longer than the PFS for these patients on their prior first-line standard treatment (39). Many of these studies were conducted when few biomarkers for treatment selection were available or validated; thus, it might be expected that salutary effects would increase as more potent “omics” diagnostic technology becomes available.
Previous evidence to support a personalized treatment approach was also shown by intertrial comparisons. Janku et al. analyzed phase II trials in non–small cell lung cancer and demonstrated that treatment arms enriched for patients with molecular targets had a higher median RR (48.8% vs 9.7%, P = .005) and longer median PFS (6 vs 2.8 months, P = .005) and OS (11.3 vs 7.5 months, P = .05) as compared with those of patients not selected with a biomarker-driven rational (41). In multivariate analysis, only studies enriched for patients with molecular targets or including drugs that eventually gained FDA approval were associated with better outcomes. A substantial prolongation of PFS and OS was also previously reported for some FDA-approved agents in a range of different solid tumors when a targeted population was selected by a biomarker (27).
Our study has some limitations. First, we only included successful FDA-approved agents. Certainly, some cancer drugs, biomarkers, and/or personalized or nonpersonalized approaches were tested and failed during drug development (42), possibly affecting the generalizability of our findings. Second, our study did not restrict itself to a tumor type or a single biomarker. There was a wide variation in the nature and number of tests selected for each personalized therapy, and not all biomarkers were associated with a validated approved companion diagnosis. It is possible that the personalized strategy has differential benefits depending on histology or biological context. However, the fact that we analyzed all registration trials in the time period also supports the validity of the observations across cancer types and genomic biomarkers. Another limitation was our inclusion of an analysis of nonrandomized trials in addition to our analysis of randomized trials. Both analyses produced consistent results, but nonrandomized trials may lead to unidentifiable bias arising from different patient populations being compared. Because many personalized trials were nonrandomized, it was nevertheless felt to be important to include this additional analysis of all studies. Finally, all included personalized therapies were targeted agents, so we cannot extend our findings to personalization of hormonal agents, cytotoxic drugs, or immunotherapies.
Our data indicate that personalized therapy, defined as biomarker-based targeted treatment in the context of drugs that reached FDA approval, is associated with increased clinical benefit across tumor types and markers, as demonstrated by substantially higher response rates, longer time to disease progression, and longer survival, as well as improved relative response rates and hazard ratios for PFS in randomized trials, with no compromise in treatment-related mortality.
Funding
Funded in part by the Joan and Irwin Jacobs Fund, My Answer To Cancer philanthropic fund and Foundation Medicine granted to Dr. Razelle Kurzrock.
Supplementary Material
The study funders had no role in the design of the study; the collection, analysis, or interpretation of the data; the writing of the manuscript; nor the decision to submit the manuscript for publication.
Author contributions: DLFJ, MS, and RK designed the study and supervised its conduct and the data analysis. All authors were involved in interpretation of data. MS did the initial statistical analysis, and the approaches and results were verified and complemented by CW and JJL. All authors had the opportunity to review the analysis plan and outcomes, critically reviewed the manuscript drafts, approved the final version, and made the decision to submit for publication.
The authors have no conflicts of interest to declare.
References
- 1. Collins FS, Hamburg MA. First FDA authorization for next-generation sequencer. N Engl J Med. 2013;369 (25):2369–2371. [DOI] [PMC free article] [PubMed] [Google Scholar]
- 2. Sawyers C. Targeted cancer therapy. Nature. 2004;432 (7015):294–297. [DOI] [PubMed] [Google Scholar]
- 3. National Cancer Institute: Targeted cancer therapies. Fact Sheet. http://www.cancer.gov/cancertopics/factsheet/Therapy/targeted Accessed November 25, 2013.
- 4. Kantarjian H, Sawyers C, Hochhaus A, et al. Hematologic and cytogenetic responses to imatinib mesylate in chronic myelogenous leukemia. N Engl J Med. 2002;346 (9):645–652. [DOI] [PubMed] [Google Scholar]
- 5. Slamon DJ, Leyland-Jones B, Shak S, et al. Use of chemotherapy plus a monoclonal antibody against HER2 for metastatic breast cancer that overexpresses HER2. N Engl J Med. 2001;344 (11):783–792. [DOI] [PubMed] [Google Scholar]
- 6. Food and Drug Administration Consumers Update. http://www.fda.gov/forconsumers/consumerupdates/ucm407328.htm - Herceptin.
- 7. Douillard JY, Siena S, Cassidy J, et al. Randomized, phase III trial of panitumumab with infusional fluorouracil, leucovorin, and oxaliplatin (FOLFOX4) versus FOLFOX4 alone as first-line treatment in patients with previously untreated metastatic colorectal cancer: the PRIME study. J Clin Oncol. 2010;28 (31):4697–4705. [DOI] [PubMed] [Google Scholar]
- 8. Callahan MK, Rampal R, Harding JJ, et al. Progression of RAS-mutant leukemia during RAF inhibitor treatment. N Engl J Med. 2012;367 (24):2316–2321. [DOI] [PMC free article] [PubMed] [Google Scholar]
- 9. Jurgensmeier JM, Eder JP, Herbst RS. New strategies in personalized medicine for solid tumors: molecular markers and clinical trial designs. Clin Cancer Res. 2014;20 (17):4425–4435. [DOI] [PMC free article] [PubMed] [Google Scholar]
- 10. Food and Drug Administration (FDA). Drugs @FDA. http://www.accessdata.fda.gov/scripts/cder/drugsatfda/ Accessed July 30, 2014.
- 11. American Society of Clinical Oncology meeting website. http://meetinglibrary.asco.org/abstracts Accessed August 03, 2014.
- 12. Liberati A, Altman DG, Tetzlaff J, et al. The PRISMA statement for reporting systematic reviews and meta-analyses of studies that evaluate health care interventions: explanation and elaboration. Ann Intern Med. 2009;151 (4):W65–W94. [DOI] [PubMed] [Google Scholar]
- 13. Grever MR, Blachly JS, Andritsos LA. Hairy cell leukemia: Update on molecular profiling and therapeutic advances. Blood Rev 2014;28 (5):197–203. [DOI] [PubMed] [Google Scholar]
- 14. Druker BJ. Translation of the Philadelphia chromosome into therapy for CML. Blood. 2008;112 (13):4808–4817. [DOI] [PubMed] [Google Scholar]
- 15. Therasse P, Arbuck SG, Eisenhauer EA, et al. New guidelines to evaluate the response to treatment in solid tumors. European Organization for Research and Treatment of Cancer, National Cancer Institute of the United States, National Cancer Institute of Canada. J Natl Cancer Inst. 2000;92 (3):205–216. [DOI] [PubMed] [Google Scholar]
- 16. Miller AB, Hoogstraten B, Staquet M, et al. Reporting results of cancer treatment. Cancer. 1981;47 (1):207–214. [DOI] [PubMed] [Google Scholar]
- 17. Tierney JF, Stewart LA, Ghersi D, et al. Practical methods for incorporating summary time-to-event data into meta-analysis. Trials. 2007;8:16. [DOI] [PMC free article] [PubMed] [Google Scholar]
- 18. Altman DG, Bland JM. How to obtain the P value from a confidence interval. BMJ. 2011;343:d2304. [DOI] [PubMed] [Google Scholar]
- 19. DerSimonian R, Laird N. Meta-analysis in clinical trials. Control Clin Trials. 1986;7 (3):177–188. [DOI] [PubMed] [Google Scholar]
- 20. Viechtbauer W. Conducting Meta-Analyses in R with the Metafor Package. J Stat Software. 2010;36:1–48. [Google Scholar]
- 21. Higgins JP, Thompson SG. Quantifying heterogeneity in a meta-analysis. Stat Med. 2002;21 (11):1539–1558. [DOI] [PubMed] [Google Scholar]
- 22. Horstmann E, McCabe MS, Grochow L, et al. Risks and benefits of phase 1 oncology trials, 1991 through 2002. N Engl J Med. 2005;352 (9):895–904. [DOI] [PubMed] [Google Scholar]
- 23. Kurzrock R, Benjamin RS. Risks and benefits of phase 1 oncology trials, revisited. N Engl J Med. 2005;352 (9):930–932. [DOI] [PubMed] [Google Scholar]
- 24. Jardim DL, Hess KR, Lorusso P, et al. Predictive value of phase I trials for safety in later trials and final approved dose: analysis of 61 approved cancer drugs. Clin Cancer Res. 2014;20 (2):281–288. [DOI] [PubMed] [Google Scholar]
- 25. Tsimberidou AM, Braiteh F, Stewart DJ, et al. Ultimate fate of oncology drugs approved by the us food and drug administration without a randomized Trial. J Clin Oncol. 2009;27 (36):6243–6250. [DOI] [PubMed] [Google Scholar]
- 26. Michiels S, Piedbois P, Burdett S, et al. Meta-analysis when only the median survival times are known: a comparison with individual patient data results. Int J Technol Assess Health Care. 2005;21 (1):119–125. [DOI] [PubMed] [Google Scholar]
- 27. Amir E, Seruga B, Martinez-Lopez J, et al. Oncogenic targets, magnitude of benefit, and market pricing of antineoplastic drugs. J Clin Oncol. 2011;29 (18):2543–2549. [DOI] [PubMed] [Google Scholar]
- 28. Friboulet L, Olaussen KA, Pignon JP, et al. ERCC1 isoform expression and DNA repair in non-small-cell lung cancer. N Engl J Med. 2013;368 (12):1101–1110. [DOI] [PMC free article] [PubMed] [Google Scholar]
- 29. Fisher SB, Fisher KE, Patel SH, et al. Excision repair cross-complementing gene-1, ribonucleotide reductase subunit M1, ribonucleotide reductase subunit M2, and human equilibrative nucleoside transporter-1 expression and prognostic value in biliary tract malignancy. Cancer. 2013;119 (2):454–462. [DOI] [PubMed] [Google Scholar]
- 30. Kwak EL, Bang YJ, Camidge DR, et al. Anaplastic lymphoma kinase inhibition in non-small-cell lung cancer. N Engl J Med. 2010;363 (18):1693–1703. [DOI] [PMC free article] [PubMed] [Google Scholar]
- 31. Flaherty KT, Puzanov I, Kim KB, et al. Inhibition of mutated, activated BRAF in metastatic melanoma. N Engl J Med. 2010;363 (9):809–819. [DOI] [PMC free article] [PubMed] [Google Scholar]
- 32. Flaherty KT, Hennig M, Lee SJ, et al. Surrogate endpoints for overall survival in metastatic melanoma: a meta-analysis of randomised controlled trials. Lancet Oncol. 2014;15 (3):297–304. [DOI] [PMC free article] [PubMed] [Google Scholar]
- 33. Hauschild A, Grob JJ, Demidov LV, et al. Dabrafenib in BRAF-mutated metastatic melanoma: a multicentre, open-label, phase 3 randomised controlled trial. Lancet. 2012;380 (9839):358–365. [DOI] [PubMed] [Google Scholar]
- 34. Rosell R, Carcereny E, Gervais R, et al. Erlotinib versus standard chemotherapy as first-line treatment for European patients with advanced EGFR mutation-positive non-small-cell lung cancer (EURTAC): a multicentre, open-label, randomised phase 3 trial. Lancet Oncol. 2012;13 (3):239–246. [DOI] [PubMed] [Google Scholar]
- 35. Shaw AT, Kim DW, Nakagawa K, et al. Crizotinib versus chemotherapy in advanced ALK-positive lung cancer. N Engl J Med. 2013;368 (25):2385–2394. [DOI] [PubMed] [Google Scholar]
- 36. Westin JR, Kurzrock R. It’s about time: lessons for solid tumors from chronic myelogenous leukemia therapy. Mol Cancer Ther. 2012;11 (12):2549–2555. [DOI] [PMC free article] [PubMed] [Google Scholar]
- 37. Von Hoff DD, Stephenson JJ, Jr, Rosen P, et al. Pilot study using molecular profiling of patients’ tumors to find potential targets and select treatments for their refractory cancers. J Clin Oncol. 2010;28 (33):4877–4883. [DOI] [PubMed] [Google Scholar]
- 38. Tsimberidou AM, Iskander NG, Hong DS, et al. Personalized medicine in a phase I clinical trials program: the MD Anderson Cancer Center initiative. Clin Cancer Res. 2012;18 (22):6373–6383. [DOI] [PMC free article] [PubMed] [Google Scholar]
- 39. Henary H, Hong DS, Falchook GS, et al. Melanoma patients in a phase I clinic: molecular aberrations, targeted therapy and outcomes. Ann Oncol. 2013;24 (8):2158–2165. [DOI] [PMC free article] [PubMed] [Google Scholar]
- 40. Hollebecque A, Massard C, De Baere T, et al. Molecular screening for cancer treatment optimization (MOSCATO 01): A prospective molecular triage trial--Interim results. ASCO Meeting Abstracts. 2013;31(15 Suppl):2512. [Google Scholar]
- 41. Janku F, Berry DA, Gong J, et al. Outcomes of phase II clinical trials with single-agent therapies in advanced/metastatic non-small cell lung cancer published between 2000 and 2009. Clin Cancer Res. 2012;18 (22):6356–6363. [DOI] [PubMed] [Google Scholar]
- 42. Kopetz S, Desai J, Chan E, et al. PLX4032 in metastatic colorectal cancer patients with mutant BRAF tumors. ASCO Meeting Abstracts. 2010;28(15 Suppl):3534. [Google Scholar]
Associated Data
This section collects any data citations, data availability statements, or supplementary materials included in this article.