

Abstract
Two new ligand sets, pipMeLH2 and NO2LH2 (pipMeL = N,N′-bis(2,6-diisopropylphenyl)-1-methylpiperidine-2,6-dicarboxamide, NO2L = N,N′-bis(2,6-diisopropyl-4-nitrophenyl)pyridine-2,6-dicarboxamide), are reported which are designed to perturb the overall electronics of the copper(III)–hydroxide core and the resulting effects on the thermodynamics and kinetics of its hydrogen-atom abstraction (HAT) reactions. Bond dissociation energies (BDEs) for the O–H bonds of the corresponding Cu(II)–OH2 complexes were measured that reveal that changes in the redox potential for the Cu(III)/Cu(II) couple are only partially offset by opposite changes in the pKa, leading to modest differences in BDE among the three compounds. The effects of these changes were further probed by evaluating the rates of HAT by the corresponding Cu(III)–hydroxide complexes from substrates with C–H bonds of variable strength. These studies revealed an overarching linear trend in the relationship between the log k (where k is the second-order rate constant) and the ΔH of reaction. Additional subtleties in measured rates arise, however, that are associated with variations in hydrogen-atom abstraction barrier heights and tunneling effciencies over the temperature range from −80 to −20 °C, as inferred from measured kinetic isotope effects and corresponding electronic-structure-based transition-state theory calculations.
Graphical Abstract

INTRODUCTION
Identifying the intermediate(s) involved in catalytic oxidations by biological1 and synthetic2 copper-containing systems is important in order to understand selectivity, enhance reactivity, and develop new catalysts. In efforts to obtain fundamental chemical insights into such intermediates, many types of discrete copper–oxygen model complexes have been characterized through spectroscopy and X-ray crystallography.3 Such studies have provided important benchmark information and precedent for the potential involvement of copper–oxygen species in catalysis. Yet, in many cases the compounds do not demonstrate the requisite intermolecular reactivity with substrates or substrate analogs, such as the ability to attack compounds with strong C–H bonds,4 raising questions about the viability of their copper–oxygen functionalities as active oxidants. Theoretical work implicating [CuO]+ units as powerful oxidizing agents capable of abstracting hydrogen atoms from strong C–H bonds provides impetus for efforts to prepare complexes with this moiety.5 While the [CuO]+ core has been proposed as a reactive intermediate in various reactions6 and has been identified in the gas phase,4,5b,c,7 discrete [CuO]+ complexes have yet to be identified conclusively. Their [Cu(OH)]2+ core has been invoked as an intermediate in water oxidation catalysis10 and may be viewed as a protonated form of the elusive [CuO]+ unit. Complexes LCu(OH) (1) exhibited high rates of hydrogen-atom transfer (HAT) from 9,10-dihydroanthracene (DHA) to yield anthracene and aqua complex LCu(H2O) (2; for R = iPr, k = 1–24 M−1 s−1 at −80 to −30 °C).8 In addition, solutions of LCu(OH) (1a, R = iPr) in 1,2-difluorobenzene (DFB) at −25 °C were found to react with a range of substrates with C–H bond dissociation enthalpies (BDEs) ranging between 77 and 99 kcal mol−1, and a linear relationship between log k and the substrate C–H BDE was found.11 These results implicate a similar HAT mechanism across the series and suggest that the [Cu(OH)]2+ core may be considered as a viable intermediate in catalytic oxidations with strong C–H bonds, including those performed by enzymes such as methane monooxygenase12 or lytic polysaccharide monooxygenase.5g,13
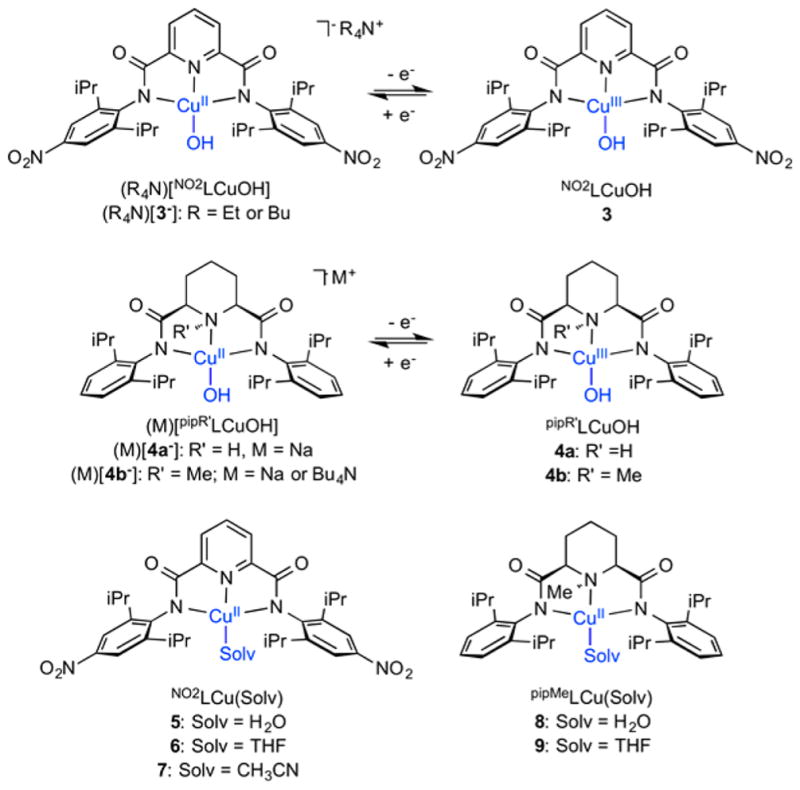
We recently reported the preparation of compounds LCu(OH) (1, Figure 1, top), which on the basis of spectroscopy and theory were formulated as copper(III)–hydroxide complexes.8,9 In efforts to understand the basis for the observed HAT reactivity of LCu(OH) (1a, R = iPr), the bond dissociation energy of the O–H bond of the formed copper(II)–aqua product LCu(H2O) (2a, R = iPr) was evaluated through use of the square scheme shown in Figure 2.11,14 The values of the [Cu(OH)]2+/1+ redox potential (−0.074 vs Fc+/Fc) and the pKa of LCu(H2O) (2a, R = iPr) in THF (18.8 ± 1.8) enabled determination (eq 1 using a known15 value of C = 66 kcal mol−1 for THF as solvent) of the O–H BDE of 90 ± 3 kcal mol−1. This BDE value is high relative to those reported for most transition metal oxo/hydroxo/aqua systems11 and is in line with the fast HAT rates observed (Bell–Evans–Polanyi relation). Notably, the low redox potential and poor oxidizing power of LCu(OH) (1a) are offset by the high basicity of the hydroxide to achieve the large BDE. We attribute these conflicting influences to the powerful electron donation from the dianionic bis-(arylcarboxamido)pyridine supporting ligand, which stabilizes the high oxidation state of copper in LCu(OH) (1a) but sufficiently raises the pKa of the aqua ligand in LCu(OH2) (2a) to result in a strong O–H bond in LCu(OH2) (2a) and a correspondingly fast HAT by LCu(OH) (1a).
Figure 1.

(top) Hydrogen-atom transfer (HAT) by previously reported copper(III)–hydroxide complex, and (bottom) variants of the copper(III)–hydroxide complex studied herein.
Figure 2.

Square scheme with associated thermodynamic parameters.
| (1) |
Consideration of these influences led us to ask what the effects of electronic perturbations of the supporting ligand would be on the O–H BDE and HAT rates. Previous analysis of ligand effects on metal–hydride BDE values16 revealed that in systems that had different supporting ligands (e.g., CO vs phosphine) but were similarly sterically unencumbered, equivalent compensation of redox potential (E°(M−)) and pKa (M–H) to yield almost identical BDEs was observed. On the other hand, steric influences were cited to explain cases where compensation of redox potential and pKa was not seen, due to differential stabilization of complexes with differing coordination numbers. In studies of [(TBP8Cz)MnV(O)] (TBP8Cz = octakis(p-tert-butylphenyl)corrolazinato3−), significant and counterintuitive enhancements of HAT rates were linked to axial coordination of anions, and theoretical calculations indicated that these rate enhancements resulted from increases in the MnIV–OH BDE.17 A key conclusion drawn was that the increased BDE’s resulted from an increase in basicity that outweighed the decrease in redox potential upon anion binding; in other words, axial anion coordination causes the MnV–oxo to be a weaker oxidant but a much stronger base, and the dominance of the basicity effect results in a larger MnIV–OH BDE and a correspondingly faster HAT rate. Similar counterintuitive increases in HAT rates upon binding of anions trans to an oxo group were reported for [(TMC)FeIVO]2+ complexes,18 but rather than invoking thermodynamic rationales based on BDE values, recent theoretical calculations implicated significant tunneling corrections to the reaction barriers that vary with anion electron donation.19 Thus, it was suggested that tunneling increases as anion electron donation is enhanced, explaining the observation of increased HAT rates as the electrophilicity of the oxo unit is mitigated. Another study compared the BDE and HAT rates for [(Me2E2BC)MnIV(X)-(OH)]n+ (X = OH, n = 2; X = H2O, n = 3; Me2E2BC = 4,11-dimethyl-1,4,8,11-tetraazabicyclo[6.6.2]hexadecane) that differ only with respect to the ligand cis to the reactive hydroxide and the overall charge.20 A BDE difference of 4.1 kcal/mol for the complexes was measured, but the rates of HAT from DHA for the complexes were essentially identical.
We conclude from the aforementioned examples that it is not obvious how changing the electron-donating ability of the supporting ligand in LCu(OH) (1a) would influence its HAT kinetics and thermodynamics. More generally, from these examples it is also evident that we lack full understanding of the relationships among the geometric and electronic structures, HAT rates, and underlying kinetic and thermodynamic rationales for the reactivity of metal–oxo/hydroxo complexes with C–H bonds.21 To examine these issues experimentally for the [Cu(OH)]2+ core, we targeted two systems featuring similar steric influences in their aryl flanking groups but divergent electron-donating abilities due to the presence of (a) a piperidine instead of a pyridine donor trans to the hydroxo group or (b) nitro groups in the para position of the aryl substituents (Figure 1, bottom). The greater basicity and sigma donor properties of piperidine relative to pyridine (ΔpKa ≈ 6)22,23 were anticipated to lower the redox potential (stabilize the higher copper oxidation state) but increase the basicity (destabilize the deprotonated form of the product aqua complex). In contrast, the variant with electron-withdrawing nitro groups was anticipated to have a higher redox potential but decreased basicity. The relative extents of these counteracting effects in the two systems, which differ with respect to the location of the electronic perturbations, and the resulting effects on O–H BDE and HAT rates are unresolved issues of fundamental significance19 that we aimed to address.
Herein we report the synthesis of the ligand precursors NO2LH2 and pipR′ LH2 (Scheme 1; R′ = H or Me), the latter being new members of the relatively small family of piperdine-containing ligands described in the literature.24 We used these ligands to prepare copper(II)–hydroxide complexes M[NO2LCu(OH)] ((M)[3−], M = Bu4N+, Et4N+) and M[pipR′LCu(OH)] ((M)[4a−], R′ = H; (M)[4b−], R′ = Me; M = Na+, K+, or Bu4N+). Electrochemical and chemical oxidations of M[NO2LCu(OH)] ((M)[3−]), and M[pipMeLCu(OH)] ((M)[4a−]) led to species identified spectroscopically as NO2LCu(OH) (3) and pipMeLCu(OH) (4b), respectively. Through comparison of the kinetics of the reactions of these complexes with C–H bonds in various substrates and the O–H BDE values determined for their respective [Cu(OH2)]2+ products with data determined previously for LCu(OH) (1a), new insights into ligand effects on the thermodynamics and kinetics of HAT by the [Cu(OH)]2+ unit were obtained.
Scheme 1.

Synthesis of Ligand Precursors
RESULTS
Synthesis and Characterization of Ligands and Cu(II) Complexes
The syntheses of pipHLH2, pipMeLH2, and NO2LH2 are outlined in Scheme 1 (details provided in Supporting Information). Ligand pipHLH2 was obtained on a gram scale via selective hydrogenation of the pyridine ring of LH2. Subsequent N-methylation of the piperidine nitrogen yielded pipMeLH2. The ligand precursor NO2LH2 was prepared via modification of a reported procedure for a related molecule using the known 2,6-diisopropyl-4-nitroaniline.25 1H and 13C NMR spectra supported the indicated formulations (Figures S1–S3).
The complexes (R4N)[NO2LCu(OH)] ((R4N)[3−]; R = Et or Bu) were prepared by adding aqueous R4NOH to NO2LCu-(MeCN) (7), which was in turn prepared from NO2LH2, NaOMe (2 equiv), and Cu(OTf)2 in MeOH followed by MeCN workup (Scheme 2). More direct reaction of pipR′LH2 with 2 equiv of NaOMe in the presence of Cu(OTf)2, followed by the addition of 1 equiv of Bu4NOH, led to generation of the complexes (Na)[pipR′LCu(OH)] ((Na)[4a−] and (Na)[4b−]). While only the former could be isolated pure in bulk, pure [Bu4N][pipMeLCu(OH)] ([Bu4N][4b−]) was prepared by treatment of the corresponding acetonitrile adduct (pipMeLCu-(MeCN), not isolated) with Bu4NOH in Et2O. In procedures similar to that used to prepare NO2LCu(MeCN) (7), the aqua adducts NO2LCu(OH2) (5) and pipMeLCu(OH2) (8) were synthesized by reaction of the appropriate pro-ligand with NaOMe in MeOH in the presence of Cu(OTf)2, followed by workup and crystallization from acetone/H2O. Stirring of the aqua complexes 5 and 8 in THF over 3 Å molecular sieves gave the corresponding THF adducts NO2LCu(THF) (6) and pipMeLCu(THF) (9), respectively. All complexes were characterized by UV–vis and EPR spectroscopy and CHN analysis (except (Na)[4b−], as noted above) in addition to X-ray crystallography for (Et4N)[NO2LCu(OH)] ((Et4N)[3−]), (Na)-[pipR′LCu(OH)] (R′ = H, (Na)[4a−] and R′ = Me, (Na)-[4b−]), and NO2LCu(Solv) (Solv = H2O, 5; Solv = THF, 6; Solv = CH3CN, 7).
Scheme 2.
Complexes Studied in This Work
The X-ray crystal structures of the anionic portions of (Et4N)[NO2LCu(OH)] ((Et4N)[3−]) and (Na)[pipR′LCu(OH)] (R′ = H, (Na)[4a−]; R′ = Me, (Na)[4b−]) as well as the solvent adducts NO2LCu(Solv) (Solv = H2O, 5; Solv = THF, 6; Solv = CH3CN, 7) are shown in Figure 3, with selected bond distances listed in Table 1. The Cu(II) ions in each structure adopt similar square planar geometries, with additional weak axial coordination of a fifth solvent THF or CH3CN ligand in 5 or 7, respectively. A Na+ ion bridges the hydroxide ligands of two [pipR′LCu(OH)]− anions in (Na)[4a−] and (Na)[4b−], with Na–O(3) distances as listed in Table 1. The Cu(II)–OH distances in (Et4N)[NO2LCu(OH)] ((Et4N)[3−]), (Na)-[pipHLCu(OH)] ((Na)[4a−], and (Na)[pipMeLCu(OH)] ((Na)-[4b−]) are short (avg. 1.875 Å, range 1.859–1.885 Å), in agreement with the calculated value for [LCu(OH)]− (1.863 Å)8 ([1a−], the precursor to 1a) and those measured for other monocopper–hydroxide complexes.26 Key differences between the structures with pipR′L2− and NO2L2− is the ~0.07 Å longer Cu–N(piperidine) than Cu–N(pyridine) distances, with the former accompanied by a slight raising of the piperidine N atom out of the N,N-CuOH plane. These differences in bond distances may be attributed to the different hybridizations of the donor N atom (sp3 vs sp2). While the topologies of (Na)[pipR′LCu(OH)] (R′ = H, (Na)[4a−]; R′ = Me, (Na)-[4b−]) are generally similar, the complex with R′ = Me has slightly shorter Cu–N(amido) and longer Cu–N(piperidine) bond distances, consistent with a precedented N-methylation effect.27
Figure 3.

Representations of the X-ray crystal structures of (a) the anionic portion of (Et4N)[NO2LCu(OH)] ((Et4N)[3−]), (b) the Na-bridged anions in (Na)[pipHLCu(OH)] ((Na)[4a−]), and (c) the Na-bridged anions in (Na)[pipMeLCu(OH)] ((Na)[4b−]), (d) NO2LCu(OH2) THF (5), (e) NO2LCu(THF) (6), and (f) NO2LCu(CH3CN)·CH3CN (7). All non-hydrogen atoms are shown as 50% thermal ellipsoids and the hydrogen atoms attached to N(2) and O(3) atoms as spheres.
Table 1.
Selected Interatomic Distances (Angstroms) for Cu(II) Complexesa
| compound | Cu(1)–N(1) | Cu(1)–N(2) | Cu(1)–N(3) | Cu(1)–Oeq/Neq | Cu(1)–Oax/Nax | O(3)–Na(1) |
|---|---|---|---|---|---|---|
| [Na][4a−] | 1.981(1) | 1.994(1) | 1.983(1) | 1.882(1) | 2.241(1) | |
| [Na][4b−]c | 1.963(3) | 2.032(3) | 1.958(3) | 1.885(2) | 2.292(3) | |
| 1.948(3)b | 2.035(3)b | 1.959(3)b | 1.891(2)b | 2.290(2) | ||
| [Et4N][3−] | 1.998(1) | 1.936(2) | 2.005(1) | 1.859(2) | ||
| 5 | 2.021(2) | 1.920(2) | 2.023(2) | 1.956(2) | 2.379(2) | |
| 6c | 1.975(1) | 1.903(1) | 1.992(2) | 1.977(1) | ||
| 2.003(1)b | 1.907(1)b | 1.989(1)b | 1.974(1)b | |||
| 7 | 1.989(3) | 1.920(3) | 2.008(3) | 1.954(3) | 2.45(2) |
Estimated standard deviations are indicated in parentheses.
Distances to Cu(2).
Two independent molecules in the asymmetric unit.
UV–vis and EPR spectra of the Cu(II) complexes in solution are as expected for mononuclear compounds (Figures 4 and S4, S5, S10, and S11). Notably, the EPR spectra display essentially axial signals (with slight rhombic distortions) with rich superhyperfine splitting attributed to the ligand N atoms that are magnetically isolated from nearby H atoms. Parameters derived from spectral simulations (Figures S4 and S5) are summarized in Tables S3 and S4. Of particular relevance to the comparative studies below is the fact that the spectra for (Et4N)[NO2LCu(OH)] ((Et4N)[3−]), (Bu4N)[pipMeLCu(OH)] ((Bu4N)[4b−]), and (Bu4N) [LCu(OH)] ((Bu4N)[1a−]) are quite similar, consistent with closely analogous structures in solution for these copper(II)–hydroxide complexes that differ only with respect to the nature of their supporting dicarboxamide ligands. Nonetheless, we observed differences in the Cu hyperfine splitting constants Az (gz ≈ 2.19), which are 597 [4b−], 567 [1a−], and 540 MHz [3−]. Density functional theory (DFT) calculations of the Cu Az and Mulliken spin densities for complexes (Et4N)[NO2LCu(OH)] ((Et4N)[3−]), (Bu4N)[pipMeLCu(OH)] ((Bu4N)[4b−]), and (Bu4N) [LCu-(OH)] ((Bu4N)[1a−]) also match the experimental trend (Figure S6 and Table S5). These values, which reflect electron spin density at the metal center, parallel the trend in electron-donating abilities of the supporting ligands (larger Az, more electron donating: [4b−] > [1a−] > [3−] and correlate with other molecular properties, as described below.
Figure 4.

X-band EPR spectra of THF frozen solutions of the indicated complexes (30K).
Generation of [CuOH]2+ Complexes
Cyclic voltammetry (CV) experiments were performed for the copper(II)–hydroxides (Bu4N)[LCu(OH)] ((Bu4N)[1a−]), (Et4N)-[NO2LCu(OH)] ((Et4N)[3−]), and (Bu4N)[pipMeLCu(OH)] ((Bu4N)[4b−]) in order to probe the effects of ligand structural variation on the [CuOH]2+/1+ potentials. Quasi-reversible waves (scan rate dependent ΔEpa,pc = 80–200 mV; ipa/ipc ≈ 1) were observed in 1,2-difluorobenzene (DFB) with E1/2 values of −0.076, 0.124, and −0.256 V vs Fc+/Fc, respectively (Figure 5). The differences between the E1/2 values for the nitro-substituted system [3−] and the piperidine system [4b−] relative to the parent complex [1a−] reflect differences in electron donation from the ligands. Thus, the electron-withdrawing nitro groups increase the potential by 200 mV, while the more basic piperidine donor decreases E1/2 by 180 mV.
Figure 5.

Cyclic voltammagrams of compounds 1a− (red), 3− (black), and 4b− (blue). Conditions: 0.2 M Bu4NPF6 in 1,2-difluorobenzene, 20°C, 50 mV s−1.
As described previously for [LCu(OH)]− ([1a−]), cyclic voltammograms for [NO2LCu(OH)]− ([3−]) and [pipMeLCu-(OH)]− ([4b−]) in THF were more complicated (Figures S7–S9). The [Cu(OH)]2+/1+ couples were irreversible (Epa([3−]) = 0.260 V and Epa([4b−]) = −0.160 V vs Fc+/Fc at a scan rate of 500 mV/s), and only for [4b−] at high scan rates (~1 V s−1) did the cathodic return wave gain intensity and enable an E1/2 value to be measured (−0.260 V). An E1/2 of approximately 0.124 V for [3−] in THF was estimated by using the experimental E1/2 obtained in DFB given the observation that the redox potential for the [Cu(OH)]2+/1+ couples is very similar in both solvents. Additional CV features ascribed to the [Cu(OH2)]3+/2+ and [Cu(THF)]3+/2+ couples were also observed. The irreversible waves in the CVs measured in THF suggest chemical reaction of the oxidized species, presumably with THF solvent as reported11 for [1a−] and implicated by kinetic measurements described below.
Guided by the CV data, we attempted to generate the oxidized species NO2LCu(OH) (3) and pipMeLCu(OH) (4b) by chemical oxidation at low temperature, and in light of the reversible cyclic voltammograms observed in DFB, we focused our efforts on solutions of the complexes in this solvent. Treatment of solutions of (Et4N)[NO2LCu(OH)] ((Et4N)[3−]) or (Bu4N)[pipMeLCu(OH)] ((Bu4N)[4b−]) in DFB at −25 °C with either [AcFc][BArF4] or [Fc][BArF4] (AcFc = acetylferrocenium; Fc = ferrocenium; BArF4 = [B[3,5-(CF3)2C6H3]4]−), respectively, resulted in an immediate color change to deep maroon or deep purple, respectively. UV–vis spectra of the product solutions include intense features with λmax (ε) = 513 nm (15 000 M−1 cm−1) or λmax (ε) = 544 nm (11 000 M−1 cm−1), respectively (Figure 6). In both cases, titration experiments revealed a 1:1 reaction stoichiometry (Figures S13 and S14), confirming that oxidation of the copper(II)–hydroxide precursor proceeds via a one-electron process. Also consistent with formation of the desired 1-electron oxidized products, the UV–vis features decayed upon warming and at rates that increased in the presence of added substrates (see below). As evident from Figure 6, the UV–vis feature for pipMeLCu(OH) (4b) is closely analogous to that for LCuOH (1a), while that for NO2LCu(OH) (3) is shifted more significantly to lower wavelength and has a different shape.
Figure 6.

UV–vis spectra after chemical oxidation of 1a− (to form LCu(OH), 1a, black), 3− (to form NO2LCu(OH), 3, red), and 4b− (to form pipMeLCu(OH), 4b, blue) in DFB at −25 °C.
In order to better understand the differences in the UV–vis spectra of the [Cu(OH)]2+ complexes, time-dependent-density functional theory (TD-DFT) calculations were performed using ORCA.28 A methodology similar to that used previously for LCu(OH) (1a)8 was applied to NO2LCu(OH) (3) and pipMeLCu(OH) (4b) (and repeated for 1a to facilitate direct comparison), although geometric optimization with the PBE0 functional was required for pipMeLCu(OH) (4b) in order to obtain reasonable agreement with experiment. As noted previously for LCu(OH) (1a) and confirmed here for all three complexes, the intense absorption feature is primarily a ligand-to-metal charge transfer (LMCT) from the diisopropylphenyl aromatic π-system (HOMO) to the Cu dx2–y2 orbital (LUMO) (Figure 7). Calculated values for the LMCT band are 545 (1a), 516 (3), and 507 nm (4b), which agree with experiment within 18 nm (587 cm−1, 1a), 3 nm (95 cm−1, 3), and 37 nm (1342 cm−1, 4b), respectively (Figure S16, Tables S6–S8). The subtle differences in the energies of the LMCT features between the three compounds may be explained in qualitative fashion by reference to the orbital energies (Table 2). These energy values show that, relative to 1a, the nitro substituents in 3 cause stabilization of both the HOMO and the LUMO, but the greater extent of stabilization of the HOMO results in an increase in the HOMO–LUMO gap and a blue shift of the absorption. Conversely, in 4b, both orbitals are destabilized by the σ-donating piperidine donor, but the effect is accentuated for the LUMO, again increasing the HOMO–LUMO gap and blue shifting the LMCT transition.
Figure 7.

TD-DFT difference plots (yellow lobes = loss of electron density, pink lobes = gain of elecron density) of the LMCT band taken at the highest oscillator strength for (a) LCu(OH) (1a), (b) NO2LCu-(OH) (3), and (c) pipMeLCu(OH) (4b). Gray, white, blue, red, and green atoms represent C, H, N, O, and Cu, respectively.
Table 2.
Calculated Orbital Energies and Partial Atomic Charges for [CuOH]2+ Complexes
| complex | orbital energiesa
|
partial atomic chargesb
|
|||||
|---|---|---|---|---|---|---|---|
| HOMO | LUMO | HOMO–LUMO | Cu | O | Ntrans | Ncis | |
| pipMeLCuOH (4b) | −6.4884 | −3.6265 | 2.8619 | 1.181 | −0.845 | −0.238 | −0.496 |
| LCuOH (1a) | −6.5853 | −3.8835 | 2.7018 | 1.208 | −0.862 | −0.283 | −0.472 |
| NO2LCuOH (3) | −7.4168 | −4.5777 | 2.8391 | 1.219 | −0.857 | −0.282 | −0.477 |
In eV; single-point calculations at the PBE0/TZVP level (see also Figure S15).
Calculated using intrinsic atomic orbital analysis. Ntrans and Ncis refer to N atoms with the indicated positions relative to the hydroxide O atom. Ncis values are averages for each complex.
In a further analysis of the computed [CuOH]2+ structures we examined the atomic partial charges computed using intrinsic atomic orbital (IAO) analysis (Table 2).29 Whereas no clear trends among the three complexes for the charges on the donor O and N atoms are evident, the calculated Cu partial charges are inversely correlated with (a) the electron-donating abilities of the supporting ligands (smaller partial charge, more electron donating: 4b < 1a < 3) and (b) the measured Cu hyperfine splitting constants (see above). The relationships between these parameters and other properties of the complexes will be discussed below.
Determination of the O–H BDEs for 5 and 8
In order to elucidate the effects of ligand structural differences on the BDE of the nascent O–H bond formed as a result of a HAT to the [Cu(OH)]2+ core, we sought to determine the O–H BDEs in NO2LCu(OH2) (5) and pipMeLCu(OH2) (8), the products of HAT to NO2LCu(OH) (3) and pipMeLCu(OH) (4b), respectively, and to compare these values to that determined previously for LCu(OH2) (2a) (90 ± 3 kcal mol−1).11 In one approach, we followed the methodology used in the previous study centered on the square scheme in Figure 2, whereby the BDE is calculated by measurement of the [CuOH2]2+ pKa and the [CuOH]2+/+ redox potential in THF with use of eq 1. This method was successfully used to determine the O–H BDE of pipMeLCu(OH2) (8). As in the case of LCu(OH2) (2a), the pKa for pipMeLCu(OH2) (8) was determined by titrating solutions of (Bu4N)[pipMeLCu(OH)] ((Bu4N)[4b−]) with (Et3NH) (OTf) in THF to yield pipMeLCu(OH2) (8), with the additional complication of the presence of an exchange equilibrium between the aqua ligand of 8 and the THF solvent to yield adduct pipMeLCu(THF) (9) (eqs 2–4, Scheme 3). Separate determinations through titrations monitored by UV–vis spectroscopy of the composite equilibrium constant (K1, eq 2), and the equilibrium constant for the ligand exchange (K3, eq 4) gave respective values of 510 ± 45 and 320 ± 30 (Figures S17–S20). From these values, as well as the known pKa of Et3NH in THF (14.9 ± 1.7),23 the pKa of pipMeLCu(OH2) (8) was found to be 20 ± 2. Using the redox potential for the [pipMeLCu(OH)]/[pipMeLCu(OH)]− (4b/[4b−]) couple in THF (E1/2 = −0.260 V vs Fc+/Fc) and eq 1, the O–H BDE for 8 was estimated to be 88 ± 3 kcal mol−1.
Scheme 3.

Equilibria Involved in Determining pKa of pipMeLCu(OH2) (8) (eqs 2–4) and O–H BDE Values (eq 5)
Unfortunately, we were unable to determine the O–H BDE for NO2LCu(OH2) (5) by the above method because of significant overlap of the UV–vis spectroscopic features for (R4N)[NO2LCu(OH)] ((R4N)[3−]) and the corresponding THF adduct NO2LCu(THF) (6). We thus turned to a second approach, which enabled validation of the O–H BDE determined for pipMeLCu(OH2) (8), calculation of the value for NO2LCu(OH2) (5), and validation of the ordering of the respective BDE’s that are close (within experimental error). According to this approach, the equilibrium constant (K4) is measured for the HAT cross reaction between the [CuOH]2+ complex supported by one ligand with the [CuOH2]2+ complex of another (Scheme 3, eq 5). This equilibrium constant reflects the difference in bond dissociation free energies and, assuming a negligible entropic contribution, BDEs of the two [CuOH2]2+ complexes (ΔBDE). In the experiments, we sought to benchmark the BDEs of NO2LCu(OH2) (5) and pipMeLCu-(OH2) (8) to that of the previously determined LCu(OH2) (2a) (90 ± 3 kcal mol−1),8 so equilibria involving the 1a/2a pair (i.e., L1 = L, the parent ligand) and either the 3/5 pair (L2 = NO2L) or the 4b/8 pair (L2 = pipMeL) were examined.
Thus, for example, addition of a known amount of pipMeLCu-(OH2) (8) (0.25–1.5 equiv) to a solution containing a known concentration of LCuOH (1a) in DFB at −25 °C resulted in discernible shifts in the charge transfer feature in the UV–vis spectrum from 563 nm (λmax for 1a) toward higher energies (Figure S21). The magnitude of these shifts increased with increasing amounts of 8, eventually reaching an absorption maxima at 546 nm corresponding closely to the value of 544 nm determined independently for pipMeLCuOH (4b). Deconvolution of the equilibrium spectra by multicomponent fitting was performed in order to approximate the equilibrium concentrations of LCuOH (1a) and pipMeLCuOH (4b), and from these data the equilibrium constant K4 was found to be 22 ± 2 (Figure S23). The equilibrium also could be reached from the other direction, by titrating a solution of pipMeLCu(OH) (4b) with LCu(OH2) (2a), but multicomponent analysis of the equilibrium spectra was complicated due to the presence of the excess equivalents of LCu(H2O) (2a) needed to reach equilibrium, and only a crude estimate of ~50 for K4 could be obtained (Figures S21, S24, and S25). Using the more reliable value K4 = 22 ± 2 and assuming a negligible entropy change and temperature dependence of ΔHrxn for the cross reaction, we calculate ΔHrxn = ΔBDE = −1.8 ± 0.1 kcal mol−1. Thus, the BDE for pipMeLCu(H2O) (8) is 1.8 kcal mol−1 less than that of LCu(H2O) (2a), in good agreement with the independent determination using E1/2 and pKa (eq 1) of the BDE for 8 of 88 ± 3 kcal mol−1.
We used a similar protocol as described above to evaluate the equilibrium attained upon mixing NO2LCuOH (3) and LCu(OH2) (2a) (Figure S22). Determination of the exact point of equilibrium was complicated by drifting of the UV–vis features after mixing, so only a range of K4 values between 0.42 and 13.6 could be obtained, giving an average value of 6.7 ± 4.6 (Figure S26). Converting these values into enthalpy units puts the O–H BDE of NO2LCu(OH2) (9) ≈ 1 kcal mol−1 higher than that for LCu(OH2) (2a). From these results and using eq 1 (under the assumption that the BDE in DFB is the same as that in THF), we can approximate the corresponding pKa value to be 16.2 ± 2.2, more than two pKa units less than found for compound LCu(OH2) (2a). For ease of comparison and discussion (below), we summarize the thermodynamic parameters along with relevant spectroscopic and theoretical results for the complexes of the three ligands L2−, pipMeL2−, and NO2L2− in Table 3. We explored the potential of density functional theory to provide additional insights through direct computation of reduction potentials and pKa values, but a surprising sensitivity of the former property with respect to choice of functional was observed (see Table S1 and associated Supporting Information text for details), and we did not pursue this further, preferring to focus on modeling HAT directly, as described further below.
Table 3.
Properties of [CuOH]2+ Complexes and Derivatives
| complex | E1/2 (V)a | pKa | BDE (kcal/mol)b | Az (MHz)c | Cu partial charged |
|---|---|---|---|---|---|
| pipMeLCuOH (4b) | −0.260e | 20 ± 2e | 88 ± 3 | 597 | 1.181 |
| LCuOH (1a) | −0.074e | 18.8 ± 1.8e | 90 ± 3 | 567 | 1.208 |
| NO2LCuOH (3) | +0.124f | 16.2 ± 2.2g | 91 ± 3h | 540 | 1.219 |
Volts vs Fc/Fc+.
O–H BDE of corresponding [Cu(OH2)]2+ complex; determined from eq 1 except where noted.
Values for corresponding [CuOH]+ complexes; determined from simulations of EPR spectra.
Calculated by DFT followed by intrinsic atomic orbital (IAO) analysis.
In THF.
In DFB.
Calculated using eq 1.
In DFB, via HAT cross-reaction method (eq 5).
HAT Reaction Kinetics
In order to best draw comparisons between the HAT reactions of the [CuOH]2+ core as a function of supporting ligand, we measured the rates of reactions of LCu(OH) (1a), NO2LCu(OH) (3), and pipMeLCu(OH) (4b) with DHA or DHA-d4 in CH2Cl2 over the temperature range from −20 to −80 °C. In the experiments, solutions of the complexes (Bu4N)[LCu(OH)] ((Bu4N)[1a−]), (Et4N)-[NO2LCu(OH)] ((Et4N)[3−]), or (Bu4N)[pipMeLCu(OH)] ((Bu4N)[4b−]) in the presence of excess substrate were treated with the appropriate oxidant (AcFc)(BArF4) or (Fc)(BArF4), which immediately yielded the intense absorption features associated with LCuOH (1a), NO2LCu(OH) (3), or pipMeLCu-(OH) (4b) in the UV–vis spectrum. The decay at a single wavelength (563, 513, or 544 nm, respectively) was monitored by UV–vis spectroscopy and fit to an exponential function to yield a pseudo-first-order rate constant (kobs). These experiments were repeated using 3–4 different concentrations of substrate (still in excess), and plots of kobs vs [substrate] were fit to linear equations to determine the second-order rate constants (k) (Table S9 and Figures S27–S29). Eyring plots of ln(k/T) vs 1/T are shown in Figure 8, which yielded the experimental (exp) apparent activation parameters listed in Table 4 (“apparent” used here to emphasize the possible influence of quantum mechanical tunneling effects not taken into account in conventional Eyring analysis); analogous Arrhenius analysis (Figure S30) provided Ea and pre-exponential A values (Table S10). In previous work using a slightly different protocol, the kinetics of the reactions of LCuOH (1a) with DHA or DHA-d4 in acetone were measured,8 and the previously reported apparent activation parameters (ΔH‡H = 5.4(2) kcal mol−1, ΔS‡H = −30(2) eu, ΔH‡D = 6.2(3) kcal mol−1, ΔS‡D = −34(3) eu) are similar to those reported here (Table 4).
Figure 8.

Eyring plots of ln(k/T) vs 1/T with linear least-squares fits to the data for reactions of LCu(OH) (1a) (black circles), NO2LCu(OH) (3) (red diamonds), and pipMeLCu(OH) (4b) (blue squares) with DHA or DHA-d4 in CH2Cl2. (a) Overlay of plots for reactions of the complexes with DHA. (b) Plots for the reactions of LCuOH (1a) with DHA (H, solid line) or DHA-d4 (D, dashed line). (c) Plots for the reactions of NO2LCu(OH) (3) and pipMeLCu(OH) (4b) with DHA (H, solid lines) or DHA-d4 (D, dashed lines). Indicated linear fits used to determine activation parameters (Table 4) have R2 > 0.99; standard deviations in the k values are shown in Table S9.
Table 4.
Measured (exp) and Predicted (calcd) Thermodynamic Parameters for the Reactions of the Indicated Complexes with DHA and DHA-d4 in CH2Cl2a
| LCuOH (1a)
|
NO2LCuOH (3)
|
pipMeLCuOH (4b)
|
||||
|---|---|---|---|---|---|---|
| exp | calcdb | exp | calcdb | exp | calcdb | |
| ΔH‡H | 5.1(1) | 5.1 | 4.9(1) | 4.2 | 3.8(2) | 5.5 |
| ΔH‡D | 5.5(3) | 6.4 | 8.5(3) | 5.9 | 6.7(3) | 6.8 |
| ΔH‡D − ΔH‡H | 0.4(2) | 1.3 | 3.6(3) | 1.7 | 2.9(4) | 1.3 |
| ΔS‡H | −31(3) | −31.7 | −27(1) | −25.7 | −38(3) | −32.2 |
| ΔS‡D | −36(4) | −34.3 | −17(1) | −24.6 | −32(4) | −34.8 |
| ΔS‡D − ΔS‡H | −5(5) | −2.6 | 10(1.4) | 1.1 | 6(5) | −2.6 |
| KIE (−80 °C)c | 35 | 82 | 77 | 38 | 93 | 86 |
| KIE (−40 °C) | 29 | 64 | 26 | 25 | 25 | 66 |
| KIE (25 °C)c | 24 | 29 | 2.8 | 11 | 6.5 | 30 |
ΔH‡ values in kcal mol−1; ΔS‡ in eu (cal mol−1 K−1). The temperature range for reactions with DHA and DHA-d4 in CH2Cl2 were −40°C to −80°C and −20 °C to −50 °C, respectively.
See SI for full details on computed rate constants and derived activation parameters.
Extrapolated values, determined from activation parameters.
Several key results from the kinetics studies are noteworthy. Above −75 °C, the rates of HAT from DHA and DHA-d4 follow the order NO2LCu(OH) (3) > LCu(OH) (1a) > pipMeLCu(OH) (4b), which matches the order of O–H BDE values for the corresponding HAT product aqua complexes in accordance with the Bell–Evans–Polanyi relationship. The 3S‡ values are large and negative for all of the complexes, consistent with the bimolecular nature of the HAT reaction and a relatively ordered transition state. However, as discussed further below, they are less negative than would be expected from the loss of molecularity along the reaction coordinate alone, indicating that there is potentially some compensating solvent entropy gain along the same coordinate.
Interestingly, whereas the ΔH‡ values for LCuOH (1a) and NO2LCu(OH) (3) are similar (reflected by the similar slopes in Figure 8a), the ΔH‡ for pipMeLCu(OH) (4b) is ~1 kcal·mol−1 lower. Yet, at temperatures > −75 °C it has smaller k than that for LCuOH (1a) because of its more negative ΔS‡ value. An isokinetic temperature of −75 °C for LCu(OH) (1a) and pipMeLCu(OH) (4b) is evident in Figure 8a, with LCuOH (1a) reacting slower than pipMeLCu(OH) (4b) below this temperature. All complexes exhibit large kinetic isotope effects (KIEs, kH/kD) suggestive of a significant tunneling contribution to the reaction rates.30 However, the temperature dependencies differ significantly, as reflected by Figure 8b and 8c and the plots of ln(KIE) vs 1/T constructed from the activation parameters (Figure 9). Thus, the H and D lines for LCuOH (1a) in Figure 8b are roughly parallel, but for NO2LCu(OH) (3) and pipMeLCu(OH) (4b) in Figure 8c their slopes clearly differ. This point is reinforced in Figure 9, where similar lines for NO2LCu(OH) (3) and pipMeLCu(OH) (4b) contrast with a much smaller temperature dependence for LCuOH (1a). Viewed in another way, parameters Ea,D – Ea,H of 3.6 and 3.0 kcal mol−1 are obtained from Arrhenius plots (Figure S30) for NO2LCu(OH) (3) and pipMeLCu(OH) (4b), which are significantly larger than the zero-point energy difference for a C–H(D) bond (1.2 kcal/mol). These data, in combination with small AH/AD values of 0.01 and 0.05, respectively, are typical indicators of extensive tunneling contributions.30,31 For LCu(OH) (1a), a small Ea,D – Ea,H = 0.3 and a large AH/AD = 13 also fall outside of values associated with classical behavior and are consistent with significant tunneling but sufficiently different from those seen for NO2LCu(OH) (3) and pipMeLCu-(OH) (4b) and thus raise intriguing mechanistic questions. We evaluate the implications of these values and the differences between them in the Discussion section below.
Figure 9.

Plots of ln(KIE) vs 1/T constructed from the activation parameters (Table 4) for LCu(OH) (1a, black dashed line), NO2LCu-(OH) (3, blue solid line), and pipMeLCu(OH) (4b, red dotted line).
Finally, we compared the rates of HAT from a series of substrates with varying C–H BDEs to the previously reported data for LCu(OH) (1a) (Figure 10). Second-order rate constants for reactions with NO2LCu(OH) (3) and pipMeLCu-(OH) (4b) were measured by the same method as described above for the DHA reactions, except the reactions were performed in DFB solvent at −25 °C. In general, the second-order rate constants (Table S11, Figures S31 and S32) follow the order 3 > 1a > 4b for all substrates; however, two exceptions are diphenylmethane and toluene, which follow the order 4b ≈ 3 > 1a and 1a > 3 > 4b, respectively. The plot in Figure 10 of log(k) vs ΔH (equivalent to the ΔBDE) for the three compounds shows a rough linear correlation between the two parameters consistent with similar HAT processes across the series and an underlying relationship between the rate of HAT and the thermodynamics of the reaction.
Figure 10.

Plot of log(k) vs ΔH (equivalent to the ΔBDE between the aqua complexes 1a, 5, and 8 and the C–H bonds of the substrates) for reactions of 1a (black), 4b (red), and 3 (blue) with the substrates DHA (filled circles), cyclohexene (open circles), diphenylmethane (filled squares), THF (open squares), toluene (filled stars), and cyclohexane (open stars) at −25 °C in DFB. The indicated linear fit has a slope of −0.265 (R2 = 0.895).
Theoretical Evaluation of the HAT Transition States
In order to better understand the observed differences in kinetic behavior and evaluate the tunneling contributions implicated by the experimental data, we determined the transition-state (TS) structures for HAT from DHA to each of LCu(OH) (1a), NO2LCu(OH) (3), and pipMeLCu(OH) (4b) at the B3LYP-D3BJ level of density functional theory (see Supporting Information for additional computational details). The TS structure for LCu(OH) (1a) is provided in Figure 11, and selected computational data for all TS structures are provided in Table 5. The C–H–O bond angle in all 3 cases is between 166.7° and 168.5°.
Figure 11.

(a) Optimized HAT TS structure for LCu(OH) (1a). Dotted lines indicate the forming and breaking OH and CH bonds. Atoms are copper (green), nitrogen (blue), oxygen (red), carbon (gray), and hydrogen (white) (b) with calculated interatomic distances indicated (given in Å).
Table 5.
Selected Computational Data for HAT TS Structures
| compd | ΔE‡rel, kcal mol−1a | Δq, aub | Im(ν‡)c |
|---|---|---|---|
| NO2LCu(OH) (3) | 0.0 (0.0) | −0.063 | 1267 (984) |
| LCu(OH) (1a) | 4.6 (2.2) | −0.035 | 1616 (1226) |
| pipMeLCu(OH) (4b) | 4.1 (2.0) | −0.030 | 1614 (1227) |
Zero-point-including activation energy, relative to that for NO2LCu-(OH) (3), when comparing TS structures to separated educts and to van der Waals encounter complexes (latter values in parentheses).
Amount of electronic charge (CM5 charge model32) transferred to the Cu(OH) fragment in the TS structure compared to the reactant.
Imaginary frequency for H (and D) isotopomers (in cm−1).
Immediately apparent in Figure 11b and Table 5 is that the HAT processes for LCu(OH) (1a) and pipMeLCu(OH) (4b) are predicted to be very similar, while that for NO2LCu(OH) (3) is predicted to be quite different. More specifically, for NO2LCu(OH) (3) the transition state is predicted to be earlier (shorter C–H breaking bond, longer O–H making bond) and the zero-point-including activation energy is predicted to be lower (by more than 4 kcal mol−1). The energy of the TS structure above a corresponding intermediate van der Waals complex is also lower for NO2LCu(OH) (3) compared to the other two cases (by roughly 2 kcal mol−1, which affects tunneling propensity), and the width of the barrier through which tunneling takes place is wider (as judged by imaginary frequencies of smaller magnitude that characterize the reaction coordinate for both isotopomers with NO2LCu(OH) (3) compared to LCu(OH) (1a) and pipMeLCu(OH) (4b)). Such behavior, at least for NO2LCu(OH) (3) compared to LCu(OH) (1a), is reasonably consistent with intuition, the various experimental and theoretical indications of the relative electron-donating capabilities of the supporting ligands, and the experimental BDE values: viz. the enhanced electrophilicity of the copper that is associated with nitro substitution leads to semiclassical acceleration of the HAT reaction. The almost perfect equivalency of the predictions for LCu(OH) (1a) and pipMeLCu(OH) (4b) is not necessarily to be expected but is the result at the B3LYP-D3BJ level.
With respect to other activation parameters, a limitation in the theoretical model becomes apparent when one considers the entropy of activation. In particular, the entropy loss associated with the bimolecularity of the reaction, which depends only on the standard-state volume choice (1 L) and the molecular weights of the reacting species (roughly constant across all 3 systems), is trivially computed to be about −40 cal·mol−1·K−1. However, it is clear that in solution the semiclassical entropy of activation (i.e., the quantity that would be measured from an Eyring plot if tunneling were not affecting the activation parameters) must be considerably less than this value. This can be seen by considering the measured ΔS‡ value for the deuterium isotope of DHA by NO2LCu(OH) (3), whose measured rates should be the least affected by tunneling (heavy isotope, lower barrier height, wider barrier width). The measured ΔS‡ value for this case is −17 cal mol−1 K−1. As tunneling would increase the apparent magnitude of ΔS‡ (i.e., make it more negative) were it to play a significant role over the range of the Eyring plot, this suggests that some other factor is present in solution that significantly decreases the entropy loss associated with the reaction’s molecularity. A likely explanation is solvent release, i.e., the “cleft” between the aromatic rings of the free Cu–OH compounds binds one or two solvent molecules whose release to bulk solution upon the binding of DHA compensates for entropy loss along the specific reaction coordinate (see additional discussion in Supporting Information). Determining the condensed-phase activation entropy thus takes on a complexity that is impractical to address with electronic structure theory, so we proceed by making the assumption that all 3 reactions have a similar semiclassical entropy of activation, and we treat that value as a parameter to be adjusted to bring computed data into better agreement with experimental data. We find an optimal value to be −22 cal mol−1 K−1, and we used that value to generate rate constant data using eq SI.2 (see Table S2 and accompanying methods description in Supporting Information), the analysis of which we discuss next.
Eyring plots of our computed bimolecular rate constants, which are themselves a product of the quantum mechanical transmission coefficient associated with tunneling and the canonical transition-state theory rate constant, permit the direct comparison of best-fit apparent enthalpies and entropies of activation as well as kinetic isotope effects for the several temperatures. Quantum mechanical tunneling is predicted to play a very significant role in all overall reaction rates. For reactions with DHA-h4, the transmission coefficients over the range from 193 to 233 K are predicted to vary from 820 to 16 000 for LCu(OH) (1a), 30 to 150 for NO2LCu(OH) (3), and 960 to 20 000 for pipMeLCu(OH) (4b), respectively. For reactions with DHA-d4 over the range 223 to 253 K, the variations are predicted to vary from 41 to 220 for LCu(OH) (1a), 7 to 17 for NO2LCu(OH) (3), and 44 to 245 for pipMeLCu(OH) (4b), respectively.
Eyring analysis parameters determined from computed rate constants are listed alongside those determined from experimental rate constants in Table 4. There is generally good agreement between the measured and the predicted values, although certain fine details are not well reproduced. For example, the variations in ΔH‡ as a function of isotope are well reproduced for LCu(OH) (1a) but underpredicted for NO2LCu(OH) (3) and pipMeLCu(OH) (4b) by 1.5–1.9 kcal mol−1. Similarly, to within experimental error, the entropies of activation as a function of isotope are well reproduced for LCu(OH) (1a) and pipMeLCu(OH) (4b), but the substantially lower ΔS‡ for 3 when reacting with d4-DHA is not predicted by theory. Considering the KIE values at 233 K, theory overestimates these by about a factor of 2 for LCu(OH) (1a) and pipMeLCu(OH) (4b) and is in reasonable agreement for NO2LCu(OH) (3).
DISCUSSION
The targeted comparisons of the thermodynamics and kinetics of HAT by [Cu(OH)]2+ complexes supported by the ligands pipMeL2−, L2−, and NO2L2− were enabled by the synthesis and full characterization of the new Cu(II) precursors [pipMeLCu-(OH)]− ([4b−]), [pipHLCu(OH)]− ([4a−]), and [NO2LCu-(OH)]− ([3−]) through EPR spectroscopy, X-ray crystallography, and density functional theory (DFT). Short Cu–OH distances of 1.86–1.89 Å (X-ray) that are closely replicated by DFT calculations (Table S12) in [Na][4b−], [Na][4a−], and [Et4N][3−] agree with values reported previously for mononuclear copper(II)–hydroxide complexes and confirm the previous attribution of a longer distance of 1.946(2) Å for [LCuOH]− ([1a−]) to compositional disorder involving a copper(II)–chloride complex impurity.8 While the hydroxide ligands in [4a−] and [4b−] are coordinated to Na+ counterions in the X-ray structures, all solution phase studies were carried out with R4N counterions in order to avoid any complications such coordination might cause.
A variety of experimental and theoretical data support the anticipated trend in electron donation pipMeL2− > L2− > NO2L2−. This trend is followed by the spin density at the metal center in the d9 Cu(II) complexes, as reflected by the experimental and calculated hyperfine coupling constants Az ([4b−] > [1a−] > [3−], Tables 3 and S5). Even more telling are the E1/2 values for the CuIII/II couples (Table 3), which span an almost 400 mV range with a slightly less than 200 mV difference between the complexes in the order 3/[3−] (least electron donating) > 1a/[1a−] > 4b/[4b−] (most electron donating). Considering the different nature of the changes in L (para-NO2 substituents on the flanking aryl rings vs piperidine instead of pyridine donor), we deem the approximately equal E1/2 differences to be fortuitous. Finally, the trend in electron-donating capabilities of the ligands is further corroborated by the calculated partial atomic charges on the copper ion in the oxidized complexes (3 > 1a > 4b, Table 3). The correlations between Az, partial charge, and E1/2 that demonstrate the trends in electron donation by the ligands are graphically depicted in Figure 12.
Figure 12.

Plots of Az from fits to the EPR spectra of Cu(II) complexes (black, R2 > 0.99) and DFT-calculated Cu partial charges for the oxidized Cu(III) complexes (blue, R2 = 0.94) versus E1/2 values for the CuIII/II couples for the systems supported by the indicated ligands, with arbitrary linear fits.
Determination of the O–H BDE for the aqua complexes LCu(H2O) (2a), pipMeLCu(H2O) (5), and NO2LCu(H2O) (8) involved (i) for 2a11 and 8 (this work), measurement of the pKa and application of the square scheme and eq 1 and (ii) use of cross HAT reactions between an oxidized complex supported by one ligand with the aqua complex of another. While the absolute values of the BDEs determined via method (i) are insufficiently precise to distinguish them unambiguously, the cross HAT reaction titrations (method (ii)) clearly showed that they are in fact different and are ordered 5 > 2a > 8. Thus, while the pKa values are inversely correlated with the E1/2 values, the compensation of the two is not sufficient to result in identical BDE values; the change in redox potential is more influential than that of the pKa in determining the BDE. This deviation from perfect compensation may be quantified by plotting E1/2 versus pKa (Figure 13). For ideal compensation, a linear fit to such a plot would exhibit a slope of −0.059 mV/pKa unit; we find a slope of −0.094 mV/pKa unit, a deviation from ideality of ~60%. This deviation is in accordance with compensation reported for various organic and inorganic compounds as described in Figure S33 and Table S13 (see citations listed in Supporting Information).
Figure 13.

Plot of the E1/2 for the CuIII/II couple and the pKa for the Cu(II) aqua complex for the systems supported by the indicated ligands. The line is a fit to the data with a slope of −0.094 V/pKa (R2 = 0.98).
The higher O–H BDE and oxidizing power (E1/2) for NO2LCu(OH) (3) relative to LCu(OH) (1a) and pipMeLCu-(OH) (4b) is reflected in faster rates of HAT from DHA and a range of substrates with varying C–H bond dissociation enthalpies (Figure 10). A more detailed evaluation of the temperature dependence of the rates and the H/D kinetic isotope effects (KIEs) for the reactions with DHA and DHA-d4, however, reveals intriguing disparities among the three systems.
For instance, the Eyring plots for the reactions with DHA indicate that the HAT rates follow the BDE order 3 > 1a > 4b at temperatures above −75 °C, but below this isokinetic temperature for LCu(OH) (1a) and pipMeLCu(OH) (4b), the extrapolated second-order rate constant for the latter is larger than that for the former (i.e., inversion of the Evans–Polanyi relationship). All three systems exhibit large H/D KIEs significantly greater than semiclassical values in the temperature ranges of our rate measurements, but the temperature dependency of the KIEs for LCu(OH) (1a) is quite different from those for NO2LCu(OH) (3) and pipMeLCu(OH) (4b).
The theoretical data suggest that these discrepancies may be at least in part associated with the application of Eyring analysis, which presumes a linear relationship between ln(k/T) and 1/T, to data acquired over a temperature range where some curvature associated with tunneling is affecting the fit and moreover may also be affecting different fits differently (because of the different underlying semiclassical barrier heights and barrier widths). Theory does indeed predict very large tunneling contributions to the rate constants (vide supra)— and, more importantly, variations across LCu(OH) (1a), NO2LCu(OH) (3), and pipMeLCu(OH) (4b)—that play a large role in moving the Eyring parameters away from their otherwise semiclassical values. Thus, Eyring plots of computed TST second-order rate constants that are not multiplied by transmission coefficients so as to include tunneling effects lead to ΔH‡ (kcal mol−1)/ΔS‡ (cal mol−1 K−1) values for reactions with DHA-h4 and -d4, respectively, of 11.3/−18.7 and 12.3/−18.8 for LCu(OH) (1a), 7.4/−18.7 and 8.3/−18.8 for NO2LCu(OH) (3), and 11.8/−18.7 and 12.8/−18.8 for pipMeLCu(OH) (4b). We note in particular, then, how tunneling over the treated temperature range decreases the apparent enthalpies of activation by substantial margins, particularly for LCu(OH) (1a) and pipMeLCu(OH) (4b), which have the higher semiclassical activation enthalpies, and similarly increases the magnitude of the apparent entropies of activation (makes them more negative), again more so for LCu(OH) (1a) and pipMeLCu(OH) (4b), where the higher semiclassical barrier leads to more significant tunneling effects on the reaction rate.
Given the intrinsically one-dimensional nature of the Skodje–Truhlar approach used here to compute transmission coefficients as well as its other approximations (e.g., assuming an inverted parabolic barrier shape), it may be that more complete models for tunneling would further improve the agreement of theory with experiment and recover the more significant differences in the extrapolated temperature-dependent isotope effects—keeping in mind though that they are indeed extrapolated values that would not necessarily be expected to agree well with actual measured values at those temperatures, since tunneling effects at such temperatures would be expected to be quite different from those operative over the actual experimental temperature range. Actual measurements at the extrapolated temperatures, however, are not available as rates for one isotope or the other become too fast or too slow for practical determination.
Taken as a whole, it is clear that ligand variation in these [Cu(OH)]2+ compounds leads to a subtle and complex interplay between intrinsic barrier heights and tunneling efficiencies that can render trends in relative rates difficult to interpret easily over temperature ranges where tunneling plays a significant role. Interestingly, analogous competing trends in semiclassical rate constants and transmission coefficients were also recently predicted for nonheme iron oxo compounds.19 Irrespective of the degree to which fine details of low-temperature HAT rates are captured by modeling, however, the degree to which theory involving H atom-transfer transition-state structures does capture key trends in the kinetics of these compounds suggests that concerted H-atom transfer is indeed the proper mechanistic model for these reactions (at least up to the point of the TS structure), as opposed to mechanisms involving separate electron and proton transfers with either one substantially more advanced over the other in the rate-determining step. The very small predicted electronic charge transfers from DHA to the Cu(OH) fragments in the TS structures (less than 0.07 au in all 3 cases, Table 5) similarly supports this characterization, which is consistent with other C–H bond activations described in the literature.33
CONCLUSIONS
In an effort to probe the dependence of hydrogen-atom abstraction thermodynamics and kinetics by [Cu(OH)]2+ cores on supporting ligand structural perturbations, we prepared two variants of an initially studied8 bis(arylcarboxamido)pyridine ligand (L2−) that are either more electron donating (pipR′L2−) or electron withdrawing (NO2L2−). Copper(II)–hydroxide complexes of these new ligands were synthesized and fully characterized, and their 1-electron oxidation to yield [CuOH]2+ complexes was defined by cyclic voltammetry, UV–vis spectroscopy, and DFT calculations. Various experimental (UV–vis, E1/2, Cu hyperfine) and theoretical parameters (Cu partial charge) clearly evinced the anticipated electron-donating or -withdrawing effects on the properties of the [CuOH]+/2+ cores in the series of compounds supported by the three ligand variants. Measurement of the thermodynamic redox potential and pKa parameters for HAT by the [CuOH]2+ complexes revealed only partial compensation of these parameters and, thus, a trend in the corresponding O–H BDE values for the corresponding aqua complexes NO2LCuOH (3) > LCuOH (1a) > pipMeLCuOH (4b). This trend is qualitatively reflected in a similar trend in the rates of HAT from substrates with a range of C–H bond strengths. A thorough analysis of the kinetics of HAT from DHA and DHA-d4 as a function of temperature using experiment and theory, including characterization of HAT transition-state structures and energetics, revealed significant tunneling contributions to the reaction rates and differences in activation parameters across the series of complexes. These differences point to subtle variation of intrinsic barrier heights and tunneling efficiencies for HAT by the [CuOH]2+ functionality when supported by ligands with differing electron-donating capabilities over the studied temperature range from −80 to −20 °C. In summary, through detailed characterization of the thermodynamics and kinetics of HAT by [Cu(OH)]2+ complexes supported by ligands with differing electron-donating characteristics, we obtained new insights into the relative importance of redox potential, pKa, and tunneling on this fundamentally important process relevant to oxidation catalysis.
Supplementary Material
Acknowledgments
We thank the National Institutes of Health (R37GM47365 to W.B.T.) and the National Science Foundation (CHE-1361595 to C.J.C.) for financial support of this research. The authors thank Laura J. Clouston, Benjamin D. Neisen, and Dr. Victor G. Young, Jr. for assistance with X-ray crystallography and/or EPR spectroscopy and Pavel Solntsev for thoughtful discussion. Some X-ray diffraction experiments were performed using a crystal diffractometer acquired through NSF-MRI Award CHE-1229400. This work was carried out in part using computing resources at the University of Minnesota Supercomputing Institute.
Footnotes
Notes
The authors declare no competing financial interest.
- X-ray crystallographic data (CIF)
- Full descriptions of procedures and data from experiment and theory (PDF)
References
- 1.(a) Solomon EI, Heppner DE, Johnston EM, Ginsbach JW, Cirera J, Qayyum M, Kieber-Emmons MT, Kjaergaard CH, Hadt RG, Tian L. Chem Rev. 2014;114:3659–3853. doi: 10.1021/cr400327t. [DOI] [PMC free article] [PubMed] [Google Scholar]; (b) Solomon E, Sarangi R, Woertink J, Augustine A, Yoon J, Ghosh S. Acc Chem Res. 2007;40:581–591. doi: 10.1021/ar600060t. [DOI] [PMC free article] [PubMed] [Google Scholar]; (c) Solomon EI, Sundaram UM, Machonkin TE. Chem Rev. 1996;96:2563–2605. doi: 10.1021/cr950046o. [DOI] [PubMed] [Google Scholar]; (d) Klinman JP. Chem Rev. 1996;96:2541–2561. doi: 10.1021/cr950047g. [DOI] [PubMed] [Google Scholar]
- 2.(a) Wendlandt AE, Suess AM, Stahl SS. Angew Chem, Int Ed. 2011;50:11062–11087. doi: 10.1002/anie.201103945. [DOI] [PubMed] [Google Scholar]; (b) Alayon EMC, Nachtegaal M, Ranocchiari M, van Bokhoven JA. Chimia. 2012;66:668–674. doi: 10.2533/chimia.2012.668. [DOI] [PubMed] [Google Scholar]; (c) Vanelderen P, Hadt RG, Smeets PJ, Solomon EI, Schoonheydt RA, Sels BF. J Catal. 2011;284:157–164. doi: 10.1016/j.jcat.2011.10.009. [DOI] [PMC free article] [PubMed] [Google Scholar]
- 3.(a) Mirica LM, Ottenwaelder X, Stack TDP. Chem Rev. 2004;104:1013–1045. doi: 10.1021/cr020632z. [DOI] [PubMed] [Google Scholar]; (b) Lewis EA, Tolman WB. Chem Rev. 2004;104:1047–1076. doi: 10.1021/cr020633r. [DOI] [PubMed] [Google Scholar]; (c) Itoh S. Curr Opin Chem Biol. 2006;10:115–122. doi: 10.1016/j.cbpa.2006.02.012. [DOI] [PubMed] [Google Scholar]; (d) Cramer CJ, Tolman WB. Acc Chem Res. 2007;40:601–608. doi: 10.1021/ar700008c. [DOI] [PMC free article] [PubMed] [Google Scholar]; (e) Himes RA, Karlin KD. Curr Opin Chem Biol. 2009;13:119–131. doi: 10.1016/j.cbpa.2009.02.025. [DOI] [PMC free article] [PubMed] [Google Scholar]
- 4.Illustrative recent examples: Kim S, Saracini C, Siegler MA, Drichko N, Karlin KD. Inorg Chem. 2012;51:12603–12605. doi: 10.1021/ic302071e.Kunishita A, Ertem MZ, Okubo Y, Tano T, Sugimoto H, Ohkubo K, Fujieda N, Fukuzumi S, Cramer CJ, Itoh S. Inorg Chem. 2012;51:9465–9480. doi: 10.1021/ic301272h.
- 5.(a) Decker A, Solomon EI. Curr Opin Chem Biol. 2005;9:152–163. doi: 10.1016/j.cbpa.2005.02.012. [DOI] [PubMed] [Google Scholar]; (b) Schroder D, Holthausen MC, Schwarz H. J Phys Chem B. 2004;108:14407–14416. [Google Scholar]; (c) Dietl N, Schlangen M, Schwarz H. Angew Chem, Int Ed. 2012;51:5544–5555. doi: 10.1002/anie.201108363. [DOI] [PubMed] [Google Scholar]; (d) Kamachi T, Kihara N, Shiota Y, Yoshizawa K. Inorg Chem. 2005;44:4226–4236. doi: 10.1021/ic048477p. [DOI] [PubMed] [Google Scholar]; (e) Yoshizawa K, Kihara N, Kamachi T, Shiota Y. Inorg Chem. 2006;45:3034–3041. doi: 10.1021/ic0521168. [DOI] [PubMed] [Google Scholar]; (f) Comba P, Knoppe S, Martin B, Rajaraman G, Rolli C, Shapiro B, Stork T. Chem - Eur J. 2008;14:344–357. doi: 10.1002/chem.200700865. [DOI] [PubMed] [Google Scholar]; (g) Kim S, Ståhlberg J, Sandgren M. Proc Natl Acad Sci U S A. 2014;111:149–154. doi: 10.1073/pnas.1316609111. [DOI] [PMC free article] [PubMed] [Google Scholar]
- 6.Selected examples: Reinaud O, Capdevielle P, Maumy M. J Chem Soc, Chem Commun. 1990:566–568.Buijs W, Comba P, Corneli D, Pritzkow H. J Organomet Chem. 2002;641:71–80.Maiti D, Lucas HR, Sarjeant AAN, Karlin KD. J Am Chem Soc. 2007;129:6998–6999. doi: 10.1021/ja071704c.Maiti D, Narducci Sarjeant AA, Karlin KD. Inorg Chem. 2008;47:8736–8747. doi: 10.1021/ic800617m.Gupta A, Tolman WB. Inorg Chem. 2010;49:3531–3539. doi: 10.1021/ic100032n.Hong S, Gupta AK, Tolman WB. Inorg Chem. 2009;48:6323–6325. doi: 10.1021/ic900435p.
- 7.(a) Dietl N, vanderLinde C, Schlangen M, Beyer MK, Schwarz H. Angew Chem, Int Ed. 2011;50:4966–4969. doi: 10.1002/anie.201100606. [DOI] [PubMed] [Google Scholar]; (b) Rijs NJ, Weiske T, Schlangen M, Schwarz H. Chem Phys Lett. 2014;608:408–424. [Google Scholar]
- 8.Donoghue PJ, Tehranchi J, Cramer CJ, Sarangi R, Solomon EI, Tolman WB. J Am Chem Soc. 2011;133:17602–17605. doi: 10.1021/ja207882h. [DOI] [PMC free article] [PubMed] [Google Scholar]
- 9.Tehranchi J, Donoghue PJ, Cramer CJ, Tolman WB. Eur J Inorg Chem. 2013;2013:4077–4084. doi: 10.1002/ejic.201300328. [DOI] [PMC free article] [PubMed] [Google Scholar]
- 10.(a) Coggins MK, Zhang MT, Chen Z, Song N, Meyer TJ. Angew Chem, Int Ed. 2014;53:12226–12230. doi: 10.1002/anie.201407131. [DOI] [PubMed] [Google Scholar]; (b) Du J, Chen Z, Ye S, Wiley BJ, Meyer TJ. Angew Chem, Int Ed. 2015;54:2073–2078. doi: 10.1002/anie.201408854. [DOI] [PubMed] [Google Scholar]
- 11.Dhar D, Tolman WB. J Am Chem Soc. 2015;137:1322–1329. doi: 10.1021/ja512014z. [DOI] [PMC free article] [PubMed] [Google Scholar]
- 12.(a) Sirajuddin S, Rosenzweig AC. Biochemistry. 2015;54:2283–2294. doi: 10.1021/acs.biochem.5b00198. [DOI] [PMC free article] [PubMed] [Google Scholar]; (b) Balasubramanian R, Rosenzweig A. Acc Chem Res. 2007;40:573–580. doi: 10.1021/ar700004s. [DOI] [PubMed] [Google Scholar]
- 13.(a) Hemsworth GR, Henrissat B, Davies GJ, Walton PH. Nat Chem Biol. 2014;10:122–126. doi: 10.1038/nchembio.1417. [DOI] [PMC free article] [PubMed] [Google Scholar]; (b) Hemsworth GR, Davies GJ, Walton PH. Curr Opin Struct Biol. 2013;23:660–668. doi: 10.1016/j.sbi.2013.05.006. [DOI] [PubMed] [Google Scholar]
- 14.(a) Warren JJ, Tronic TA, Mayer JM. Chem Rev. 2010;110:6961–7001. doi: 10.1021/cr100085k. [DOI] [PMC free article] [PubMed] [Google Scholar]; (b) Mayer JM. Acc Chem Res. 2011;44:36–46. doi: 10.1021/ar100093z. [DOI] [PMC free article] [PubMed] [Google Scholar]; (c) Mayer JM. Acc Chem Res. 1998;31:441–450. [Google Scholar]; (d) Mayer JM, Rhile IJ. Biochim Biophys Acta, Bioenerg. 2004;1655:51–58. doi: 10.1016/j.bbabio.2003.07.002. [DOI] [PubMed] [Google Scholar]; (e) Mayer JM. Annu Rev Phys Chem. 2004;55:363–390. doi: 10.1146/annurev.physchem.55.091602.094446. [DOI] [PubMed] [Google Scholar]; (f) Bordwell FG, Cheng JP, Harrelson JA., Jr J Am Chem Soc. 1988;110:1229–1231. [Google Scholar]
- 15.Cappellani EP, Drouin SD, Jia G, Maltby PA, Morris RH, Schweitzer CT. J Am Chem Soc. 1994;116:3375–3388. [Google Scholar]
- 16.Tilset M. In: Electron Transfer in Chemistry. Balzani V, editor. WILEY-VCH Verlag GmbH; Weinheim, Germany: 2001. pp. 677–713. [Google Scholar]
- 17.(a) Prokop KA, de Visser SP, Goldberg DP. Angew Chem, Int Ed. 2010;49:5091–5095. doi: 10.1002/anie.201001172. [DOI] [PubMed] [Google Scholar]; (b) Fukuzumi S, Kotani H, Prokop KA, Goldberg DP. J Am Chem Soc. 2011;133:1859–1869. doi: 10.1021/ja108395g. [DOI] [PubMed] [Google Scholar]
- 18.(a) Sastri CV, Lee J, Oh K, Lee YJ, Lee J, Jackson TA, Ray K, Hirao H, Shin W, Halfen JA, Kim J, Que L, Shaik S, Nam W. Proc Natl Acad Sci U S A. 2007;104:19181–19186. doi: 10.1073/pnas.0709471104. [DOI] [PMC free article] [PubMed] [Google Scholar]; (b) Hirao H, Que L, Nam W, Shaik S. Chem - Eur J. 2008;14:1740–1756. doi: 10.1002/chem.200701739. [DOI] [PubMed] [Google Scholar]
- 19.Mandal D, Ramanan R, Usharani D, Janardanan D, Wang B, Shaik S. J Am Chem Soc. 2015;137:722–733. doi: 10.1021/ja509465w. [DOI] [PubMed] [Google Scholar]
- 20.(a) Wang Y, Sheng J, Shi S, Zhu D, Yin G. J Phys Chem C. 2012;116:13231–13239. [Google Scholar]; (b) Yin G. Acc Chem Res. 2013;46:483–492. doi: 10.1021/ar300208z. [DOI] [PubMed] [Google Scholar]
- 21.Chen Z, Yin G. Chem Soc Rev. 2015;44:1083–1100. doi: 10.1039/c4cs00244j. [DOI] [PubMed] [Google Scholar]
- 22.(a) Hall HK., Jr J Am Chem Soc. 1957;79:5441–5444. [Google Scholar]; (b) Hall HK., Jr J Am Chem Soc. 1957;79:5444–5447. [Google Scholar]; (c) Kaljurand I, Kütt A, Sooväli L, Rodima T, Mäemets V, Leito I, Koppel IA. J Org Chem. 2005;70:1019–1028. doi: 10.1021/jo048252w. [DOI] [PubMed] [Google Scholar]; (d) Uudsemaa M, Kanger T, Lopp M, Tamm T. Chem Phys Lett. 2010;485:83–86. [Google Scholar]
- 23.Garrido G, Koort E, Ràfols C, Bosch E, Rodima T, Leito I, Rosés M. J Org Chem. 2006;71:9062–9067. doi: 10.1021/jo061432g. [DOI] [PubMed] [Google Scholar]
- 24.(a) Barefield EK. Inorg Chem. 1980;19:3186–3189. [Google Scholar]; (b) Alcock NW, Moore P, Omar HAA. J Chem Soc, Dalton Trans. 1986:985–989. [Google Scholar]; (c) Chong H-S, Garmestani K, Bryant H, Jr, Brechbiel MW. J Org Chem. 2001;66:7745–7750. doi: 10.1021/jo0106344. [DOI] [PubMed] [Google Scholar]; (d) Dai Z, Xu X, Canary JW. Chem Commun. 2002:1414–1415. doi: 10.1039/b111259g. [DOI] [PubMed] [Google Scholar]; (e) Dai Z, Xu X, Canary JW. Chirality. 2005;17:S227–S233. doi: 10.1002/chir.20130. [DOI] [PubMed] [Google Scholar]; (f) Zhang J, Canary JW. Org Lett. 2006;8:3907–3910. doi: 10.1021/ol061364k. [DOI] [PubMed] [Google Scholar]; (g) Jacobsen GB, Chirinos-Colina JJ, Gibson VC. WO Patent 2007/015074 A1. 2007. p. 43. [Google Scholar]
- 25.Carver FJ, Hunter CA, Livingstone DJ, McCabe JF, Seward EM. Chem - Eur J. 2002;8:2847–2859. doi: 10.1002/1521-3765(20020703)8:13<2847::aid-chem2847>3.0.co;2-m. [DOI] [PubMed] [Google Scholar]
- 26.For example, see: Lee SC, Holm RH. J Am Chem Soc. 1993;115:11789–11798.Berreau LM, Mahapatra S, Halfen JA, Young VG, Jr, Tolman WB. Inorg Chem. 1996;35:6339–6342.Price JR, Fainerman-Melnikova M, Fenton RR, Gloe K, Lindoy LF, Rambusch T, Skelton BW, Turner P, White AH, Wichmann K. Dalton Trans. 2004:3715–3726. doi: 10.1039/B412437E.Zhang X, Huang D, Chen Y-S, Holm RH. Inorg Chem. 2012;51:11017–11029. doi: 10.1021/ic301506x.
- 27.Selected examples: Namuswe F, Hayashi T, Jiang Y, Kasper GD, Narducci Sarjeant AA, Moënne-Loccoz P, Goldberg DP. J Am Chem Soc. 2010;132:157–167. doi: 10.1021/ja904818z.Berry JF, Bill E, García-Serres R, Neese F, Weyhermuller T, Wieghardt K. Inorg Chem. 2006;45:2027–2037. doi: 10.1021/ic051823y.Xifra R, Ribas X, Llobet A, Poater A, Duran M, Solà M, Stack TDP, Benet-Buchholz J, Donnadieu B, Mahía J, Parella T. Chem - Eur J. 2005;11:5146–5156. doi: 10.1002/chem.200500088.Meyerstein D. Coord Chem Rev. 1999;185–186:141–147.Golub G, Cohen H, Paoletti P, Bencini A, Messori L, Bertini I, Meyerstein D. J Am Chem Soc. 1995;117:8353–8361.Che CM, Wong KY, Poon CK. Inorg Chem. 1986;25:1809–1813.
- 28.Neese F. WIREs Comput Mol Sci. 2012;2:73–78. [Google Scholar]
- 29.(a) Knizia G. J Chem Theory Comput. 2013;9:4834–4843. doi: 10.1021/ct400687b. [DOI] [PubMed] [Google Scholar]; (b) Knizia G, Klein JEMN. Angew Chem, Int Ed. 2015;54:5518–5522. doi: 10.1002/anie.201410637. [DOI] [PubMed] [Google Scholar]
- 30.Kwart H. Acc Chem Res. 1982;15:401–408. [Google Scholar]
- 31.Bell RP. The Tunneling Effect in Chemistry. Chapman & Hall; London and New York: 1980. [Google Scholar]
- 32.Marenich AV, Jerome SV, Cramer CJ, Truhlar DG. J Chem Theory Comput. 2012;8:527–541. doi: 10.1021/ct200866d. [DOI] [PubMed] [Google Scholar]
- 33.(a) Sirjoosingh A, Hammes-Schiffer S. J Phys Chem A. 2011;115:2367–2377. doi: 10.1021/jp111210c. [DOI] [PubMed] [Google Scholar]; (b) Usharani D, Lacy DC, Borovik AS, Shaik S. J Am Chem Soc. 2013;135:17090–17104. doi: 10.1021/ja408073m. [DOI] [PMC free article] [PubMed] [Google Scholar]
Associated Data
This section collects any data citations, data availability statements, or supplementary materials included in this article.