

Abstract
The growth of cancer cells relies more on increased proliferation and autonomy compared to non-malignant cells. The rate of de novo nucleotide biosynthesis correlates with cell proliferation rates. In part, glutamine is needed to sustain high rates of cellular proliferation as a key nitrogen donor in purine and pyrimidine nucleotide biosynthesis. In addition, glutamine serves as an essential substrate for key enzymes involved in the de novo synthesis of purine and pyrimidine nucleotides. Here, we developed a novel liquid chromatography (LC-MS) to quantify glutamine-derived [15N] nitrogen flux into nucleosides and nucleobases (purines and pyrimidines). For this, DNA from 5637 bladder cancer cell line cultured in 15N labelled glutamine and then enzymatically hydrolyzed by sequential digestion. Subsequently, DNA hydrolysates were separated by LC-MS and Selected Reaction Monitoring (SRM) was employed to identify the nucleobases and nucleosides. Thus, high sensitivity and reproducibility of the method make it a valuable tool to identify the nitrogen flux primarily derived from glutamine and can be further adaptable for high throughput analysis of large set of DNA in a clinical setting.
Keywords: Glutamine nitrogen flux, Nucleosides and nucleobases biosynthesis, Bladder cancer cell lines, Tandem mass spectrometry
Introduction
Most of the clinical problems are associated with nucleotide metabolism and are predominantly due to abnormal catabolism of purines, which range from mild to severe and even fatal disorders [1]. Specifically, human cancers depend on accelerated aerobic glycolysis of glucose for their continued growth and survival. Glutamine is the most abundant serum amino acid and an essential metabolic precursor for other amino acids and nucleotides. Therefore, glutamine addiction is exhibited by many cancers even though it is a Nonessential Amino Acid (NEAA) that can be synthesized from glucose [2]. Importantly proliferating cells use glutamine as a critical nitrogen donor for synthesis of nucleosides and nucleobases (purines, pyrimidines) as well as other NEAA’s. Purine synthesis involves three independent enzymatic steps catalyzed by phosphoribosyl pyrophosphate (PRPP), amido transferase phosphor ribosyl formyl glycinamidine (FGAM), synthetase and GMP synthetase. Glutamine serves as a key nitrogen donor for pyrimidine synthesis catalyzed by carbamoyl phosphate synthetase II, and CTP synthetase [2]. In aforementioned biochemical reactions, glutamine donates its amide (γ nitrogen) group and gets converted to glutamic acid. In addition, glutamine appears to be an important source of glutamate released during depolarization [3–10]. Although, the metabolism of this amino acid has been subject of extensive investigation [11,12], relatively little is known about sources and disposition of glutamate nitrogen. Furthermore, glutamine can transfer its amide nitrogen to support biosynthesis of branched chain amino acids like leucine, isoleucine, and valine [1,13]. Therefore, methods to quantify glutamine metabolism, which correlates with nucleotide biosynthesis in vivo would be highly beneficial.
The development of Electrospray Ionization (ESI) enabled Liquid Chromatography/Mass Spectrometry (LC/MS) to be utilized for the quantitative determination and structural characterization of a great number of polar/ionic molecules, such as nucleic acids in biological samples. The metabolism of [15N]-glutamine in cultured cells was studied with Gas Chromatography-Mass Spectrometry (GC-MS) [14]. Recently, LC-MS was utilized for the assessment of regional methylation of genomic DNA from MCF-7 breast cancer cell line [15]. Towards this end, we have approached this problem by utilizing, “N” as an isotopic tracer and liquid chromatography-mass spectrometry as an analytic tool for the measurement of nitrogen flux from glutamine.
Experimental Methods
Isotope labeling and analysis nitrogen flux using targeted mass spectrometry
Glutamine-free RPMI-1640 media (cat no-15-040-cv) was supplemented with 10% dialyzed serum and 4 g/L [15N] glutamine (Cambridge Isotope Labs). For glutamine-flux analysis, 5637 cells were maintained in glutamine-free RPMI-1640 media overnight. Next, media was replaced with media containing [15N] glutamine-containing (5 mM) but not for control cells. After 12, 24, 48 and 72 hours of [15N] glutamine labeling, cells were collected and the DNA extracted.
DNA extraction
Genomic DNA from both control and [15N] glutamine labeled 5637 bladder cancer cell line was isolated using Qiagen DNeasy blood and tissue kit (cat no-69504) exactly following manufacturer’s protocol. 1 × 10⁶ 5637 bladder cancer cells of all treatments are trypsinized using 0.05% trypsin-EDTA (Life technologies cat no # 25300-054). Cells were pelletized at 1000 rpm for 5 min and washed once with Dulbecco’s phosphate buffered saline (DPBS-1X-Corning cat no # 21-031-CV) suspended in 180 μl of lysis buffer (ALT). 200 μl of 100% ethanol was added to cell pellet. Centrifuge at 8000 rpm for 1 min. Transfer to a spin column with a collection tube. Centrifuge at 8000 rpm for 1 min. Discard flow through. Washed the column with 500 μl of AW1 and followed with 500 μl of AW1 buffers respectively. Finally, DNA is eluted using 50 μl of elution buffer (AE). Further quantification and purity of DNA is determined using microplate reader and obtained a 260/280 ratio of 2 (considered to be of good purity) and concentration range of 500–800 ng/μl was obtained. All above used buffers are provided along with DNA extraction kit.
DNA hydrolysis
Briefly, 1 μg of DNA was denatured by heating at 100°C for 3 min and subsequently chilled in ice slush. One-tenth volume of 0.1M ammonium acetate (pH 5.3) and 2 units of nuclease P1 (Roche Molecular Biochemicals, Mannheim, Germany) were added. The mixture was then incubated at 45°C for 2 h. To the solution were subsequently added 1/10 volume of 1M ammonium bicarbonate (Sigma, St. Louis, MO) and 0.002 units of venom phosphodiesterase I (Sigma, St. Louis, MO). The incubation was continued for an additional 2 h at 37°C. Thereafter, the mixture was incubated for 1 h at 37°C with 0.5 units alkaline phosphatase (Sigma, St. Louis, MO).
Reagents and internal standards
High-Performance Liquid Chromatography (HPLC) grade acetonitrile, methanol and water were purchased from Burdick & Jackson (Morristown, NJ). Mass spectrometry grade formic acid and standards were purchased from Sigma- Aldrich (St. Louis, MO). The calibration solution containing multiple calibrants in acetonitrile/trifluroacetic acid/water was purchased from (Agilent Technologies, Santa Clara, CA).
Liquid chromatography and mass spectrometry
The sample was dried at 37°C for 45 min in Speed Vac® system and stored at −80°C. Prior to mass spectrometry analysis, the dried extract was suspended in 50 μL of methanol: water (50:50) containing 0.1% formic acid. Ten microliters were injected and analyzed using a 6495 QQQ triple quadrupole mass spectrometer (Agilent Technologies) coupled to a 1290 series HPLC system via Selected Reaction Monitoring (SRM). Metabolites were measured using positive ionization mode with an ESI voltage of +4000 ev and −3500 ev, respectively. Approximately 9–12 data points were acquired per detected metabolite. Samples were delivered to the MS via reverse phase chromatography using a RRHD SB-CN column (1.8 μm, 3.0 × 100 mm, Agilent Technologies) at 300 μl/min. Gradient spanning 2% B to 98% B over a 15-minute period followed by 98% B to 2% B for a 1-minute period. Then gradient is continued for 4-minute time period to re-equilibrate the column. Buffers A and B were comprised of 0.1% formic acid in water and acetonitrile, respectively. The list of MRM transitions used to quantify the natural and 15N containing metabolites is given in Table 1.
Table 1.
Details of the Single Reactions Monitoring (SRM) scanning technique on a triple quadrupole mass spectrometer in electrospray ionization positive ion mode.
| Compound Name | Precursor Ion | Product Ion | Dwell | Fragmentor | Collision Energy | Cell Accelerator Voltage | Polarity | Retention time (min) |
|---|---|---|---|---|---|---|---|---|
| Adenine | 136.1 | 92 | 50 | 380 | 10 | 5 | Positive | 2.9 |
| Adenine-15N1 | 137.1 | 92 | 50 | 380 | 10 | 5 | Positive | 2.9 |
| Adenine-15N1 | 137.1 | 93 | 50 | 380 | 10 | 5 | Positive | 2.9 |
| Adenine-15N2 | 138.1 | 93 | 50 | 380 | 10 | 5 | Positive | 2.9 |
| Adenine-15N2 | 138.1 | 94 | 50 | 380 | 10 | 5 | Positive | 2.9 |
| Cytosine | 112.1 | 69 | 50 | 380 | 5 | 5 | Positive | 1.6 |
| Cytosine | 112.1 | 69 | 50 | 380 | 5 | 5 | Positive | 1.6 |
| Cytosine-15N1 | 113.1 | 69 | 50 | 380 | 5 | 5 | Positive | 1.6 |
| Cytosine-15N1 | 113.1 | 70 | 50 | 380 | 5 | 5 | Positive | 1.6 |
| Cytosine-15N2 | 114.1 | 70 | 50 | 380 | 5 | 5 | Positive | 1.6 |
| Cytosine-15N2 | 114.1 | 71 | 50 | 380 | 5 | 5 | Positive | 1.6 |
| Guanine | 152 | 135 | 50 | 380 | 10 | 5 | Positive | 3.3 |
| Guanine-15N1 | 153 | 135 | 50 | 380 | 10 | 5 | Positive | 3.3 |
| Guanine-15N1 | 153 | 136 | 50 | 380 | 10 | 5 | Positive | 3.3 |
| Guanine-15N2 | 154 | 136 | 50 | 380 | 10 | 5 | Positive | 3.3 |
| Guanine-15N2 | 154 | 137 | 50 | 380 | 10 | 5 | Positive | 3.3 |
| Guanine-15N3 | 155 | 137 | 50 | 380 | 10 | 5 | Positive | 3.3 |
| Guanine-15N3 | 155 | 137 | 50 | 380 | 10 | 5 | Positive | 3.3 |
| Thymine | 127.1 | 110 | 50 | 380 | 14 | 5 | Positive | 4.2 |
| Thymine-15N1 | 128.1 | 110 | 50 | 380 | 14 | 5 | Positive | 4.2 |
| Thymine-15N1 | 128.1 | 111 | 50 | 380 | 14 | 5 | Positive | 4.2 |
| Uracil | 113 | 70 | 50 | 380 | 13 | 5 | Positive | 2.3 |
| Uracil-15N1 | 114.1 | 70 | 50 | 380 | 13 | 5 | Positive | 2.3 |
| Uracil-15N1 | 114.1 | 71 | 50 | 380 | 13 | 2 | Positive | 2.3 |
| Adenosine | 268.1 | 136.1 | 50 | 380 | 13 | 2 | Positive | 2.4 |
| Adenosine-15N1 | 269.1 | 137.1 | 50 | 380 | 13 | 2 | Positive | 2.4 |
| Adenosine-15N2 | 270.1 | 138.1 | 50 | 380 | 13 | 2 | Positive | 2.4 |
| Guanosine | 284.1 | 152 | 50 | 380 | 9 | 2 | Positive | 3.3 |
| Guanosine-15N1 | 285.1 | 153 | 50 | 380 | 9 | 2 | Positive | 3.3 |
| Guanosine-15N2 | 286.1 | 154 | 50 | 380 | 9 | 2 | Positive | 3.3 |
| Guanosine-15N3 | 287.1 | 155 | 50 | 380 | 9 | 2 | Positive | 3.3 |
| Cytidine | 244 | 112 | 50 | 380 | 2 | 5 | Positive | 1.6 |
| Cytidine-15N1 | 245 | 113 | 50 | 380 | 2 | 5 | Positive | 1.6 |
| Cytidine-15N2 | 246 | 114 | 50 | 380 | 2 | 5 | Positive | 1.6 |
| Thymidine | 243 | 127 | 50 | 380 | 2 | 5 | Positive | 4.2 |
| Thymidine-15N1 | 244 | 128 | 50 | 380 | 2 | 5 | Positive | 4.2 |
| Thymidine-15N2 | 245 | 129 | 50 | 380 | 2 | 5 | Positive | 4.2 |
| Uridine | 245 | 113 | 50 | 380 | 2 | 5 | Positive | 2.3 |
| Uridine-15N1 | 246 | 114 | 50 | 380 | 2 | 5 | Positive | 2.3 |
Agilent Jet Stream ESI source was used for the 6490 QQQ mass spectrometer. The nitrogen drying gas was set with flow rate of 12 l/min at temperature 220°C. The pressure of the nitrogen nebulizing gas was set at 20 psi. The sheath gas temperature was 250°C and the sheath gas flow was 12 l/min. The capillary voltage for positive polarity was set at 3500 Volt. The Nozzle voltage was 1500 Volt. The optimized high pressure RF for ion funnel was set as 150 Volt and the low pressure RF was set as 60 Volt.
Results and Discussion
The metabolic fates of glutamine can roughly be divided into reactions that use glutamine for its γ-nitrogen (nucleotide synthesis and hexosamine synthesis) and those that utilize either the α-nitrogen or the carbon skeleton. Glutamine is required as a nitrogen donor for the de novo synthesis of both nucleosides and nucleobases (purines, pyrimidines) and is therefore essential for the net production of nucleotides during cell proliferation (Scheme 1). The nucleosides (adenosine, guanosine thymidine cytidine and uridine) and the nucleobases (adenine, guanine, thymine, cytosine and uracil) measured in the study are shown in Scheme 1. The positive ion ESI mass spectra displays abundant [M+H]+ ions. The Collision Induced Dissociation (CID) of all the nucleosides shows loss of sugar moiety to form corresponding protonated nucleobases (Adenosine→adenine+H; Gu anosine→guanine+H; Thymidine→thymine+H; Cytidine→cytosine+H and Uridine→uracil+H) (Figure 1A–1E, Scheme 1 and Table 1). We have optimized and taken the unique SRM for all the standard nucleosides (adenosine, guanosine, thymidine, cytidine and uridine) and standard nucleobases (adenine, guanine, thymine, cytosine and uracil) measured in the study. All the nucleobases and nucleosides having unique SRM, but some of the nucleobases and nucleobases having the same RT does not indicate the nucleobases were co-eluting along with nucleosides. Figure 2 shows an example for adenine and adenosine. The respective [15N] labelled spectra for adenosine, guanosine, thymidine, cytidine and uridine are shown in Figure 1F–1J. The CID spectrum of [M+H]+ (m/z 136) of adenine (A) (purine) (Figure 3A) shows product ions corresponding to the [M+H−2NCH=NH]+ ion (m/z 92) and that of [M+H]+ of guanine (G) (purine)) (Figure 3B) shows [M+H−NH3]+ ion (m/z 135). The CID mass spectrum of [M+H]+ of thymine (T) (pyrimidine) (Figure 3C) shows fragment ions corresponding to the [M+H−NH3]+ ion (m/z 110). The CID mass spectrum of [M+H]+ of cytosine (C) (pyrimidine) (Figure 3D) shows fragment ions corresponding to the [M+H−NHCO]+ ion (m/z 69). The CID mass spectrum of [M+H]+ of uracil (U) (pyrimidine) (Figure 3E) shows fragment ions corresponding to the [M+H−NHCO]+ ion (m/z 70). The respective [15N] labelled spectra for A, T, G, C and U are shown in Figure 3F–3J.
Scheme 1.
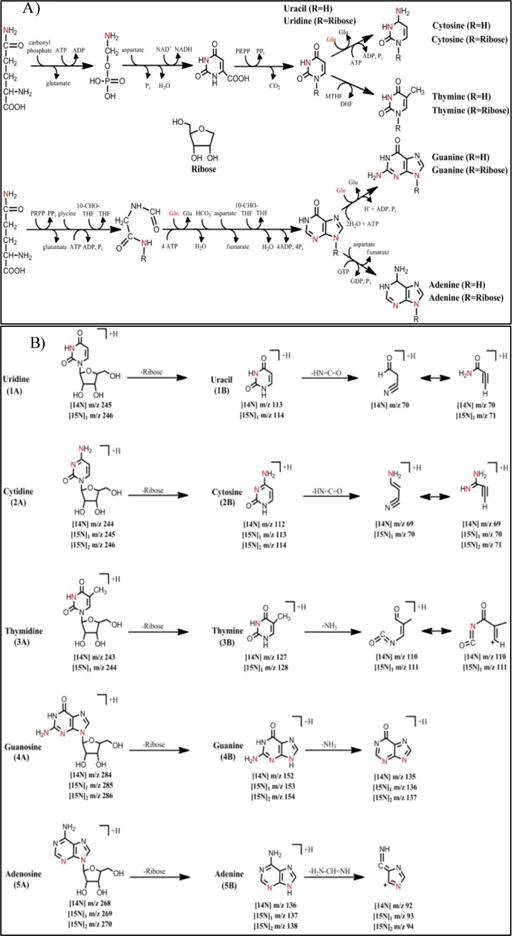
A) Describing the pathways for the Glutamine Nitrogen flux to the purine and pyrimidine biosynthesis B) Structures of the compounds (1–5) were studied and fragmentation pattern.
Figure 1.
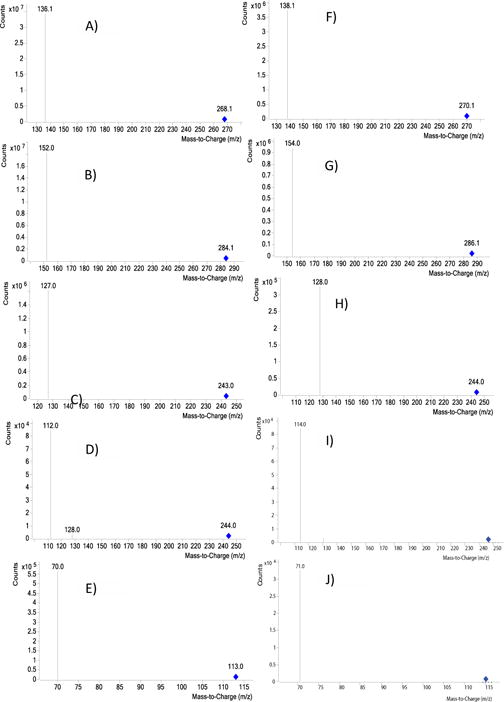
Product-ion spectrum of the [M+H]+ ion of A) Adenosine, B) Guanosine C) Thymidine D) Cytidine and E) Uridine. Product-ion spectrum of the [M+H]+ ion of F) [15N]2 Adenosine, G) [15N]2 Guanosine H) [15N] Thymidine I) [15N]2 Cytidine and J) [15N] Uridine.
Figure 2.
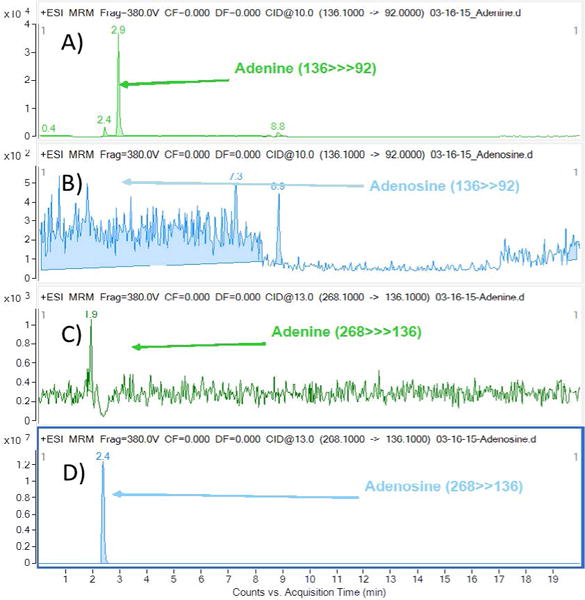
Chromatogram showing the SRM of A) Standard adenine (136>>92) showing the peak at 2.9 min, B) Standard adenosine does not show the adenine (136>>92) peak at 2.9 min indicating there is no co-elution. C) Same as B, standard adenine does not shows the adenosine peak (268>>136) at 2.4 min indicating there is no co-elution with adenosine. D) Same as A, standard Adenosine (268>>136) showing the peak at 2.4 min. Indicating nucleobases are unique SRM and not eluting with nucleosides.
Figure 3.
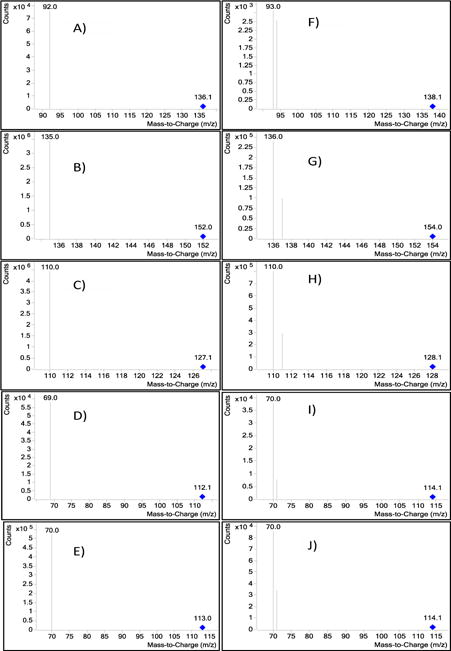
Product-ion spectrum of the [M+H]+ ion of A) Adenine, B) Guanine C) Thymine D) Cytosine and E) Uracil. Product-ion spectrum of the [M+H]+ ion of F) [15N]2 Adenine, G) [15N]2 Guanine H) [15N] Thymine I) [15N]2 Cytosine and J) [15N] Uracil.
As expected, the ESI source, with the mass spectrometer in positive ion mode, gave protonated molecules and also fragment ions. We chose to monitor the fragment ions of the compounds of interest rather than the protonated molecules, because they provided more intense signals and better quantification results. Based on the above fragmentation, we use the SRM approach to quantify the levels of nucleobases and nucleosides. This method was applied to study the incorporation of nitrogen flux in 5637 bladder cancer cells, using [15N]-Glutamine as the primary nitrogen source.
5637 cells treated with [15N] Glutamine for 12 h, 24 h, 48 h, and 72 h resulted in an incorporation of nitrogen in to the genomic DNA and not much incorporation at 0 h time point. Figure 4 demonstrated the incorporation of nitrogen in to nucleosides (adenosine, guanosine thymidine cytidine and uridine). As expected one labeled nitrogen incorporated in to uridine (Figure 4E) and thymidine (Figure 4C), two labelled nitrogen’s in to adenosine (Figure 4A), cytidine (Figure 4D), three labeled nitrogen’s in to guanosine (Figure 4B). The results clearly suggest the glutamine nitrogen feeds in to the nucleosides. In order to probe further we also examined the nucleobases flux using SRM approach. Figure 5 demonstrated the incorporation of nitrogen into nucleobases (A, T, G, C and U). As expected one labeled nitrogen incorporated in to uracil (Figure 5E) and thymine (Figure 5C), two labelled nitrogen’s into cytosine (Figure 5D) and adenine (Figure 5A), three labeled nitrogen’s in to guanine (Figure 5B). Overall, above study provides an opportunity to identify the glutamine nitrogen flux into the nucleosides/nucleobases and shows that incorporation increases with different time points. Taken together, our methodology offers a novel SRM based LC/MS method, which can be applied in wide array of applications. To evaluate the precision of an experiment using the same DNA sample, the analysis was performed on different days with five aliquots from the same bladder cancer cell line DNA sample for 5 days. The day-to-day %CV was <5.7. Our findings suggest that glutamine amido “nitrogen” is transferred to nucleobases and nucleosides. Rapidly dividing cancer cells proliferation cannot occur unless some of this nitrogen is retained for the formation of complex molecules. Additionally, selective depletion of glutamine would also impair nucleotide synthesis. Glutamine deprivation decreased cell proliferation, DNA synthesis, and protein synthesis rates in a cell type-dependent manner in hepatocellular carcinoma and several breast and colon adenocarcinoma cells [16].
Figure 4.
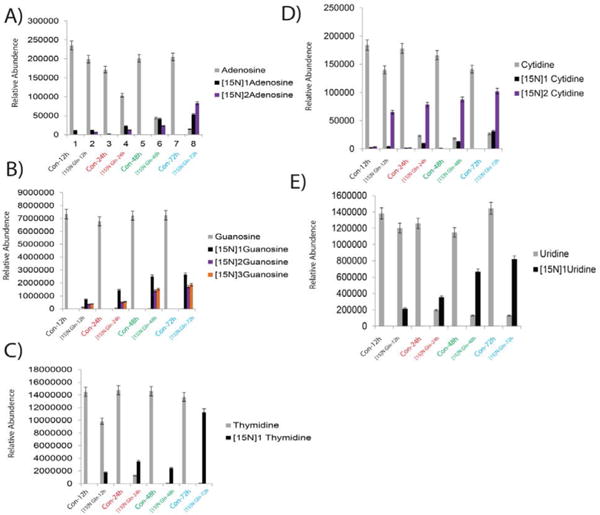
Metabolic Flux in 5637 Bladder Cancer cell line showing the incorporation in to nucleosides at different time points A) Adenosine, B) Guanosine C) Thymidine D) Cytidine and E) Uridine with the [15N] Glutamine treatment at 12 h, 24 h, 48 h and 72 h.
Figure 5.
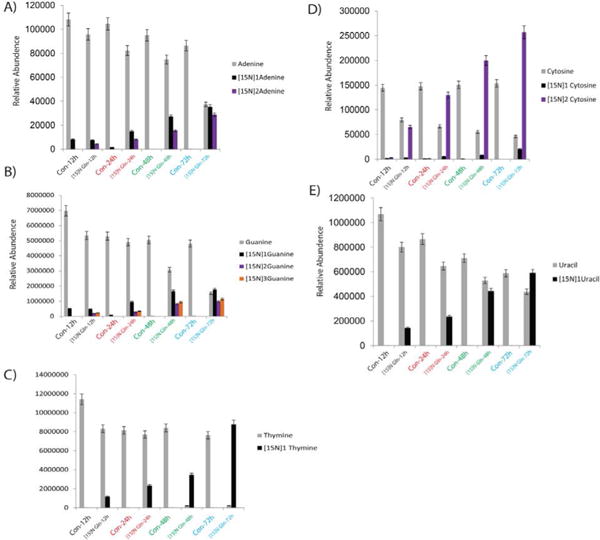
Metabolic Flux in 5637 Bladder Cancer cell line showing the incorporation in to nucleobases at different time points A) Adenine, B) Guanine C) Thymine D) Cytosine and E) Uracil with the [15N] Glutamine treatment at 12 h, 24 h, 48 h and 72 h.
Conclusion
Finally, our study suggests that [15N] glutamine flux using LC-MS/MS-SRM can be used for early detection and clinical discrimination of aggressive tumors from non-aggressive tumors. The sensitivity and reproducibility of the method make it a valuable tool for robust and cost-effective high throughput analysis of large set of DNA in a clinical setting to take it further from bench side to bed side.
Acknowledgments
This research was supported by the following grant, CPRIT Core Facility Support Award RP120092 “Proteomic and Metabolomic Core Facility (NP, ASK), R21-CA185516-01 (ASK), U01CA179674-01A1 (ASK, NP), Pilot grant from Dan L. Duncan Cancer Center (DLDCC), American Cancer Society (ACS) Research Scholar Award 127430-RSG-15-105-01-CNE, DOD W81XWH-12-1-0130 (ASK, GP and GM), and Funds from Alkek Center for Molecular Discovery (ASK). The authors acknowledge the Global Center for Mass Spectrometry Excellence supported by Agilent Technologies at the Alkek Center for Molecular Discovery, Baylor College of Medicine.
References
- 1.Aboud OA, Weiss RH. New opportunities from the cancer metabolome. Clin Chem. 2013;59:138–146. doi: 10.1373/clinchem.2012.184598. [DOI] [PubMed] [Google Scholar]
- 2.Wise DR, Thompson CB. Glutamine addiction: a new therapeutic target in cancer. Trends Biochem Sci. 2010;35:427–433. doi: 10.1016/j.tibs.2010.05.003. [DOI] [PMC free article] [PubMed] [Google Scholar]
- 3.Bradford HF, Ward HK, Thomas AJ. Glutamine–a major substrate for nerve endings. J Neurochem. 1978;30:1453–1459. doi: 10.1111/j.1471-4159.1978.tb10477.x. [DOI] [PubMed] [Google Scholar]
- 4.Reubi JC, Van Der Berg C, Cuénod M. Glutamine as precursor for the GABA and glutamate trasmitter pools. Neurosci Lett. 1978;10:171–174. doi: 10.1016/0304-3940(78)90030-7. [DOI] [PubMed] [Google Scholar]
- 5.Tapia R, Gonzalez RM. Glutamine and glutamate as precursors of the releasable pool of gaba in brain cortex slices. Neurosci Lett. 1978;10:165–169. doi: 10.1016/0304-3940(78)90029-0. [DOI] [PubMed] [Google Scholar]
- 6.Hamberger A, Chiang GH, Sandoval E, Cotman CW. Glutamate as a CNS transmitter. II. Regulation of synthesis in the releasable pool. Brain Res. 1979;168:531–541. doi: 10.1016/0006-8993(79)90307-x. [DOI] [PubMed] [Google Scholar]
- 7.Hamberger AC, Chiang GH, Nylén ES, Scheff SW, Cotman CW. Glutamate as a CNS transmitter. I. Evaluation of glucose and glutamine as precursors for the synthesis of preferentially released glutamate. Brain Res. 1979;168:513–530. doi: 10.1016/0006-8993(79)90306-8. [DOI] [PubMed] [Google Scholar]
- 8.Ward HK, Thanki CM, Bradford HF. Glutamine and glucose as precursors of transmitter amino acids: ex vivo studies. J Neurochem. 1983;40:855–860. doi: 10.1111/j.1471-4159.1983.tb08058.x. [DOI] [PubMed] [Google Scholar]
- 9.Thanki CM, Sugden D, Thomas AJ, Bradford HF. In vivo release from cerebral cortex of [14C]glutamate synthesized from [U-14C]glutamine. J Neurochem. 1983;41:611–617. doi: 10.1111/j.1471-4159.1983.tb04785.x. [DOI] [PubMed] [Google Scholar]
- 10.Szerb JC, O’Regan PA. Effect of glutamine on glutamate release from hippocampal slices induced by high K+ or by electrical stimulation: interaction with different Ca2+ concentrations. J Neurochem. 1985;44:1724–1731. doi: 10.1111/j.1471-4159.1985.tb07160.x. [DOI] [PubMed] [Google Scholar]
- 11.Fonnum F. Glutamate: a neurotransmitter in mammalian brain. J Neurochem. 1984;42:1–11. doi: 10.1111/j.1471-4159.1984.tb09689.x. [DOI] [PubMed] [Google Scholar]
- 12.Schousboe A, Hertz L, Svenneby G, Kvamme E. Phosphate activated glutaminase activity and glutamine uptake in primary cultures of astrocytes. J Neurochem. 1979;32:943–950. doi: 10.1111/j.1471-4159.1979.tb04579.x. [DOI] [PubMed] [Google Scholar]
- 13.Hiller K, Metallo CM, Kelleher JK, Stephanopoulos G. Nontargeted elucidation of metabolic pathways using stable-isotope tracers and mass spectrometry. Anal Chem. 2010;82:6621–6628. doi: 10.1021/ac1011574. [DOI] [PubMed] [Google Scholar]
- 14.Nissim I, States B, Yudkoff M, Segal S. Characterization of amino acid metabolism by cultured rat kidney cells: study with 15N. Am J Physiol. 1987;253:F1243–1252. doi: 10.1152/ajprenal.1987.253.6.F1243. [DOI] [PubMed] [Google Scholar]
- 15.Liu Z, Wu J, Xie Z, Liu S, Fan-Havard P, et al. Quantification of regional DNA methylation by liquid chromatography/tandem mass spectrometry. Anal Biochem. 2009;391:106–113. doi: 10.1016/j.ab.2009.05.012. [DOI] [PMC free article] [PubMed] [Google Scholar]
- 16.Koochekpour S, Majumdar S, Azabdaftari G, Attwood K, Scioneaux R, et al. Serum glutamate levels correlate with Gleason score and glutamate blockade decreases proliferation, migration, and invasion and induces apoptosis in prostate cancer cells. Clin Cancer Res. 2012;18:5888–5901. doi: 10.1158/1078-0432.CCR-12-1308. [DOI] [PMC free article] [PubMed] [Google Scholar]