

Abstract
Whole genome analysis approaches are revealing recurrent cancer-associated somatic alterations in non-coding DNA regions. We combined somatic copy number analysis of 12 tumor types with tissue-specific epigenetic profiling to identify significant regions of focal amplification harboring super-enhancers. Copy-number gains of non-coding regions harboring super-enhancers near KLF5, USP12, PARD6B and MYC are associated with over-expression of these cancer-related genes. We show that two distinct focal amplifications of super-enhancers 3′ to MYC in lung adenocarcinoma (MYC-LASE) and endometrial carcinoma (MYC-ECSE), are physically associated with the MYC promoter and correlate with MYC over-expression. CRISPR/Cas9-mediated repression or deletion of a constituent enhancer within the MYC-LASE region led to significant reductions in the expression of MYC and its target genes, and to the impairment of anchorage-independent and clonogenic growth, consistent with an oncogenic function. Our results demonstrate that genomic amplification of super-enhancers represents a common mechanism to activate cancer driver genes in multiple cancer types.
Somatic copy number alterations (SCNAs), including chromosome arm-level copy changes as well as focal amplifications and deletions, are central events in cancer pathogenesis1–3. Analysis of focal SCNAs has led to the identification of many critical cancer driver genes4–8. However, for focal amplifications and deletions that occur outside of coding regions, the identity of specific targets has remained unclear. Non-coding regions harbor cis-regulatory elements, termed enhancers, that are bound by transcription factors and establish lineage-specific expression programs that define cellular identity9–13. Enhancers are characterized by the histone modifications H3K4me1 and H3K27ac, binding of coactivators such as p300, and increased chromatin accessibility as defined by DNaseI hypersensitivity14–19. Methods such as chromatin immunoprecipitation sequencing (ChIP-seq) and DNaseI hypersensitivity sequencing (DNaseI-seq) have revealed the presence of large clusters of enhancers, termed super-enhancers due to the high level of transcription factor binding associated with these regions19–25. Previously, super-enhancers have been implicated in oncogene activation in cancer through focused analyses of individual tumor types22,26–30. In this study, we systematically investigate SCNAs of non-coding regions at a pan-cancer scale and provide evidence suggesting that focal amplifications of super-enhancers are a common mechanism for upregulating the expression of cancer driver genes.
Statistical methods such as GISTIC (Genomic Identification of Significant Targets in Cancer)2,31 have been developed to identify genomic regions that are recurrently amplified or deleted across cancer types. We examined GISTIC analysis of The Cancer Genome Atlas (TCGA) copy number results for 10,534 samples across 29 tumor types, and identified non-coding focal amplification peaks in 19 of these tumor types after filtering out amplicons containing genes in the Reference Sequence (Refseq) database (Fig. 1a and Supplementary Table 1). For 12 out of the 19 tumor types, H3K27ac ChIP-seq data from corresponding tissue or cell lines were available from either public datasets such as ENCODE and the Roadmap Epigenomics project20–22,32 or from our own collection (Supplementary Table 2). From the 55 focally amplified non-coding regions identified by our analysis, we found six tissue-specific focal amplification peaks harboring super-enhancers as defined by previous criteria22,25,33 (Fig. 1b).
Fig. 1. Pan-cancer analysis identifying focally amplified super-enhancers.

(a) Schematic flow chart of pan-cancer GISTIC analysis of 10,534 tumors from 29 tumor types identifying non-coding focal amplifications of super-enhancers. (b) List of non-coding focal amplification regions harboring super-enhancers. UCEC: uterine corpus endometrial carcinoma, HNSC: head and neck squamous cell carcinoma, LUAD: lung adenocarcinoma, CRC: colorectal carcinoma, LIHC: liver hepatocellular carcinoma, CESC: cervical squamous cell carcinoma, ESCA: esophageal carcinoma. (c) The focal amplification on chr13q identified in HNSC. ChIP-seq profile of H3K27ac and super-enhancer regions from the HNSC cell line BICR-31. Log2 transformed expression level (RPKM) of KLF5 in HNSC tumors with focal amplification of KLF5-HNSE alone (n = 14) and tumors without the amplification (n = 288). Box plot: Middle bar, median; lower and upper box limits, 25th and 75th percentiles, respectively; whiskers, min and max. The P-value is derived from a t-test; (**) p≤0.01; (***) p≤0.001. (d) The focal amplification region on chr13q identified in CRC. ChIP-seq profile of H3K27ac and super-enhancer regions from colon crypt32. Log2 transformed expression level (RPKM) of USP12 in CRC tumors with focal amplification of USP12-CCSE alone (n = 6) and tumors without the amplification (n = 127). (e) The focal amplification on chr20q identified in LIHC. ChIP-seq profile of H3K27ac and super-enhancer regions from the LIHC cell line HepG2. Log2 transformed expression level (RPKM) of PARD6B in LIHC tumors with focal amplification of PARD6B-LCSE alone (n = 7) and tumors without the amplification (n = 245).
The six focally amplified super-enhancers reside in four distinct genomic loci. The focal amplification on chr13q identified in head and neck squamous cell carcinoma (HNSC) (~110 kb, chr13:73880690-73990596) and esophageal carcinoma (ESCA) (~162 kb, chr13:73880413-74042621), is located between the Kruppel-like transcription factors, KLF5 and KLF12 (Fig. 1c). ChIP-seq profiling of H3K27ac in the HNSC cell line BICR-31 revealed that the focal amplification harbors a cluster of three super-enhancers, which we termed KLF5-HNSE (KLF5 Head and Neck squamous cell carcinoma Super-Enhancers). The expression of KLF5, but not KLF12, is significantly higher in HNSC tumors with KLF5-HNSE amplification, suggesting that KLF5 is the target gene (Fig. 1c, Supplementary Fig. 1). In total, ~3% (n = 15) of HNSC cases have amplification of KLF5-HNSE in the absence of KLF5 gene amplification (Fig. 1c). Similarly, the ESCA amplicon also harbors a super-enhancer based on the H3K27ac ChIP-seq profile of esophageal cells and ESCA tumors with this amplicon exhibited a trend towards increased KLF5 expression (Supplementary Fig. 2). In lung adenocarcinomas and lung squamous cell carcinomas, KLF5 is also significantly mutated with recurrent missense alterations (Campbell et. al., in preparation). These results suggest that KLF5 is a putative oncogene which can be upregulated in tumors by super-enhancer amplification.
Additional focal amplification peaks on chr13q in colorectal carcinoma (CRC) (~21 kb, chr13:27523026-27544353) and chr20q in liver hepatocellular carcinoma (LIHC) (~22kb chr20:48997377-49019434) were identified. ChIP-seq profiling of H3K27ac in colon crypt cells32 and in the hepatocellular carcinoma cell line HepG220 revealed that these amplicons contain super-enhancers (Fig. 1d,e). CRC tumors containing the chr13q amplicon exhibited significantly higher expression of the nearest gene, ubiquitin specific peptidase 12, USP12, a deubiquitinating enzyme implicated in prostate cancer34 (Fig. 1d and Supplementary Fig. 1). In LIHC tumors with the chr20q amplicon, the expression of the second nearest gene PARD6B, rather than the closest gene PTPN1, is upregulated, suggesting that PARD6B is the target gene (Fig. 1e and Supplementary Fig. 1). PARD6B is part of an intracellular signaling complex involved in cellular polarity; its over-expression may lead to dysregulation of cell orientation and cellular transformation35.
Frequent non-coding amplifications were identified near the MYC gene, with two distinct focal amplification peaks situated ~450 and ~800 kb 3′ to the MYC oncogene in lung adenocarcinoma (LUAD) and uterine corpus endometrial carcinoma (UCEC), respectively (Fig. 2a). These peaks are distinct from focally amplified super-enhancer regions ~1.5 Mb and ~1.7 Mb 3′ to MYC previously identified in T-cell acute lymphoblastic leukemia (T-ALL) and acute myeloid leukemia (AML), respectively26,30. The lung adenocarcinoma peak (chr8:129166547-129190290) encompasses a 23 kb non-coding region that is part of a super-enhancer as defined by the H3K27ac ChIP-seq profile from A549 lung adenocarcinoma cells, which we refer to as MYC-LASE (MYC Lung Adenocarcinoma Super-Enhancer). In total, ~17% of lung adenocarcinoma cases (n = 86) have a focal amplification of MYC-LASE that is co-amplified with MYC, while ~2% (n = 11) of cases have a focal amplification of MYC-LASE without concurrent amplification of MYC (Fig. 2a). Four out of 52 (~8%) lung adenocarcinoma cell lines profiled for copy-number alterations by the Cancer Cell Line Encyclopedia (CCLE) project36 also have focal amplification of MYC-LASE in the absence of MYC amplification (Supplementary Fig. 3). Rearrangement analysis of whole genome sequencing data from 70 lung adenocarcinoma tumor/normal pairs6,37 revealed two tumors with somatic focal amplification of MYC-LASE occurring as a tandem duplication event (Fig. 2b). We performed H3K27ac ChIP-seq in two additional lung adenocarcinoma cell lines, NCI-H2009 and NCI-H358, the lung squamous cell carcinoma (LUSC) line HCC95 and the small cell lung carcinoma (SCLC) cell line NCI-H2171 and validated that MYC-LASE is part of a lung adenocarcinoma-specific super-enhancer (Fig. 2c and Supplementary Fig. 3).
Fig. 2. Lineage-specific focal amplification of super-enhancers adjacent to the MYC gene.
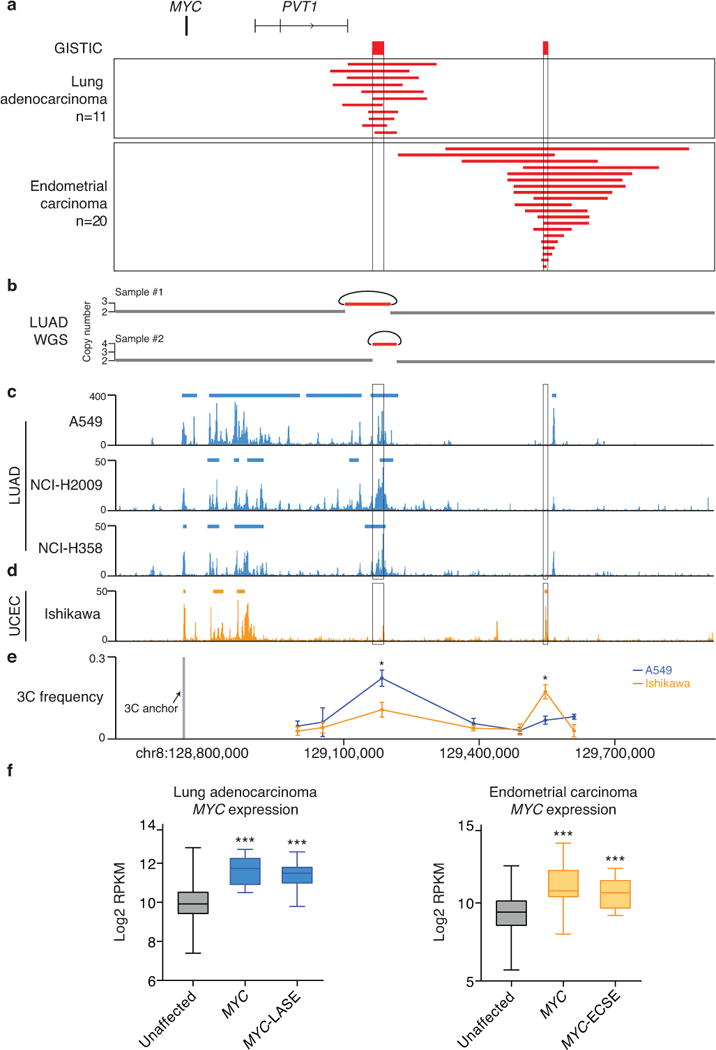
(a) Focal amplification peaks adjacent to MYC identified by GISTIC in lung adenocarcinoma (n = 11/515) and UCEC (n = 20/539). (b) Whole genome sequencing rearrangement analysis of two lung adenocarcinomas reveals tandem duplications, indicated by the curves. H3K27ac ChIP-seq profile and super-enhancer regions of the LUAD cell lines A549, NCI-H2009 and NCI-H358 (c) and the UCEC cell line Ishikawa (d) in the MYC region. (e) 3C interaction frequency ± SEM measured by chromosome conformation capture assays (n = 3) in A549 and Ishikawa cells. The 3C ‘anchor’ primer targets the MYC promoter region, while the 3C ‘bait’ primers target the non-coding regions 3′ to MYC. The P-value is derived from a t-test; (**) p≤0.01; (***) p≤0.001. (f) Left: Log2 transformed expression level (RPKM) of MYC in LUAD tumors with focal amplification of either MYC alone (n = 7) or MYC-LASE alone (n = 11) and tumors without these amplifications (n = 235). Right: UCEC tumors with focal amplification of either MYC alone (n = 10) or MYC-ECSE (n = 14) and tumors without these amplifications (n = 250). Box plot: Middle bar, median; lower and upper box limits, 25th and 75th percentiles, respectively; whiskers, min and max. The P-value is derived from a t-test; (***) p≤0.001.
The endometrial carcinoma peak (chr8:129543949-129554294) encompasses a 10 kb non-coding region that harbors a super-enhancer as defined by the H3K27ac ChIP-seq profile of the endometrial carcinoma cell line Ishikawa (Fig. 2d), and which we refer to as MYC-ECSE (MYC Endometrial carcinoma Super-Enhancer). Approximately 10% of cases (n = 54) have focal amplification of both MYC-ECSE and MYC, while ~4% (n = 20) of cases have focal amplification of only MYC-ECSE (Fig. 2a). The H3K27ac and p300 ChIP-seq profiles of MYC-LASE and MYC-ECSE indicate that each super-enhancer is active only in cell lines from each respective tumor type (Fig. 2c–d and Supplementary Fig. 4).
Distal enhancers regulate target gene expression through chromatin loops that connect enhancers with target gene promoters38–40. We performed chromosome conformation capture (3C) assays in A549 and Ishikawa cells and found that MYC-LASE physically interacts with the MYC promoter only in A549 cells, and reciprocally, that MYC-ECSE physically interacts with the MYC promoter only in Ishikawa cells (Fig. 2e). In addition, tumors with amplification of MYC alone or MYC-LASE/ECSE alone have higher MYC expression than tumors lacking either amplification (Fig. 2f). These results suggest that both MYC-LASE and MYC-ECSE drive MYC expression through lineage-specific chromatin loops.
To determine if copy number gain of super-enhancers drives oncogene expression and tumorigenesis, we focused on MYC-LASE. The binding profile for p300, a marker for enhancer activity14, revealed five constituent enhancers (e1–e5) within MYC-LASE in A549 and NCI-H2009 cells, which overlap with H3K27ac enrichment and DNase I hypersensitivity (Fig. 3a). Among the five constituent enhancers, the e3 enhancer is associated with the highest p300 binding as well as the greatest DNase I hypersensitivity (Fig. 3a). In luciferase reporter assays in A549, NCI-H358 and NCI-H2009 cells, the e3 enhancer was also found to have the strongest activity (Fig. 3b). In contrast, MYC-LASE has no detectable enhancer activity in HEK293 cells, confirming that this super-enhancer is specific to lung adenocarcinoma (Supplementary Fig 5). Duplication of the e3 enhancer in the luciferase reporter construct resulted in >2-fold higher luciferase expression relative to a single copy of e3, demonstrating that an increase in copy number of the enhancer region may upregulate target gene expression (Fig. 3c).
Fig. 3. The activity of the MYC-LASE is predominantly driven by the e3 constituent enhancer.
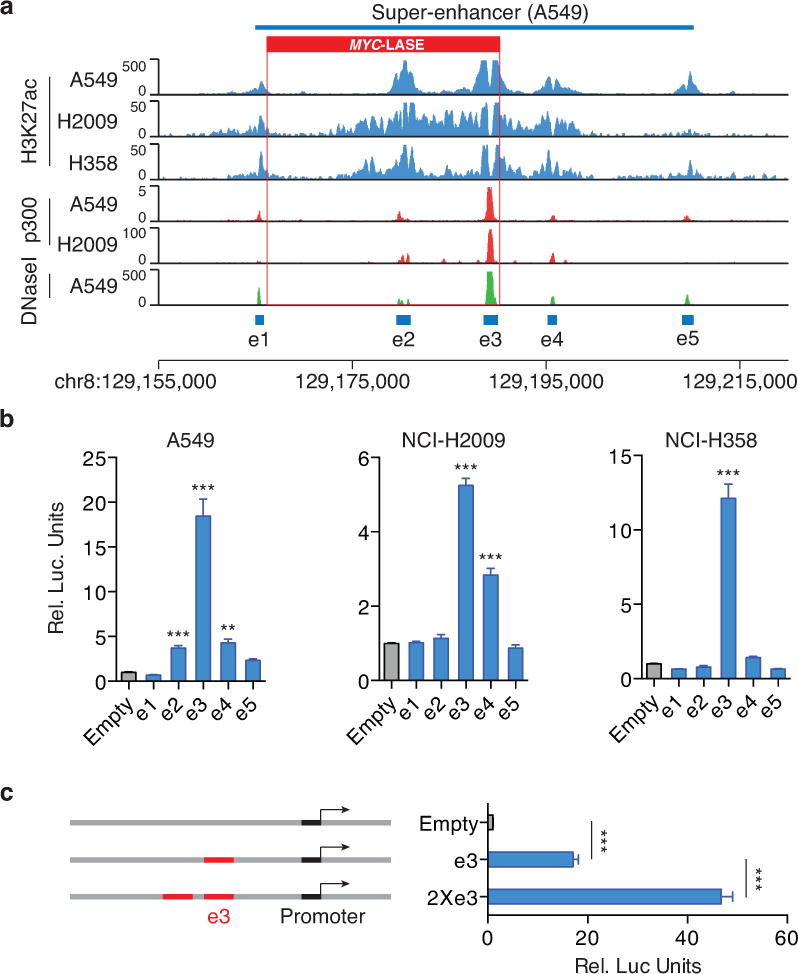
(a) H3K27ac, p300 binding and DNase I hypersensitivity profiles in A549, NCI-H2009 and NCI-H358 cells reveal the constituent enhancers e1-e5 within the super-enhancer region. (b) Luciferase reporter assay (n = 3) measuring enhancer activity of e1-e5 in A549, NCI-H358 and NCI-H2009 lung adenocarcinoma cells. The pGL3 plasmid without the enhancer region (Empty) is used as a negative control. (Y-axis) Relative Luciferase units are normalized to Renilla signal ± SEM. The P-value is derived from a t-test; (**) p≤ p0.01; (***) p≤0.001. (c) Enhancer activity of a duplicated e3 enhancer (2×e3) ± SEM as measured by luciferase reporter assay (n = 3). The P-value is derived from a t-test; (***) p≤0.001.
We next aimed to identify the transcription factors that are required for lung adenocarcinoma-specific activity of the e3 enhancer. We tested ~350 bp fragments of the ~1.5kb e3 region in luciferase reporter assays and discovered that a minimal ~148bp region (mini-e3) was responsible for the preponderance of e3 enhancer activity (Fig. 4a). Transcription factor motif analysis using the ENCODE motif dataset41 identified GATA3, FOXA1, NFE2L2 and CEBPB as candidate factors capable of binding to mini-e3 (Fig. 4b). Deletion of specific transcription factor binding motif sequences within mini-e3 demonstrated that the NFE2L2 and CEBPB motifs were necessary to maintain maximal e3 enhancer activity (Fig. 4c). Short interfering RNA (siRNA)-mediated knockdown of NFE2L2 and CEBPB in A549 cells led to a significant reduction in e3-driven luciferase reporter activity as compared to control siRNAs (Fig. 4d and Supplementary Fig. 6). The binding of NFE2L2 and CEBPB to the super-enhancer was subsequently confirmed by ChIP-seq, with greatest enrichment at the e3 constituent enhancer (Fig. 4e).
Fig. 4. Identification of transcription factors required for the activity of the e3 enhancer.

(a) Enhancer activity ± SEM of small fragments (a-f) of the e3 enhancer as assessed by luciferase reporter assays (n = 3) in A549 LUAD cells. The fragments c and d show comparable enhancer activity relative to the intact e3 enhancer, while other fragments show minimal enhancer activity. The P-value is derived from a t-test; (***) p≤0.001. (b) Transcription factor DNA recognition motifs are identified in the mini-e3 enhancer region that is defined by the c and d fragments overlap. (c) The luciferase reporter expression level ± SEM after deletion of individual transcription factor motif sequence in the e3 regions. The P-value is derived from a t-test (n = 3); (**) p≤0.01; (***) p≤0.001. (d) Luciferase reporter expression level ± SEM after silencing NFE2L2 or CEBPB by siRNA (n = 3). The P-value is derived from a t-test; (*) p≤0.05; (**) p≤0.01. (e) ChIP-seq profile of NFE2L2 and CEBPB in the e1–e5 enhancer regions in A549 cells.
To investigate the functional role of the amplified e3 enhancer region, we first targeted catalytically inactive Cas9 (dCas9) fused to the Kruppel-associated box (KRAB) transcriptional repressor domain42,43 to inhibit e3 enhancer activity in NCI-H2009 lung adenocarcinoma cells that contain four copies of MYC-LASE. Targeting KRAB-dCas9 to the e3 enhancer using two independent single guide RNAs (sgRNAs) resulted in a marked decrease in H3K27ac, compared to cells expressing a control non-targeting sgRNA or KRAB-dCas9 only (Fig. 5a). A significant reduction (~50%) of MYC gene expression was also observed after KRAB-dCas9 mediated repression, confirming MYC as a target gene of the e3 enhancer (Fig. 5b and Supplementary Fig. 7). Furthermore, comparison of RNA sequencing (RNA-seq) data with gene expression signatures44–47 for MYC using Gene Set Enrichment Analysis (GSEA)48 revealed that e3 enhancer repression is associated with a significant decrease in the expression of MYC target genes (Fig. 5c). Finally, repression of the e3 enhancer led to a significant decrease in both anchorage-independent and clonogenic growth (Fig. 5d and 5e; Supplementary Fig. 8), demonstrating that activity of the e3 enhancer is critical for the tumorigenicity of lung adenocarcinoma cells.
Fig. 5. KRAB-dCas9 mediated repression of the e3 enhancer reveals MYC as a direct target.
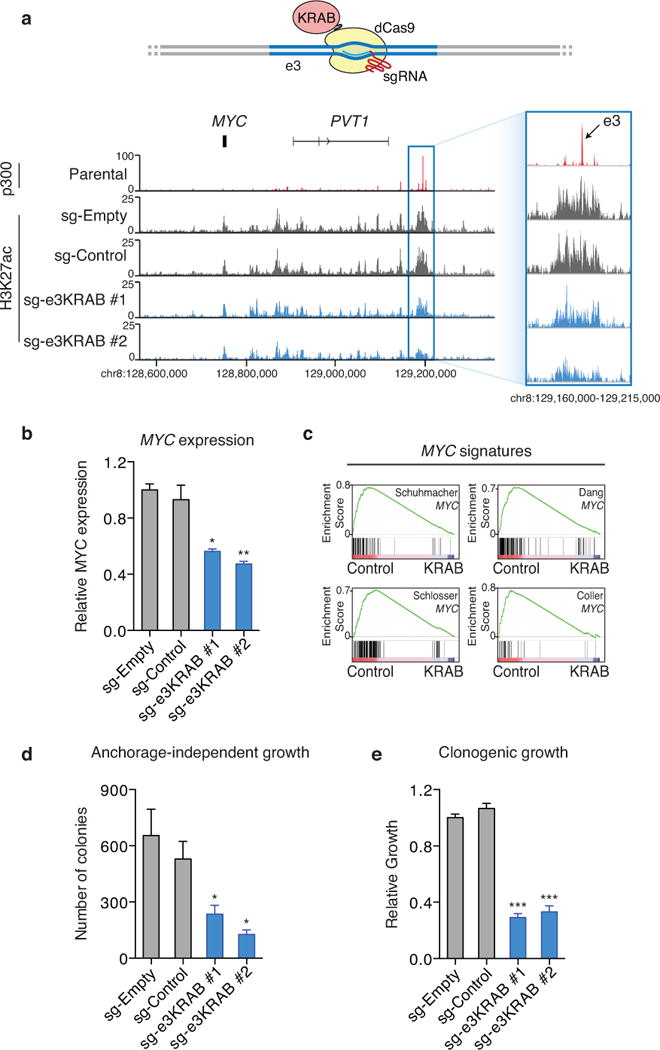
(a) Upper: the design of KRAB-dCas9 mediated repression of the e3 enhancer. Bottom: ChIP-seq of H3K27ac in NCI-H2009 cells with and without KRAB-dCas9 enhancer repression. p300 ChIP-seq profile in parental NCI-H2009 cells indicates the e3 enhancer region. sg-Empty: no sgRNA; sg-Control: sgRNA that is predicted to not recognize any genomic regions; sg-e3KRAB #1 and sg-e3KRAB #2: two separate sgRNAs recognizing the e3 enhancer region. (b) The expression level of MYC ± SEM as measured by quantitative PCR in NCI-H2009 cells with and without KRAB-dCas9 mediated repression of the e3 enhancer (n = 2). (c) GSEA analysis of RNA-seq data generated in NIC-H2009 cells with and without KRAB-dCas9 mediated e3 enhancer repression reveals that genes regulated by e3 repression are enriched in MYC target genes identified by previous studies44–47. The cellular transformation efficiency ± SEM as measured by anchorage-independent growth (n = 3) (d) and the cellular proliferation rate ± SEM as measured by clonogenic assays (n = 3) (e) in NCI-H2009 cells with and without KRAB-dCas9 mediated repression of the e3 enhancer. The P-value is derived from a t-test; (*) p≤0.05; (**) p≤0.01; (***) p≤0.001.
We also used the CRISPR/Cas9 system to specifically delete the e3 enhancer in NCI-H2009 cells. Two independent pairs of sgRNAs were used to target Cas9 to the boundaries of the e3 enhancer. Deletion of e3 was detected by PCR in cells transduced with either pair of e3-targeting sgRNAs, but not in cells transduced with a pair of non-targeting sgRNAs (Fig. 6a–c). Deletion of the e3 enhancer region resulted in a ~30% reduction in MYC expression (Fig. 6d) and a significant impairment of both anchorage-independent and clonogenic growth (Fig. 6e and 6f; Supplementary Fig. 9). These results suggest that copy number gain of the e3 enhancer region drives MYC over-expression, which contributes to the tumorigenic phenotype.
Fig. 6. CRISPR/Cas9 mediated deletion of the e3 enhancer impairs the oncogenic effect of the e3 enhancer amplification.

(a) Upper: design of CRISPR/Cas9 mediated deletion of the e3 enhancer. Primers used to validate the e3 enhancer deletion are indicated. Bottom: Gel pictures of PCR amplification of genomic DNA using primers outside and inside the e3 enhancer region. sg-Empty: no sgRNA; sg-Control: a pair of sgRNAs that are predicted to not recognize any genomic regions; sg-e3del #1 and sg-e3del #2: two separate pairs of sgRNAs recognizing boundaries of the e3 enhancer region. PCR products were cloned into individual vectors and sequenced. Sequencing results represent the deletions induced by sg-e3del #1 (b) and sg-e3del #2 (c). The expression level of MYC ± SEM as measured by quantitative PCR (n = 2) (d), the cellular transformation efficiency ± SEM as measured by anchorage-independent growth (n = 3) (e) and the cellular proliferation rate ± SEM as measured by clonogenic assays (n = 3) (f) in NCI-H2009 cells with and without CRISPR/Cas9 mediated deletion of the e3 enhancer. The P-value is derived from a t-test; (*) p≤0.05; (**) p≤0.01. (g) Schematic representation of genomic structural variants activating MYC expression in cancer.
MYC overexpression has been observed as a consequence of rearrangements with the IgH locus in Burkitts lymphoma22,49 (Fig. 6g, lower left diagram) as well as through amplifications of the MYC gene itself in several tumor types2 (Fig. 6g, lower left middle diagram). Similar to our findings, focal amplification of different super-enhancer regions downstream of MYC have been reported in T-ALL and AML26,30. Collectively, these data suggest that copy number gain of super-enhancers is highly lineage-specific but may be a common mechanism for upregulating MYC expression in diverse types of cancer (Fig. 6g, lower right panel).
Chromosomal rearrangements that result in the placement of a super-enhancer adjacent to an oncogene have been described in multiple myeloma, leukemia, medulloblastoma and glioblastoma22,27,29,50. Here, we systematically investigate another somatic structural alteration – focal copy number amplification – through pan-cancer analysis of 10,534 tumors integrating genomic, epigenomic and transcriptomic data. We report six super-enhancer regions to be focally amplified across different cancer types. These super-enhancer amplifications are associated with over-expression of the MYC oncogene as well as the KLF5, USP12 and PARD6B genes. Thus, focal amplification of super-enhancers represents a new class of structural alterations with functional implications in cancer. Further identification and characterization of these events through whole-genome and long-read sequencing approaches may shed insight into mechanisms of tumorigenesis and provide novel targets for therapeutic intervention.
Online methods
Pan-Cancer copy number alteration analysis
GISTIC analyses were performed in 29 tumor types (Supplementary Table 1), using copy number data from version 3.0 of the SNP pipeline on 22-Oct-2014 from TCGA copy number portal2,31. Focal amplification peaks of non-coding regions were found in 19 tumor types of which 12 tumor types had H3K27ac ChIP-seq data available for the relevant tissue type (Supplementary Table 1 and 2).
Cell lines
BICR-31 was obtained from Sigma-Aldrich, and A549, NCI-H2009, NCI-H358, HCC95, and Ishikawa cells were obtained from the American Type Culture Collection. Cells were cultured in RPMI 1640 medium supplemented with 10% FBS and 1% penicillin-streptomycin.
ChIP-seq
Chromatin-immunoprecipitation followed by massive parallel sequencing (ChIP-seq) was performed as previously described51,52. Briefly, cells were first crosslinked and lysed. The chromatin extract was sonicated using a Diagenode bioruptor and immunoprecipitated with an anti-H3K27ac antibody (Abcam, ab4729). DNA was extracted and processed with the NEB ChIP-seq library prep kit (E6200S) and sequenced on an Illumina MiSeq (50bp single-end). Sequence reads were aligned to hg19 genome by BWA53 and H3K27ac binding sites were called by MACS54. ChIP-seq was done in duplicate and the results were uploaded to the Gene Expression Omnibus (GSE66992). ChIP-seq data from public datasets are listed in Supplementary Table 2.
RNA-seq
RNA was extracted using the Qiagen RNeasy kit with on-column DNase I treatment. 1 ug of RNA for each sample was processed with the NEBNext PolyA mRNA Magnetic Isolation Module (NEB #E7490) and further processed with the NEBNext Ultra Directional RNA Library Prep Kit (NEB #E7420S). RNA libraries were then sequenced on an Illumina MiSeq (75bp paired-end). Sequence reads were aligned using the PRADA pipeline and differential gene expression was called using the Cufflinks pipeline. RNA-seq was done in duplicate and the results were uploaded to the Gene Expression Omnibus (GSE72001).
Super enhancer identification
Super enhancers were called from the ROSE pipeline24,55 using H3K27ac ChIP-seq data including aligned reads and binding sites called from MACS. Briefly, enhancers were first clustered based on their distance to each other, and then super-enhancers were identified based on the enrichment of the H3K27ac ChIP-seq signal of each enhancer cluster.
Luciferase reporter assays
The pGL3 promoter luciferase reporter system (Promega) was used. The enhancer regions were cloned upstream of the pGL3 minimal promoter region using MluI and XhoI restriction enzyme sites. The enhancer luciferase constructs were then co-transfected with a control Renilla luciferase construct into cells using Fugene 6 (Promega). The luciferase signal was first normalized to the Renilla luciferase signal and then normalized to the signal from the empty pGL3 plasmid. Primers used for cloning are listed in Supplementary Table 3.
3C-qPCR
Chromosome conformation capture (3C) assays were performed as previously described52,56. 3C ligation products were quantified by SYBR-green based PCR. BAC libraries (RP11-628C14, RP11-55J15, CTD-2034C18, RP11-69H6 and CTD-2218N24) containing DNA fragments covering the tested regions were used as template controls for normalizing digestion, ligation and primer efficiency. 3C primers and genomic coordinates of their targets are listed in Supplementary Table 3.
Site-directed deletion of motif sequence
The QuikChange Lightning site-directed mutagenesis system (Agilent Technologies Inc.) was used to generate deletions of the predicted motif sequences in the e3 region. Primers used are listed in Supplementary Table 3.
CRISPR/Cas9 mediated repression and deletion of the enhancer region
CRISPR/Cas9 single-guide RNAs (sgRNA) were identified using the MIT CRISPR Design tool and control non-targeting sgRNAs were selected from the GeCKOv2 library57. All sgRNA sequences are listed in Supplementary Table 3. For repression of the e3 enhancer, the KRAB-dCas9 fusion gene was PCR amplified from pHR-SFFV-KRAB-dCas9-P2A-mCherry (Addgene #60954) and cloned into the XbaI/BamHI sites of lentiCas9-blast (Addgene #52962) to generate lenti-KRAB-dCas9-blast. SgRNAs were cloned into lentiGuide-Puro (Addgene #52963). NCI-H2009 cells were first infected with lenti-KRAB-dCas9-blast and selected with 6μg/ml of blasticidin. Cells stably expressing KRAB-dCas9 were then subsequently infected with sgRNAs and selected with 2μg/ml puromycin. For deletion of the e3 enhancer, tandem U6-promoter-sgRNA and H1-promoter-sgRNA cassettes were cloned into lentiCRISPR_v2 (Addgene #60954) for single vector expression of two sgRNAs as follows: 1) U6-sgRNA and H1-sgRNA products were generated by PCR amplification using the primers listed in Supplementary Table 3, 2) PCR products were then digested with BsmBI to generate compatible sticky ends, 3) finally, three-way ligation of the two PCR products and BsmBI-digested lentiCRISPR_v2 was performed using T7 DNA ligase (NEB #M0318). Control ‘empty’ lentiCRISPR_v2 lacking expression of any sgRNAs was generated by BsmBI digestion, followed by blunting of ends (NEB #E1201) and ligation with T4 DNA ligase (NEB #M0202). After infection, cells were selected with 2μg/ml of puromycin. To detect deletion of the e3 enhancer, genomic DNA was first extracted using QuickExtract DNA extraction solution (Epicentre #QE09050) and then used for PCR using Q5 high-fidelity DNA polymerase (NEB #M0491) with the primers listed in Supplementary Table 3.
Anchorage-independent and clonogenic growth assays
To measure anchorage-independent growth, a base layer of 2ml of 0.75% select agar in RPMI/10% FBS was first prepared in each well of a 6-well plate. Cells were then plated in 1ml of a top layer of 0.3% select agar in RPMI/10% FBS. After 2 weeks, wells were photographed and colonies were counted using CellProfiler software. For the clonogenic growth assay, approximately 300 cells were seeded in 2ml of RPMI/10% FBS in each well of a 6-well plate. Media was completely refreshed every 7 days. Cells were fixed with 100% methanol and then stained with 0.5% crystal violet in 25% methanol. Wells were destained using 10% acetic acid and the crystal-violet signal was read at 595 nm on a Spectramax spectrophotometer.
TaqMan gene expression assay
Quantitative PCR was performed in duplicate using the TaqMan Universal PCR Mastermix on an ABI Quantstudio 6 instrument. The following premade 5′ nuclease assays were ordered from Integrated DNA Technologies: MYC (Hs.PT.58.26770695), NCL (Hs.PT.58.1260587), CDK4 (Hs.PT.58.584267), ODC1 (Hs.PT.58.27029915), NPM1 (Hs.PT.58.40019160) and internal reference HPRT1 (Hs.PT.58v.45621572). Relative expression levels were calculated using the ΔΔCt method.
siRNA-directed gene silencing
A549 cells were transfected with scrambled siRNA (siNC), siNFE2L2 or siCEBPB using Lipofectamine RNAiMAX (Life Technologies). RNA was extracted 48 hours after transfection using the Qiagen RNeasy Kit with on-column DNase treatment. Pre-verified Silencer Select siRNAs (Life Technologies, s9491 and s9492 for NFE2L2, and s2891 and s2892 for CEBPB) were used. To assess the effect of siRNAs, western-blot was performed using antibodies against NFE2L2 (Abcam ab62352), CEBPB (Santa Cruz sc-150) and β-ACTIN (Cell signaling #3700).
Public data usage
Accession numbers for ENCODE data, the Roadmap project data and other public datasets used in this study are listed in Supplementary Table 2.
Supplementary Material
Acknowledgments
We thank Gavin Ha and other members of the Meyerson laboratory for discussions. We acknowledge support from DOD grant W81XWH-12-1-0269 (MM), National Cancer Institute grant 1R35CA197568 (MM) and the American Cancer Society Research Professorship (MM). X.Z. is supported by the Lung Cancer Research Foundation and the American Association for Cancer Research-John and Elizabeth Leonard Family Foundation Basic Cancer Research Fellowship. P. S. C. is supported by a fellowship from the International Association for the Study of Lung Cancer and National Cancer Institute grant 1F32CA180662.
Footnotes
URLs:
TCGA copy number portal: (www.broadinstitute.org/tcga)
MIT CRISPR Design tool: (http://crispr.mit.edu)
Accession code:
Newly generated ChIP-seq and RNA-seq data have been uploaded to the Gene Expression Omnibus GSE66992 and GSE72001, respectively.
Author contributions:
X.Z., P.S.C, J.M.F. and M.M. designed the research and wrote the manuscript with input from the other authors. X.Z., P.S.C, J.M.F and H.W. conducted the biological assays and X.Z, P.S.C, J.M.F, M.I. and A.D.C. conducted the computational analysis.
References
- 1.Stratton MR, Campbell PJ, Futreal PA. The cancer genome. Nature. 2009;458:719–724. doi: 10.1038/nature07943. [DOI] [PMC free article] [PubMed] [Google Scholar]
- 2.Beroukhim R, et al. The landscape of somatic copy-number alteration across human cancers. Nature. 2010;463:899–905. doi: 10.1038/nature08822. [DOI] [PMC free article] [PubMed] [Google Scholar]
- 3.Bignell GR, et al. Signatures of mutation and selection in the cancer genome. Nature. 2010;463:893–898. doi: 10.1038/nature08768. [DOI] [PMC free article] [PubMed] [Google Scholar]
- 4.Stephens PJ, et al. Complex landscapes of somatic rearrangement in human breast cancer genomes. Nature. 2009;462:1005–1010. doi: 10.1038/nature08645. [DOI] [PMC free article] [PubMed] [Google Scholar]
- 5.Weir BA, et al. Characterizing the cancer genome in lung adenocarcinoma. Nature. 2007;450:893–898. doi: 10.1038/nature06358. [DOI] [PMC free article] [PubMed] [Google Scholar]
- 6.The Cancer Genome Atlas Research Network. Comprehensive molecular profiling of lung adenocarcinoma. Nature. 2014;511:543–550. doi: 10.1038/nature13385. [DOI] [PMC free article] [PubMed] [Google Scholar]
- 7.Cancer Genome Atlas Research Network. Comprehensive genomic characterization of squamous cell lung cancers. Nature. 2012;489:519–525. doi: 10.1038/nature11404. [DOI] [PMC free article] [PubMed] [Google Scholar]
- 8.Xue W, et al. A cluster of cooperating tumor-suppressor gene candidates in chromosomal deletions. Proc Natl Acad Sci. 2012;109:8212–8217. doi: 10.1073/pnas.1206062109. [DOI] [PMC free article] [PubMed] [Google Scholar]
- 9.Ong CT, Corces VG. Enhancer function: new insights into the regulation of tissue-specific gene expression. Nat Rev Genet. 2011;12:283–293. doi: 10.1038/nrg2957. [DOI] [PMC free article] [PubMed] [Google Scholar]
- 10.Graf T, Enver T. Forcing cells to change lineages. Nature. 2009;462:587–594. doi: 10.1038/nature08533. [DOI] [PubMed] [Google Scholar]
- 11.Xie W, Ren B. Enhancing Pluripotency and Lineage Specification. Science. 2013;341:245–247. doi: 10.1126/science.1236254. [DOI] [PubMed] [Google Scholar]
- 12.Bulger M, Groudine M. Functional and Mechanistic Diversity of Distal Transcription Enhancers. Cell. 2011;144:327–339. doi: 10.1016/j.cell.2011.01.024. [DOI] [PMC free article] [PubMed] [Google Scholar]
- 13.Lupien M, et al. FoxA1 translates epigenetic signatures into enhancer driven lineage-specific transcription. Cell. 2008;132:958–970. doi: 10.1016/j.cell.2008.01.018. [DOI] [PMC free article] [PubMed] [Google Scholar]
- 14.Visel A, et al. ChIP-seq accurately predicts tissue-specific activity of enhancers. Nature. 2009;457:854–858. doi: 10.1038/nature07730. [DOI] [PMC free article] [PubMed] [Google Scholar]
- 15.Heintzman ND, et al. Distinct and predictive chromatin signatures of transcriptional promoters and enhancers in the human genome. Nat Genet. 2007;39:311–318. doi: 10.1038/ng1966. [DOI] [PubMed] [Google Scholar]
- 16.Heintzman ND, et al. Histone modifications at human enhancers reflect global cell type-specific gene expression. Nature. 2009;459:108–112. doi: 10.1038/nature07829. [DOI] [PMC free article] [PubMed] [Google Scholar]
- 17.Creyghton MP, et al. Histone H3K27ac separates active from poised enhancers and predicts developmental state. Proc Natl Acad Sci. 2010;107:21931–21936. doi: 10.1073/pnas.1016071107. [DOI] [PMC free article] [PubMed] [Google Scholar]
- 18.Ernst J, et al. Mapping and analysis of chromatin state dynamics in nine human cell types. Nature. 2011;473:43–49. doi: 10.1038/nature09906. [DOI] [PMC free article] [PubMed] [Google Scholar]
- 19.Thurman RE, et al. The accessible chromatin landscape of the human genome. Nature. 2012;489:75–82. doi: 10.1038/nature11232. [DOI] [PMC free article] [PubMed] [Google Scholar]
- 20.The ENCODE Project Consortium. An integrated encyclopedia of DNA elements in the human genome. Nature. 2012;489:57–74. doi: 10.1038/nature11247. [DOI] [PMC free article] [PubMed] [Google Scholar]
- 21.Roadmap Epigenomics Consortium et al. Integrative analysis of 111 reference human epigenomes. Nature. 2015;518:317–330. doi: 10.1038/nature14248. [DOI] [PMC free article] [PubMed] [Google Scholar]
- 22.Hnisz D, et al. Super-enhancers in the control of cell identity and disease. Cell. 2013;155:934–947. doi: 10.1016/j.cell.2013.09.053. [DOI] [PMC free article] [PubMed] [Google Scholar]
- 23.Pott S, Lieb JD. What are super-enhancers? Nat Genet. 2015;47:8–12. doi: 10.1038/ng.3167. [DOI] [PubMed] [Google Scholar]
- 24.Lovén J, et al. Selective inhibition of tumor oncogenes by disruption of super-enhancers. Cell. 2013;153:320–334. doi: 10.1016/j.cell.2013.03.036. [DOI] [PMC free article] [PubMed] [Google Scholar]
- 25.Lovén J, et al. Selective inhibition of tumor oncogenes by disruption of super-enhancers. Cell. 2013;153:320–334. doi: 10.1016/j.cell.2013.03.036. [DOI] [PMC free article] [PubMed] [Google Scholar]
- 26.Shi J, et al. Role of SWI/SNF in acute leukemia maintenance and enhancer-mediated Myc regulation. Genes Dev. 2013 doi: 10.1101/gad.232710.113. [DOI] [PMC free article] [PubMed] [Google Scholar]
- 27.Northcott PA, et al. Enhancer hijacking activates GFI1 family oncogenes in medulloblastoma. Nature. 2014;511:428–434. doi: 10.1038/nature13379. [DOI] [PMC free article] [PubMed] [Google Scholar]
- 28.Mansour MR, et al. An oncogenic super-enhancer formed through somatic mutation of a noncoding intergenic element. Science. 2014;346:1373–1377. doi: 10.1126/science.1259037. [DOI] [PMC free article] [PubMed] [Google Scholar]
- 29.Gröschel S, et al. A Single Oncogenic Enhancer Rearrangement Causes Concomitant EVI1 and GATA2 Deregulation in Leukemia. Cell. 2014;157:369–381. doi: 10.1016/j.cell.2014.02.019. [DOI] [PubMed] [Google Scholar]
- 30.Herranz D, et al. A NOTCH1-driven MYC enhancer promotes T cell development, transformation and acute lymphoblastic leukemia. Nat Med. doi: 10.1038/nm.3665. advance online publication, 2014. [DOI] [PMC free article] [PubMed] [Google Scholar]
- 31.Mermel CH, et al. GISTIC2.0 facilitates sensitive and confident localization of the targets of focal somatic copy-number alteration in human cancers. Genome Biol. 2011;12:R41. doi: 10.1186/gb-2011-12-4-r41. [DOI] [PMC free article] [PubMed] [Google Scholar]
- 32.Akhtar-Zaidi B, et al. Epigenomic enhancer profiling defines a signature of colon cancer. Science. 2012;336:736–739. doi: 10.1126/science.1217277. [DOI] [PMC free article] [PubMed] [Google Scholar]
- 33.Whyte WA, et al. Master transcription factors and mediator establish super-enhancers at key cell identity genes. Cell. 2013;153:307–319. doi: 10.1016/j.cell.2013.03.035. [DOI] [PMC free article] [PubMed] [Google Scholar]
- 34.Burska UL, et al. Deubiquitinating enzyme Usp12 is a novel co-activator of the androgen receptor. J Biol Chem. 2013;288:32641–32650. doi: 10.1074/jbc.M113.485912. [DOI] [PMC free article] [PubMed] [Google Scholar]
- 35.Qiu RG, Abo A, Martin GS. A human homolog of the C. elegans polarity determinant Par-6 links Rac and Cdc42 to PKCζ signaling and cell transformation. Curr Biol. 2000;10:697–707. doi: 10.1016/s0960-9822(00)00535-2. [DOI] [PubMed] [Google Scholar]
- 36.Barretina J, et al. The Cancer Cell Line Encyclopedia enables predictive modelling of anticancer drug sensitivity. Nature. 2012;483:603–607. doi: 10.1038/nature11003. [DOI] [PMC free article] [PubMed] [Google Scholar]
- 37.Imielinski M, et al. Mapping the hallmarks of lung adenocarcinoma with massively parallel sequencing. Cell. 2012;150:1107–1120. doi: 10.1016/j.cell.2012.08.029. [DOI] [PMC free article] [PubMed] [Google Scholar]
- 38.Kagey MH, et al. Mediator and cohesin connect gene expression and chromatin architecture. Nature. 2010;467:430–435. doi: 10.1038/nature09380. [DOI] [PMC free article] [PubMed] [Google Scholar]
- 39.Deng W, et al. Controlling long-range genomic interactions at a native locus by targeted tethering of a looping factor. Cell. 2012;149:1233–1244. doi: 10.1016/j.cell.2012.03.051. [DOI] [PMC free article] [PubMed] [Google Scholar]
- 40.Bailey SD, et al. ZNF143 provides sequence specificity to secure chromatin interactions at gene promoters. Nat Commun. 2015;2 doi: 10.1038/ncomms7186. [DOI] [PMC free article] [PubMed] [Google Scholar]
- 41.Wang J, et al. Sequence features and chromatin structure around the genomic regions bound by 119 human transcription factors. Genome Res. 2012;22:1798–1812. doi: 10.1101/gr.139105.112. [DOI] [PMC free article] [PubMed] [Google Scholar]
- 42.Gilbert LA, et al. CRISPR-Mediated Modular RNA-Guided Regulation of Transcription in Eukaryotes. Cell. 2013;154:442–451. doi: 10.1016/j.cell.2013.06.044. [DOI] [PMC free article] [PubMed] [Google Scholar]
- 43.Kearns NA, et al. Functional annotation of native enhancers with a Cas9-histone demethylase fusion. Nat Methods. 2015;12:401–403. doi: 10.1038/nmeth.3325. [DOI] [PMC free article] [PubMed] [Google Scholar]
- 44.Schlosser I, et al. Dissection of transcriptional programmes in response to serum and c-Myc in a human B-cell line. Oncogene. 2005;24:520–524. doi: 10.1038/sj.onc.1208198. [DOI] [PubMed] [Google Scholar]
- 45.Coller HA, et al. Expression analysis with oligonucleotide microarrays reveals that MYC regulates genes involved in growth, cell cycle, signaling, and adhesion. Proc Natl Acad Sci U S A. 2000;97:3260–3265. doi: 10.1073/pnas.97.7.3260. [DOI] [PMC free article] [PubMed] [Google Scholar]
- 46.Zeller KI, Jegga AG, Aronow BJ, O’Donnell KA, Dang CV. An integrated database of genes responsive to the Myc oncogenic transcription factor: identification of direct genomic targets. Genome Biol. 2003;4:R69. doi: 10.1186/gb-2003-4-10-r69. [DOI] [PMC free article] [PubMed] [Google Scholar]
- 47.Schuhmacher M, et al. The transcriptional program of a human B cell line in response to Myc. Nucleic Acids Res. 2001;29:397–406. doi: 10.1093/nar/29.2.397. [DOI] [PMC free article] [PubMed] [Google Scholar]
- 48.Subramanian A, et al. Gene set enrichment analysis: a knowledge-based approach for interpreting genome-wide expression profiles. Proc Natl Acad Sci U S A. 2005;102:15545–15550. doi: 10.1073/pnas.0506580102. [DOI] [PMC free article] [PubMed] [Google Scholar]
- 49.Battey J, et al. The human c-myc oncogene: structural consequences of translocation into the IgH locus in Burkitt lymphoma. Cell. 1983;34:779–787. doi: 10.1016/0092-8674(83)90534-2. [DOI] [PubMed] [Google Scholar]
- 50.Francis JM, et al. EGFR variant heterogeneity in glioblastoma resolved through single-nucleus sequencing. Cancer Discov. 2014;4:956–971. doi: 10.1158/2159-8290.CD-13-0879. [DOI] [PMC free article] [PubMed] [Google Scholar]
- 51.Cowper-Sal·lari R, et al. Breast cancer risk-associated SNPs modulate the affinity of chromatin for FOXA1 and alter gene expression. Nat Genet. 2012;44:1191–1198. doi: 10.1038/ng.2416. [DOI] [PMC free article] [PubMed] [Google Scholar]
- 52.Zhang X, Cowper-Sal lari R, Bailey SD, Moore JH, Lupien M. Integrative functional genomics identifies an enhancer looping to the SOX9 gene disrupted by the 17q24.3 prostate cancer risk locus. Genome Res. 2012;22:1437–1446. doi: 10.1101/gr.135665.111. [DOI] [PMC free article] [PubMed] [Google Scholar]
- 53.Li H, Durbin R. Fast and accurate short read alignment with Burrows-Wheeler transform. Bioinforma Oxf Engl. 2009;25:1754–1760. doi: 10.1093/bioinformatics/btp324. [DOI] [PMC free article] [PubMed] [Google Scholar]
- 54.Zhang Y, et al. Model-based Analysis of ChIP-Seq (MACS) Genome Biol. 2008;9:R137. doi: 10.1186/gb-2008-9-9-r137. [DOI] [PMC free article] [PubMed] [Google Scholar]
- 55.Hnisz D, et al. Super-Enhancers in the Control of Cell Identity and Disease. Cell. 2013;155:934–947. doi: 10.1016/j.cell.2013.09.053. [DOI] [PMC free article] [PubMed] [Google Scholar]
- 56.Bailey SD, et al. ZNF143 provides sequence specificity to secure chromatin interactions at gene promoters. Nat Commun. 2015;2 doi: 10.1038/ncomms7186. [DOI] [PMC free article] [PubMed] [Google Scholar]
- 57.Sanjana NE, Shalem O, Zhang F. Improved vectors and genome-wide libraries for CRISPR screening. Nat Methods. 2014;11:783–784. doi: 10.1038/nmeth.3047. [DOI] [PMC free article] [PubMed] [Google Scholar]
Associated Data
This section collects any data citations, data availability statements, or supplementary materials included in this article.