

Abstract
Background
Serotonin (5‐hydroxytryptamine, 5HT) is involved in hypothalamic regulation of energy consumption. Also, the gut microbiome can influence neuronal signaling to the brain through vagal afferent neurons. Therefore, serotonin concentrations in the central nervous system and the composition of the microbiota can be related to obesity.
Objective
To examine adipokine, and, serotonin concentrations, and the gut microbiota in lean dogs and dogs with experimentally induced obesity.
Animals
Fourteen healthy Beagle dogs were used in this study.
Methods
Seven Beagle dogs in the obese group were fed commercial food ad libitum, over a period of 6 months to increase their weight and seven Beagle dogs in lean group were fed a restricted amount of the same diet to maintain optimal body condition over a period of 6 months. Peripheral leptin, adiponectin, 5HT, and cerebrospinal fluid (CSF‐5HT) levels were measured by ELISA. Fecal samples were collected in lean and obese groups 6 months after obesity was induced. Targeted pyrosequencing of the 16S rRNA gene was performed using a Genome Sequencer FLX plus system.
Results
Leptin concentrations were higher in the obese group (1.98 ± 1.00) compared to those of the lean group (1.12 ± 0.07, P = .025). Adiponectin and 5‐hydroytryptamine of cerebrospinal fluid (CSF‐5HT) concentrations were higher in the lean group (27.1 ± 7.28) than in the obese group (14.4 ± 5.40, P = .018). Analysis of the microbiome revealed that the diversity of the microbial community was lower in the obese group. Microbes from the phylum Firmicutes (85%) were predominant group in the gut microbiota of lean dogs. However, bacteria from the phylum Proteobacteria (76%) were the predominant group in the gut microbiota of dogs in the obese group.
Conclusions and Clinical Importance
Decreased 5HT levels in obese group might increase the risk of obesity because of increased appetite. Microflora enriched with gram‐negative might be related with chronic inflammation status in obese dogs.
Keywords: Adipokine, Dog, Microbiome, Microbiota, Nutrition, Obesity, Pyrosequencing, Serotonin
Abbreviations
- 16S rRNA
16S ribosomal ribo nucleic acid gene
- 5HT
5‐hydroxytryptamine
- ACTH
adrenocorticotropic hormone
- BBB
blood brain barrier
- BCS
body condition score
- bTEFAP
bacterial tag‐encoded FLX amplicon pyrosequencing
- CNS
central nervous system
- CSF
cerebrospinal fluid
- HDL
high density lipoprotein
- LDL
low density lipoprotein
- OTU
operative taxonomic unit
- PCR
polymerase chain reaction
- TG
triglyceride
- tT4
total thyroxine
Obesity is the most common form of nutritional imbalance of companion animals in industrialized countries. If pets weigh 20–30% more than their ideal body weight, they are classified as obese.1 Obesity in dog is associated with several health conditions including insulin resistance, pancreatitis, cruciate ligament rupture, and respiratory distress.2, 3 Bioactive peptides such as leptin, adiponectin, and pro‐inflammatory cytokines secreted from the adipose tissue are called adipokines.4 Serotonin (5‐hydroxytryptamine or 5HT) is a biochemical marker of mood and is associated with several behavioral and psychological factors.5, 6 5HT is involved in hypothalamic regulation of energy consumption and serotonin levels in the central nervous system (CNS) and is influenced by energy conditions.7
The estimated bacterial content of the mammalian gastrointestinal tract is approximately 1014 bacteria.8 The indigenous microbiota within the gastrointestinal tract can extract calories from otherwise indigestible common polysaccharides in daily diets.9 Gut microbiota can also regulate the brain‐gut axis.10 The hypothalamus and the brain stem are central sites of appetite regulation.11 The gut microbiome can stimulate vagal sensory neurons, which is a major neural pathway that conveys information from the gastrointestinal luminal contents to the brain and modulates gastrointestinal motility and feeding behavior.12, 13 The gut microbiome can influence neuronal signaling to the brain through vagal afferent neurons.14 Several diseases including obesity, inflammatory bowel disease, and allergic disease are associated with alterations, disruption, and decreased biodiversity of the intestinal microbiota.8, 15, 16, 17 Obesity is associated with changes in the gut microbiota in humans11 and in animal models.8, 16 However, recent metagenomics studies using a canine obesity model yielded results that were inconsistent with mouse model studies.8, 18 The objectives of this study were to evaluate the peripheral concentrations of leptin, adiponectin, and 5HT, and the lipid profiles of lean Beagle dogs and dogs with ad libitum feeding‐induced obesity and to examine differences in the gut microbiota composition in the 2 groups. To study the role of the microbiome in this process, we performed culture‐independent analysis of the microbiome. Culture‐independent technique has been used in microbiome studies of dog.19, 20 Culture‐independent technique approach allowed us to bypass the isolation and cultivation of individual species and improved our ability to identify obesity‐associated microbial changes in the gut.21, 22
This study examined the differences in lipid profiles, peripheral concentrations of leptin, adiponectin, and serotonin, and changes in the gut microbiota in lean Beagle dogs and dogs with experimentally induced obesity.
Material and Methods
Animals
Fourteen 3 to 5 years old healthy Beagle dogs were used in this study. The animals were housed at the Chungnam National University Veterinary Medicine Internal Medicine laboratory. The experiments were performed according to the Guide for the Care and Use of Laboratory Animals of Chungnam National University (approved no. CNU 00245). Physical examination, complete blood count (CBC), serum biochemistry, total thyroxine (tT4), and adrenocorticotropic hormone (ACTH) analyses were used to monitor the health of the dogs. Seven Beagle dogs in the obese group were fed commercial food1 ad libitum, and seven Beagle dogs in the lean group were fed a restricted amount of the same diet to maintain optimal body weight over a period of 6 months. In order to rule out individual bias, one investigator checked the body weight once a week using the same scale, and assigned BCS. The amount of feed was determined based on the body weight and BCS, and lean group dogs were restricted diet or feed more to maintain the same BCS and body weight. We weighed the feed before we provided lean group dogs with it. Before induction of obesity, each dog was weighed and examined to eliminate potential underlying inflammatory conditions. The dogs were classified as lean (BCS 4–5/9) or obese (BCS 7.5–9/9) using a 9‐point body condition score (BCS) system.17
Sandwich Enzyme‐linked Immunosorbent Assay and Hormone Assay
Serum leptin and adiponectin concentrations were measured using a commercial canine leptin sandwich enzyme‐linked immunosorbent assay (ELISA) kit (Canine Leptin ELISA2) and commercial canine adiponectin ELISA kit (Canine adiponectin ELISA3), respectively, according to the manufacturer's instructions. The serum tT4 and cortisol levels were measured using an Immulite 1000 immunoassay analyzer.4 The plasma 5HT levels and 5‐hydroxytryptamine levels in the cerebrospinal fluid (CSF‐5HT) were measured using a commercial ELISA kit5 according to the manufacturer's instructions. All measurements were performed in duplicate. The platelet counts and morphology of whole blood samples were analyzed to study the relationship between plasma 5HT levels and platelets. The platelets counted using an automated system,6 and the platelet morphology was inspected visually.
PCR Amplicon Construction and Sequencing
The fecal samples for the microbiome comparison were collected 6 month after the induction of obesity. Fecal samples were collected immediately after spontaneous defecation, transported immediately to the laboratory, and frozen at −80°Ϲ without any additives or pretreatment. The DNA of the bacterial community was extracted using a feces DNA extraction kit.7 The 16S ribosomal ribonucleic acid genes (16S rRNA) were amplified using polymerase chain reactions (PCR) according to the GS FLX Plus Library Prep guide. Twenty nanograms of DNA from each sample were used in a 50 μL PCR reaction. The 16S universal primers 27F (5′ GAGTTTGATCMTGGCTCAG 3′) and 800R (5′ TACCAGGGTATCTAATCC 3′) were used to amplify 16s rRNA genes (V1–V4 region). The FastStart High Fidelity PCR System8 was used for PCR with the following reaction conditions: 94°C for 3 minutes followed by 35 cycles of 94°C for 15 seconds; 55°C for 45 seconds and 72°C for 1 minute; and a final elongation step at 72°C for 8 minutes. The PCR amplicons were purified using AMPure9 beads and quantified using a Picogreen assay.10 The amplicons were sequenced using a Genome Sequencer FLX Plus,11 and each sample was loaded in 1 region of an 70–75 mm PicoTiter plate12 fitted with a 8‐lane gasket. The sequencing reactions were performed by Macrogen Inc.13
16S rRNA Gene Analysis
The CD‐HIT‐OTU software was used to eliminate sequences containing homopolymers runs or chimeras, to remove sequence noise and to cluster the sequences.23 Operative taxonomic units (OTUs) were generated by the CD‐HIT‐OTU software using the following cutoff values for similarity: species, 97%; genus, 94%; family, 90%; order, 85%; class, 80%; phylum, 75%.18 The Mothur software (version 1.31.0)11 was used to evaluate microbial diversities.24 The Shannon–Weaver25 and Simpson diversity indices26 were used to analyze species diversity.
All the sequences were compared to the Silva rRNA database using BLASTN.27, 28 The sequences that matched 16S rRNA genes with an E‐value less than 0.01 less were classified as partial 16S rRNA sequences. Non‐16S rRNA sequences comprised less than 1% of the total sequences. Taxonomic assignment of the sequenced reads was performed using NCBI Taxonomy databases. Using the BLASTN program, the five most similar sequences for each sequence were selected according to their bit scores and E‐values. The Needleman–Wunsch global alignment algorithm was used to perform optimal alignment of the two sequences along their entire duration. A pairwise global alignment was performed on the selected candidate hits to identify the best‐aligned hit.29 The taxonomy of the sequence with the highest similarity was assigned to the sequence read.
A Newick tree was generated with the Thetayc distance matrix using the UPGMA algorithm implemented in Mothur (version 1.31.0)14 and visualized using FigTree (Version 1.4).15 To identify clustering of samples along the first three axes of maximal variance, principal component analysis plots (PCA) were generated using the function prcomp in the R package.30
Statistical Analysis
Statistical analysis was performed using spss Statistics 20.0.0.16 Serum leptin, adiponectin, triglyceride, cholesterol, tT4, and cortisol levels and plasma 5HT concentrations were presented as the mean values of each group ± standard deviations (SD). P values <.05 were considered to represent significant differences. The age, BCS, and leptin, adiponectin, 5HT, tT4, cortisol, platelet, triglyceride and cholesterol levels were compared between the lean and obese groups using the independent samples t‐test and between the pre‐ and posttest data in each group using the paired samples t‐test. For microbiota analysis, an unpaired t‐test was used to compare normally distributed data and the Mann–Whitney U‐test was used for nonparametric data.
Results
Adipokines and Serotonin Levels
At the beginning of the trial, there were no significant differences in age, body weight, or BCS between animals in the two groups. In the lean group, the average age was 3.28 ± 0.45 years (mean ± SD), body weight was 6.69 ± 0.47 kg (mean ± SD), and BCS was 4.28 ± 0.45 (mean ± SD). In the obese group, the average age was 3.71 ± 0.45 years (mean ± SD), body weight was 7.37 ± 0.44 kg (mean ± SD), and BCS was 5 ± 0.00 (mean ± SD). Six months after the induction of obesity, dogs in the lean group showed no significant increase or decrease in weight compared to the initial values (Table 1). However, the body weight, BCS, and leptin and triglyceride (TG) levels of the dogs in the obese group were significantly increased, whereas the adiponectin and 5HT levels were significantly decreased compared to the respective values before the induction of obesity (P < .05) (Table 1).
Table 1.
Body weight and BCS, adipokine, and serotonin concentration measured before and 6 months after obesity induction (mean ± SD)
| Lean Group (N = 7) | Obese Group (N = 7) | |||||
|---|---|---|---|---|---|---|
| Beforea | After | P value | Beforea | After | P value | |
| Body weight (kg) | 6.69 ± 0.47 | 6.57 ± 0.58 | .67 | 7.37 ± 0.44 | 12.3 ± 1.53 | .018 |
| BCS | 4.57 ± 0.49 | 4.57 ± 0.49 | 1.00 | 5.00 ± 0.00 | 8.71 ± 0.45 | .014 |
| Leptin (ng/mL) | 1.43 ± 0.49 | 1.12 ± 0.67 | .13 | 1.27 ± 0.28 | 1.99 ± 1.00 | .18 |
| Adiponeptin (μg/mL) | 16.9 ± 8.28 | 19.9 ± 7.12 | .31 | 22.4 ± 7.87 | 9.07 ± 4.72 | .018 |
| 5HT (ng/mL) | 763 ± 23.8 | 743 ± 27.4 | .24 | 794 ± 81.5 | 667 ± 98.1 | .028 |
| Triglyceride (mg/dL) | 37.3 ± 13.1 | 43.9 ± 6.01 | .24 | 32.1 ± 4.97 | 100 ± 64.9 | .028 |
| Cholesterol (mg/dL) | 149 ± 22.3 | 163 ± 15.8 | .24 | 154 ± 43.0 | 204 ± 41.4 | .20 |
Before: measured before obesity induction. After: measured 6 months after obesity induction.
BCS, body condition score.
No significant differences between the values of two groups measured before the obesity induction.
We compared the obesity parameters between the groups 6 months after obesity induction and observed that the leptin, cholesterol, and cortisol concentrations were significantly higher in the obese group compared to the lean group (P < .05). The adiponectin, CSF‐5HT, and total T4 (tT4) concentrations were higher in the lean group compared to the obese group (P < .05). The CSF‐5HT levels were significantly lower in the obese group compared with the lean group (Table 2).
Table 2.
Comparison of body weight and BCS, adipokine and 5HT concentrations between lean and obese groups measured 6 months after obesity induction (mean ± SD)
| Lean Group (N = 7) | Obese Group (N = 7) | P value | |
|---|---|---|---|
| Body weight (kg) | 6.57 ± 0.55 | 12.3 ± 1.53 | .025 |
| BCS | 4.57 ± 0.49 | 8.71 ± 0.45 | .012 |
| Leptin (ng/mL) | 1.12 ± 0.07 | 1.98 ± 1.00 | .025 |
| Adiponeptin (μg/mL) | 19.9 ± 7.12 | 9.07 ± 4.72 | .018 |
| Serotonin (ng/mL) | 743 ± 27.4 | 667 ± 98.1 | .11 |
| CSF‐5HT levels (ng/mL) | 27.1 ± 7.28 | 14.4 ± 5.40 | .018 |
| Triglyceride (mg/dL) | 43.9 ± 6.01 | 100 ± 64.9 | .092 |
| Cholesterol (mg/dL) | 163 ± 15.7 | 204 ± 41.4 | .048 |
| HDL (mg/dL) | 111 ± 10.6 | 136 ± 25.7 | .073 |
| LDL (mg/dL) | 41.7 ± 10.4 | 48.4 ± 20.3 | .57 |
| HDL/LDL ratio | 2.76 ± 1.01 | 3.01 ± 0.81 | .61 |
| Total T4 (μg/dL) | 4.21 ± 1.49 | 2.11 ± 0.82 | .018 |
| Cortisol (μg/dL) | 2.31 ± 0.91 | 3.93 ± 0.83 | .018 |
5HT, 5‐Hydroxytryptamine; BCS, body condition score; HDL, high density lipoprotein; LDL, low density lipoprotein.
Metagenomic Analysis
Alpha Diversity and OTU‐based Analysis
A total of 145,396 Bacterial tag‐encoded FLX amplicon pyrosequencing (bTEFAP) sequences from all dogs were analyzed. A mean of 9,510 (9,510 ± 1,270) reads/dog were analyzed in the lean group. At an OTU definition at a similarity cutoff of 97%, 320 OTUs were identified in the lean group. In the obese group, a mean of 11,300 (11,300 ± 3,520) sequences/dog were analyzed, and 200 OTUs were identified (Table 3). At an OTU definition at a similar cutoff of 95% at the genus level, 281 and 157 OTUs were identified in the lean and obese groups, respectively (Table 3). The Shannon and Simpson's reciprocal diversity indices were calculated at the genus and species levels (Table 3). At the genus level, the number of OTUs observed per animal (mean ± SD) and Shannon diversity index were significantly higher in the lean group compared to the obese group, and Simpson's reciprocal index was significantly lower in the lean group compared to the obese group (Table 3). At the species level, significantly higher OTUs/dog and Shannon diversity index and lower Simpson's reciprocal index were observed in lean group compared to the obese group (Table 3). The rarefaction curves plateaued after sampling more than 2,000 sequence reads. The rarefaction curves indicated that the sampling completeness was modest, but still provided sufficient microbial diversity to effectively analyze higher abundance sequences at the species level.
Table 3.
Alpha diversity of fecal microbiota and OTU‐based analysis (mean ± SD)
| Lean Group | Obese Group | |
|---|---|---|
| Genus level (5% dissimilarity) | ||
| Shannon diversity index | 2.25 ± 0.35 | 1.32 ± 0.31b |
| Simpson's reciprocal index | 0.19 ± 0.07 | 0.44 ± 0.14b |
| Observed OTUs | 40.1 ± 10.1 | 22.4 ± 5.75a |
| Total observed OTUs | 281 | 157 |
| Species level (3% dissimilarity) | ||
| Shannon diversity index | 2.42 ± 0.03 | 1.54 ± 0.35b |
| Simpson's reciprocal index | 0.16 ± 0.06 | 0.37 ± 0.14b |
| Observed OTUs | 45.7 ± 9.95 | 28.6 ± 6.28a |
| Total observed OTUs | 320 | 200 |
OTU, operative taxonomic unit.
P < .05 between two groups.
P < .01 between two groups.
Beta Diversity and Taxon‐based Analysis
At the phylum level, the bacterial communities in dogs in the lean group were primarily composed of Firmicutes (85.2%), followed by Actinobacteria, Proteobacteria, and Bacteroidetes, whereas the predominant bacterial phyla in dogs in the obese group were Proteobacteria, followed by Firmicutes (Fig 1). The relative proportions of Firmicutes (P = .0043) and Fusobacteria in the lean group were higher compared to the obese group, and the relative proportion of Proteobacteria (P = .0021) in the obese group was significantly higher compared to the lean group (Fig 1). The Firmicutes in the lean group included genera Lactobacillus (61%), Faecalibacterium (11%), and Turicibacter (10%). Similarly, the Firmicutes in the obese group included Lactobacillus (63%), unclassified (17%), and Enterococcus (13%) genera (Fig 2A,B). However, the bacterial community members belonging to the phylum Proteobacteria were significantly different between the two groups. The genera Psychrobacter (36%) and Pseudomonas (31%) were the dominant proteobacterial genera in the obese group; however, unclassified bacteria (38%), Sutterella (27%), and Achromobacter (15%) were the most prevalent proteobacterial genera in the lean group (Fig 2C,D). Principal coordinate analysis was performed to determine the relationships between microbial communities in both groups. This analysis revealed that the microbial compositions in the dogs segregated by groups (lean versus obese) (Fig 3A,B), as shown in the phylogenetic tree (Fig 3C), indicating that the microbial communities in the lean and obese groups were different.
Figure 1.
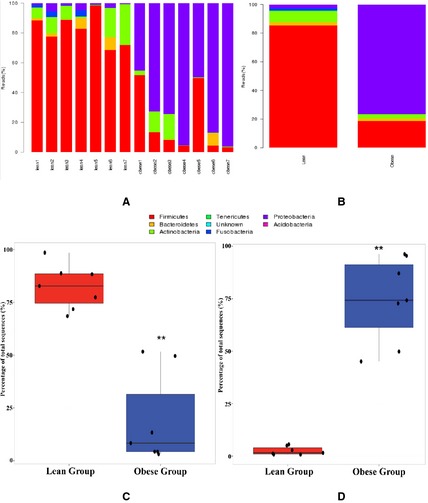
Taxonomic classification of the sequences at phylum level. (A) Individual sample analysis. (B) Group‐based polled sample analysis. (C) Relative abundance of Firmicutes in the fecal samples of lean and obese groups. (D) Relative abundance of Proteobacteria in the fecal samples of lean and obese groups. **P <.01 between two groups.
Figure 2.
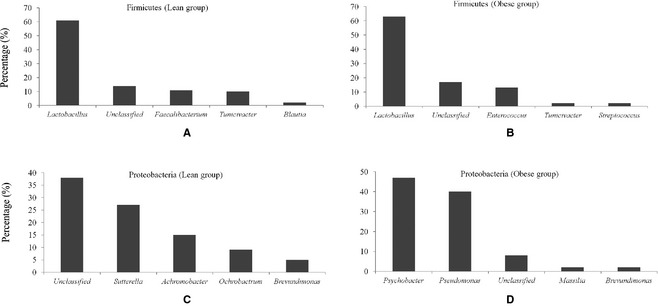
Relative abundance of genera belonging to phylum Firmicutes and Proteobacteria. (A) Proportion of genera belonging to phylum Firmicutes in lean group. (B) Proportion of genera belonging to phylum Firmicutes in obese group. (C) Proportion of genera belonging to phylum Proteobacteria in lean group. (D) Proportion of genera belonging to phylum Proteobacteria in obese group.
Figure 3.
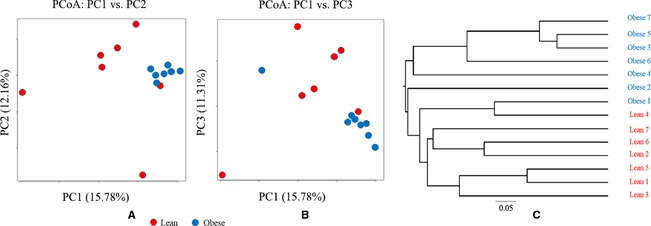
Principal component analysis (PCA) plots and phylogenetic tree. To identify clustering of samples along the first three axes of maximal variance, principal component analysis plots (PCA) were generated using the function prcomp in the R package. For the phylogenetic tree, a Newick tree was generated with the Thetayc distance matrix using the UPGMA algorithm implemented in Mothur (version 1.31.0)12 and visualized using FigTree (Version 1.4).13 (A) PCA plot (PC1 versus PC2). (B) PCA plot (PC1 versus PC3). (C) Phylogenetic tree.
Discussion
In this study, the 16S rRNA gene pyrosequencing analysis indicated that the diversity of the microbial community was lower in the obese group compared to the lean group. The lean group microbiota predominantly contained Firmicutes. However, the microbiota of the obese dogs were dominated by the phylum Proteobacteria.
The CSF‐5HT levels were lower in the obese group compared to the lean group. Decreased 5HT levels can increase the risk of obesity because of increased appetite. Members of the gram‐negative bacterial phylum Proteobacteria were abundant in the obese group. An enrichment of gram‐negative bacteria can influence the level of intestinal lipopolysaccharide (LPS), and this may be associated with chronic inflammation in obese subjects.
Similar to humans, dogs may become overweight gradually over a period of months or years in response to a relatively small but prolonged energy imbalance. However, some pets gain weight rapidly over a period of a few weeks or months, when the energy expenditure decreases markedly without a reduction in energy intake because of neutering and reduced activity levels.1 The BCS and body weight of the dogs in the obese group increased markedly over 6 months. Consistent with previous studies, the leptin and cholesterol levels were higher in the obese group.32 The adiponectin, tT4 and CSF‐5HT levels were markedly lower in the obese group compared to the lean group. Serotonin and dopamine are important neurotransmitters involved in appetite regulation.33 Lambert et al33 observed that human obesity was associated with chronic increase in brain serotonin and the main serotonin metabolite is 5‐hydroxyindoleacetic acid.33 A previous human study observed that overweight patients have higher levels of CSF‐5HT metabolites than normal‐weight individuals, indicating that 5HT might influence food‐seeking behavior.32 However, we observed that the obese group had lower CSF‐5HT levels compared to the lean group. Dogs with lower CSF 5HT levels might continue to eat until the CSF 5HT level is high enough to cause satiation, which is similar to the mechanism of action of the 5HT antagonist; the 5HT antagonist was used to increase appetite.34
Ley et al8 observed a marked change in the microbial proportion including a 50% reduction in the abundance of the phylum Bacteroidetes and an increase in Firmicutes in obese mice. This is inconsistent with our results: we observed a decrease in the proportion of Firmicutes and an increase in the proportion of Proteobacteria in the obese group. Our results are consistent with human studies.35 Schwiertz et al36 analyzed fecal microbiota by real‐time polymerase chain reaction (RT‐PCR) instead of pyrosequencing and observed that the proportion of Bacteroidetes was increased in the fecal microbiota of obese humans. Other studies observed no differences in the proportions of Bacteroidetes and Firmicutes in lean and obese individuals.37, 38 The phylum Firmicutes is the most abundant bacterial group in normal healthy gut microbiota, followed by the phylum Bacteroidetes.8, 35, 36 Our results in the lean group are consistent with these studies. The phylum Firmicutes (85.2%) was the most dominant group, but Actinobacteria (7.94%) were more abundant than Bacteroidetes (2.34%) in the lean group. In a canine obesity model study,18 Firmicutes, Fusobacteria, and Actinobacteria were the predominant bacterial phyla. The phylum Actinobacteria and the genus Roseburia were significantly more abundant in obese pet dogs. In addition, obesity induced by ad libitum feeding was associated with a significant increase in the order Clostridiales.18 The composition of the intestinal microbiota is influenced by body fat mass, sex, diet, age, breed, and kinship.39, 40, 41 In this study, we attempted to restrict other factors that may influence gut microbiota, including breed, age, and food. Obesity was induced by ad libitum feeding for 6 months, and the same commercially available food was used in both groups. Handl et al18 used the same feeding strategy and observed that obese dogs contained increased proportions of the major bacterial phylum (>90% Firmicutes, approximately 2% of Bacteroidetes and Actinobacteria, respectively, and no significant differences were observed in the microbial communities of the ad libitum fed and restricted‐diet group, except the order Clostridiales.16 Our results showed significant differences in the microbial communities in the lean and obese groups. The increased Shannon‐Weaver diversity index25 and decreased Simpson reciprocal index26 indicated that the diversity of microbial communities was lower in the obese group. The predominant phylum in the obese group was Proteobacteria instead of Firmicutes. Specially, the order Clostridiales were markedly more abundant in the lean group compared to the obese group, and the proportion of Pseudomonadales was markedly higher in the obese group compared to the lean group (Table 3). The genus Lactobacillus was markedly more abundant in the lean group compared to the obese group (Table 3). Cani et al42 observed that bacterial lipopolysaccharide (LPS), which is an essential cell wall compartment of gram‐negative bacteria, triggers systemic inflammation. They observed that LPS‐injected mice showed increased weight without altered energy intake.42 This mechanism may link the gut microbiota to the development of obesity.42 Enterochromaffin cells in the intestinal epithelium release 5HT upon mechanical stimulation to promote transit.43 The decreased colonic transit time may provide extra time for the gut microorganisms to harvest energy from indigestible foods in the diet. In this study, there was no important difference in the peripheral 5HT levels in the lean and obese groups, but longitudinal changes were observed in the obese group. After induction of obesity, the plasma 5HT levels were markedly decreased in the obese group. Experimentally induced obesity is known to decrease 5HT levels.44 Inflammation associated with changes in the gut microbiota is considered to decrease 5HT availability during obesity.43, 45 Studies have yielded inconsistent data on the composition of the gut microbiota in obese subjects.8, 18, 46 In our study, the phylum Proteobacteria, which belongs to gram‐negative bacteria, was abundant in the obese group. Enrichment of gram‐negative bacteria can increase the intestinal LPS level, and this may be associated with chronic inflammation in obese subjects.
A limitation of this study is that there are no reference values for plasma 5HT and CSF‐5HT concentrations in dogs. In human studies, CSF‐5HT metabolite levels were measured instead of 5HT. This study is carried out the measurement of CSF‐5HT using an ELISA kit. In addition, a longitudinal study design and the baseline comparison of microbiome will strengthen the conclusion that links obesity with specific population of microflora. One time comparison has been used to evaluate bacterial differences between two different treatment groups or diseased animals in various studies because gut microbiome of healthy adult individual would have similar gut microbiome.18, 47, 48 As such, we compared microbiome populations between groups at one time point which is 6 month after the obesity induction. This might weaken our conclusions addressing associations between microbiome shifts and obesity. Also, a microbiome comparison after the obese group recovers their lean body weights will be necessary to exclusively explain the functions of certain microbial populations in obesity.
In conclusion, the CSF‐5HT levels were lower in the obese group compared to the lean group. Members of the phylum Proteobacteria, which belongs to gram‐negative bacteria, were abundant in the obese group. It is not known whether dysbiosis induces the development of obesity or whether obesity causes the dysbiosis of gut microbiota. Further studies are required to elucidate the roles of the gut microbiota in the development of obesity.
Acknowledgment
This research was supported by the National Research Foundation of Korea (NRF) Grant funded by the Korean Government (MOE) (NRF‐2012R1A1A2041697).
Conflict of Interest Declaration: The Authors disclose no conflict of interest.
Off‐label Antimicrobial Declaration: The authors declare no off‐label use of antimicrobials.
This research was presented as a poster presentation at the 2014 ACVIM Forum, Nashville, TN.
Footnotes
Adult small dog; Royal Canin Ltd, Aimargues France, Cesar; Mars Ltd, WODONGA VIC, Australia
Canine Leptin ELISA; Millipore, Billerica, MA
Canine adiponectin ELISA; Millipore, Billerica, MA
Immulite 1000 immunoassay analyzer; Siemens Medical Diagnostics, Los Angeles, CA
Serotonin EIA Kit; Enzo Life Science, Ann Arbor, MI
MS9‐5V v1.5.5; Melet Schloesing Laboratories, France
AccuPrep Stool DNA Extraction Kit; Bioneer Inc, Daejeon, Korea
FastStart High Fidelity PCR System; Roche Applied Science, Mannhelm, Germany
AMPure beads; Beckman Coulter, Brea, CA
Victor 3; PerkinElmer, Santa Clara, CA
Genome Sequencer FLX plus; 454 Life Sciences, Branford, CT
PicoTiter plate; 454 Life Sciences, Branford, CT
Macrogen Inc., Seoul, Korea
Mothur software (version 1.31.0). http://www.mothur.org.
FigTree (version 1.4). http://mac.softpedia.com/get/Graphics/FigTree.shtml
SPSS Statistics 20.0.0; SPSS Inc.,Chicago, IL
References
- 1. Toll P, Yamka RM, Schoenherr WD, Hand MS. Obeisty In: Thatcher CD, Remillard RL, Roudebush P, Norvotny BJ, eds. Small Animal Clinical Nutrition, 5th ed Topeka: Mark Morris Institute; 2010:502–542. [Google Scholar]
- 2. Alenza MDP, Pena L, del Castillo N, et al. Factors influencing the incidence and prognosis of canine mammary tumours. J Small Anim Pract 2000;41:287–291. [DOI] [PubMed] [Google Scholar]
- 3. Kanchuk ML, Backus RC, Calvert CC, et al. Weight gain in gonadectomized normal and lipoprotein lipase‐deficient male domestic cats results from increased food intake and not decreased energy expenditure. J Nutr 2003;133:1866–1874. [DOI] [PubMed] [Google Scholar]
- 4. Cao H. Adipocytokines in obesity and metabolic disease. J Endocrinol 2014;220:47–59. [DOI] [PMC free article] [PubMed] [Google Scholar]
- 5. Duffy ME, Stewart‐Knox BJ, McConville C, et al. The relationship between whole‐blood serotonin and subjective mood in apparently healthy postmenopausal women. Biol Psychol 2006;73:165–168. [DOI] [PubMed] [Google Scholar]
- 6. Hodge SBB, Carr E, Strain JJ, et al. Obesity, whole blood serotonin and sex differences in healthy volunteers. Obes Facts 2012;5:399–407. [DOI] [PubMed] [Google Scholar]
- 7. Stunes AK, Reseland JE, Hauso O, et al. Adipocytes express a functional system for serotonin synthesis, reuptake and receptor activation. Diabetes Obes Metab 2011;13:551–558. [DOI] [PubMed] [Google Scholar]
- 8. Ley RE, Backhed F, Turnbaugh P, et al. Obesity alters gut microbial ecology. Proc Natl Acad Sci USA 2005;102:11070–11075. [DOI] [PMC free article] [PubMed] [Google Scholar]
- 9. Backhed F, Ley RE, Sonnenburg JL, et al. Host‐bacterial mutualism in the human intestine. Science 2005;307:1915–1920. [DOI] [PubMed] [Google Scholar]
- 10. Jones MP, Dilley JB, Drossman D, et al. Brain‐gut connections in functional GI disorders: Anatomic and physiologic relationships. Neurogastroent Motil 2006;18:91–103. [DOI] [PubMed] [Google Scholar]
- 11. Tehrani AB, Nezami BG, Gewirtz A, et al. Obesity and its associated disease: A role for microbiota? Neurogastroent Motil 2012;24:305–311. [DOI] [PMC free article] [PubMed] [Google Scholar]
- 12. Schwartz GJ. The role of gastrointestinal vagal afferents in the control of food intake: Current prospects. Nutrition 2000;16:866–873. [DOI] [PubMed] [Google Scholar]
- 13. Diaz Heijtz R, Wang S, Anuar F, et al. Normal gut microbiota modulates brain development and behavior. Proc Natl Acad Sci USA 2011;108:3047–3052. [DOI] [PMC free article] [PubMed] [Google Scholar]
- 14. de Lartigue G, de La Serre CB, Raybould HE. Vagal afferent neurons in high fat diet‐induced obesity; intestinal microflora, gut inflammation and cholecystokinin. Physiol Behav 2011;105:100–105. [DOI] [PMC free article] [PubMed] [Google Scholar]
- 15. Eckburg PB, Bik EM, Bernstein CN, et al. Diversity of the human intestinal microbial flora. Science 2005;308:1635–1638. [DOI] [PMC free article] [PubMed] [Google Scholar]
- 16. Giongo A, Gano KA, Crabb DB, et al. Toward defining the autoimmune microbiome for type 1 diabetes. ISME J 2011;5:82–91. [DOI] [PMC free article] [PubMed] [Google Scholar]
- 17. Frank DN, St Amand AL, Feldman RA, et al. Molecular‐phylogenetic characterization of microbial community imbalances in human inflammatory bowel diseases. Proc Natl Acad Sci USA 2007;104:13780–13785. [DOI] [PMC free article] [PubMed] [Google Scholar]
- 18. Handl S, German AJ, Holden SL, et al. Faecal microbiota in lean and obese dogs. FEMS Microbiol Ecol 2013;84:332–343. [DOI] [PubMed] [Google Scholar]
- 19. Sturgeon A, Stull JW, Costa MC, et al. Metagenomic analysis of the canine oral cavity as revealed by high‐throughput pyrosequencing of the 16S rRNA gene. Vet Microbiol 2013;162:891–898. [DOI] [PubMed] [Google Scholar]
- 20. Suchodolski JS. Intestinal microbiota of dogs and cats: A bigger world than we though. Vet Clin North Am Small Anim Pract 2011;41:261–272. [DOI] [PMC free article] [PubMed] [Google Scholar]
- 21. Dicksved J, Halfvarson J, Rosenquist M, et al. Molecular analysis of the gut microbiota of identical twins with Crohn's disease. ISME J 2008;2:716–727. [DOI] [PubMed] [Google Scholar]
- 22. Roesch LF, Lorca GL, Casella G, et al. Culture‐independent identification of gut bacteria correlated with the onset of diabetes in a rat model. ISME J 2009;3:536–548. [DOI] [PMC free article] [PubMed] [Google Scholar]
- 23. Fu L, Niu B, Zhu Z, et al. CD‐HIT: Accelerated for clustering the next‐generation sequencing data. Bioinformatics 2012;28:3150–3152. [DOI] [PMC free article] [PubMed] [Google Scholar]
- 24. Schloss PD, Westcott SL, Ryabin T, et al. Introducing mothur: Open‐source, platform‐independent, community‐supported software for describing and comparing microbial communities. Appl Environ Microbiol 2009;75:7537–7541. [DOI] [PMC free article] [PubMed] [Google Scholar]
- 25. Tuomisto H. A diversity of beta diversities: Straightening up a concept gone awry. Part 2. Quantifying beta diversity and related phenomena. Ecography 2010;33:23–45. [Google Scholar]
- 26. Jost L. Entropy and diversity. Oikos 2006;113:363–375. [Google Scholar]
- 27. Altschul SF, Madden TL, Schaffer AA, et al. Gapped BLAST and PSI‐BLAST: A new generation of protein database search programs. Nucl Acids Res 1997;25:3389–3402. [DOI] [PMC free article] [PubMed] [Google Scholar]
- 28. Quast C, Pruesse E, Yilmaz P, et al. The SILVA ribosomal RNA gene database project: Improved data processing and web‐based tools. Nucl Acids Res 2013;41:D590–D596. [DOI] [PMC free article] [PubMed] [Google Scholar]
- 29. Pollard DA, Bergman CM, Stoye J, et al. Benchmarking tools for the alignment of functional noncoding DNA. BMC Bioinformatics 2004;5:6. [DOI] [PMC free article] [PubMed] [Google Scholar]
- 30. Brown CT, Davis‐Richardson AG, Giongo A, et al. Gut microbiome metagenomics analysis suggests a functional model for the development of autoimmunity for type 1 diabetes. PLoS One 2011;6:e25792. [DOI] [PMC free article] [PubMed] [Google Scholar]
- 31. Radin MJ, Sharkey LC, Holycross BJ. Adipokines: A review of biological and analytical principles and an update in dogs, cats, and horses. Vet Clin Pathol 2009;38:136–156. [DOI] [PubMed] [Google Scholar]
- 32. Markianos MEM, Koutsis G, Sfagos C. Elevated CSF serotonin and dopamine metabolite levels in overweight subjects. Obesity (Silver Spring) 2012;21:1139–1142. [DOI] [PubMed] [Google Scholar]
- 33. Lambert GVVM, Cox HS. Human obesity is associated with a chronic elevation in brain 5‐hydroxytryptamine tunover. Clin Sci (Lond) 1999;96:191–197. [DOI] [PubMed] [Google Scholar]
- 34. Homnick DN, Homnick BD, Reeves AJ, et al. Cyproheptadine is an effective appetite stimulant in cystic fibrosis. Pediatr Pulmonol 2004;38:129–134. [DOI] [PubMed] [Google Scholar]
- 35. Turnbaugh PJ, Ley RE, Mahowald MA, et al. An obesity‐associated gut microbiome with increased capacity for energy harvest. Nature 2006;444:1027–1031. [DOI] [PubMed] [Google Scholar]
- 36. Schwiertz A, Taras D, Schafer K, et al. Microbiota and SCFA in lean and overweight healthy subjects. Obesity (Silver Spring) 2010;18:190–195. [DOI] [PubMed] [Google Scholar]
- 37. Balamurugan R, George G, Kabeerdoss J, et al. Quantitative differences in intestinal Faecalibacterium prausnitzii in obese Indian children. Br J Nutr 2010;103:335–338. [DOI] [PubMed] [Google Scholar]
- 38. Zhang HS, DiBaise JK, Zuccolo A, et al. Human gut microbiota in obesity and after gastric bypass. Proc Natl Acad Sci USA 2009;106:2365–2370. [DOI] [PMC free article] [PubMed] [Google Scholar]
- 39. McKenna P, Hoffmann C, Minkah N, et al. The macaque gut microbiome in health, lentiviral infection, and chronic enterocolitis. PLoS Pathog 2008;4:e20. [DOI] [PMC free article] [PubMed] [Google Scholar]
- 40. Simpson JM, Martineau B, Jones WE, et al. Characterization of fecal bacterial populations in canines: Effects of age, breed and dietary fiber. Microb Ecol 2002;44:186–197. [DOI] [PubMed] [Google Scholar]
- 41. Turnbaugh PJ, Hamady M, Yatsunenko T, et al. A core gut microbiome in obese and lean twins. Nature 2009;457:480–484. [DOI] [PMC free article] [PubMed] [Google Scholar]
- 42. Cani PD, Amar J, Iglesias MA, et al. Metabolic endotoxemia initiates obesity and insulin resistance. Diabetes 2007;56:1761–1772. [DOI] [PubMed] [Google Scholar]
- 43. Bertrand RL, Senadheera S, Tanoto A, et al. Serotonin availability in rat colon is reduced during a Western diet model of obesity. Am J Physiol Gastrointest Liver Physiol 2012;303:G424–G434. [DOI] [PubMed] [Google Scholar]
- 44. Wynne K, Stanley S, McGowan B, et al. Appetite control. J Endocrinol 2005;184:291–318. [DOI] [PubMed] [Google Scholar]
- 45. Maslowski KM, Vieira AT, Ng A, et al. Regulation of inflammatory responses by gut microbiota and chemoattractant receptor GPR43. Nature 2009;461:1282–1286. [DOI] [PMC free article] [PubMed] [Google Scholar]
- 46. Hildebrandt MA, Hoffmann C, Sherrill‐Mix SA, et al. High‐fat diet determines the composition of the murine gut microbiome independently of obesity. Gastroenterology 2009;137:1716–1724. [DOI] [PMC free article] [PubMed] [Google Scholar]
- 47. Gnanandarajah JS, Johnson TJ, Kim HB, et al. Comparative faecal microbiota of dogs with and without calcium oxalate stones. J Appl Microbiol 2012;113:746–755. [DOI] [PubMed] [Google Scholar]
- 48. Caricilli AM, Picardi PK, de Abreu LL, et al. Gut microbiota is a key modulator of insulin resistance in TLR 2 knockout mice. PLoS Biol 2011;9:e1001212. [DOI] [PMC free article] [PubMed] [Google Scholar] [Retracted]