

Abstract
Background
It is unknown if diabetic cats in remission have persistent abnormalities of glucose metabolism and should be considered prediabetic, or have normal glucose tolerance.
Objective
To characterize glycemic status of diabetic cats in remission and to determine predictors of relapse.
Animals
A total of 21 cats in diabetic remission and 28 healthy control cats.
Methods
At a median of 107 days after remission, screening blood glucose concentration was measured on entry to the clinic. After a 24‐hour fast in hospital, fasting blood glucose, fructosamine and feline pancreatic lipase concentrations were measured, and 3 hours later, a simplified IV glucose tolerance test (1 g glucose/kg) performed. Twenty cats were monitored for relapse for at least 9 months.
Results
Of the 21 cats in remission, 19% (4/21) had impaired fasting glucose concentration and 76% (16/21) had impaired glucose tolerance. Of cats followed up for 9 months after testing, 30% (6/20) had relapsed and required insulin treatment. Fasting blood glucose concentration ≥7.5 mmol/L (≥135 mg/dL) (odds ratio [OR] = 12.8) and severely impaired glucose tolerance (≥5 hours to return to <6.5 mmol/L or <117 mg/dL; OR = 15.2) were significantly associated with relapse. Blood glucose concentration >14 mmol/L; 252 mg/dL at 3 hours was significantly associated with relapse (OR = 10.1).
Conclusion and Clinical Importance
Most cats in diabetic remission have impaired glucose tolerance and a minority have impaired fasting glucose concentration and should be considered prediabetic. More severe glucose intolerance and impaired fasting glucose concentration are predictors of relapse. Ongoing glucose monitoring of diabetic cats in remission is recommended.
Keywords: Diabetes mellitus, Glucose tolerance test, Impaired fasting glucose concentration, Impaired glucose tolerance, Prediabetic, Screening glucose
Abbreviations
- fPLi
feline pancreatic lipase
After weeks or months of treatment, many insulin‐treated diabetic cats maintain euglycemia without exogenous insulin or oral hypoglycemic agents and are said to be in diabetic remission.1 Diabetic remission is hypothesized to occur when pancreatic β cells recover from the suppressive effects of hyperglycemia and are able to secrete sufficient insulin to maintain euglycemia.2, 3, 4 The probability of diabetic remission is likely increased with institution of early, effective glycemic control, and remission rates >80% are reported in newly diagnosed diabetic cats managed using long‐acting insulin1 and low carbohydrate diets.5, 6
Approximately, 25–30% of cats in remission are reported to subsequently relapse and require further insulin treatment to control blood glucose concentrations.5, 7 Factors predisposing to diabetic relapse are currently unknown, and it is unclear if the majority of cats in remission have persistent abnormalities of glucose metabolism or have normal glucose tolerance. Human patients with impaired glucose tolerance or impaired fasting glucose concentration (blood glucose concentration above normal but below diabetic range, resulting from an inability to maintain normal blood glucose concentration) are classified as prediabetic and are at greatly increased risk of becoming diabetic.8 Structured lifestyle intervention, aimed at increasing physical activity and producing 5–10% loss of body weight, and certain pharmacological agents, prevent or delay the development of diabetes in people with impaired glucose tolerance.8 Knowledge of the glucose tolerance status of cats in remission may be important to guide treatment to decrease or delay diabetic relapse, and for predicting relapse.
The aims of this study were to describe the glycemic status of diabetic cats in remission using fasting blood glucose concentrations and glucose tolerance testing, and to assess potential predictors of relapse.
Materials and Methods
Study Design
This retrospective and prospective cohort study involved client‐owned diabetic cats in remission presented to a feline practice (The Cat Clinic, Paddington and Mt Gravatt, Qld, Australia; remission cats), and clinically healthy client‐owned cats presented to the feline practice or the University of Queensland Veterinary Teaching Hospital (control cats). Previously insulin‐treated diabetic cats in remission were retrospectively identified from practice records or were recruited prospectively. At the time of initial diagnosis of diabetes, all cats had consistent clinical signs, marked hyperglycemia (>20 mmol/L; >360 mg/dL), and glucosuria. While diabetic, all cats were treated with insulin glargine, and the majority were fed a low‐carbohydrate diet. A published protocol for insulin adjustment was used for 18 cats, and the adjustment protocol was unknown in 3 cats.1 Diabetic cats in remission were enrolled in the study based on: (1) confirmation of at least 1 blood glucose concentration ≤6.5 mmol//L (≤117 mg/dL) measured a minimum of 2 weeks after insulin administration was discontinued; and (2) absence of clinical signs of diabetes before glucose tolerance testing. Clinical signs were monitored by the owner and discussed with the veterinarian on admission to the study. Remission date was defined as 14 days after the date that insulin administration was discontinued. Only cats of good temperament were enrolled; this requirement was necessary to minimize the effects of stress caused by handling on blood glucose concentrations.
After enrollment in the study, remission cats were admitted to the clinic hospital for 48 hours for baseline testing, including blood glucose measurements before and after fasting and a glucose tolerance test. Body weight and body condition score (BCS; scale of 1–9) were recorded, and urinalysis and hematology performed. Total thyroxine (T4), serum biochemistry, serum fructosamine concentration, and feline pancreatic lipase immunoreactivity (fPLI in 15 of the 21 cats) were measured by an external laboratory.1
Blood glucose concentration was measured using a portable glucometer2 calibrated for feline blood from samples obtained from the ear (first preference), paw pad, or jugular vein, depending on the cat's temperament. Coefficient of variation (CV) for the meter was determined using blood from a healthy cat and was 1.8% for interassay variation (3 meters, 20 times) and 2.2% for intra‐assay variation (20 replications). CVs provided by the manufacturer ranged from 2.09 to 2.27% for blood glucose concentrations in the low, normal, and high range (average values, 62–633 mg/dL).
Blood glucose concentration was measured on entry to the clinic and before food was withheld (defined as screening blood glucose concentration), and the upper limit of normal used (9.2 mmol or <166 mg/dL) was based on reference intervals from our laboratory, derived from 49 ideal weight cats.3 For all study cats, after overnight hospitalization and withholding food for 24 hours, a 22G catheter was placed in a cephalic vein and irrigated with heparinized saline. Three hours were allowed to elapse to facilitate resolution of stress hyperglycemia before measurement of fasting glucose concentration and beginning the glucose tolerance test.9 Impaired fasting blood glucose was defined as a fasting glucose concentration >6.5 mmol/L (117 mg/dL), based on reference intervals derived from 26 ideal weight cats with normal glucose tolerance tests4 and <11 mmol/L (<198 mg/dL) based on the literature.10 Concentrations ≥ 11 mmol/L (198 mg/dL) were classed as diabetic.10 A bolus of 50% glucose (wt/vol) then was administered IV at 1 g/kg over 1‐minute via the cephalic catheter. Blood glucose concentration was measured at 2 hours after glucose administration, and then hourly until blood glucose concentration was ≤6.5 mmol/L (≤117 mg/dL) or until 9 hours after the test start, whichever occurred first. After testing, cats were offered a meal of their regular food and discharged.
After initial testing, cats were evaluated for relapse by monitoring blood glucose concentration (either by home monitoring or during health checks at the clinic) and clinical signs. Relapse was diagnosed when clinical signs consistent with diabetes were reported by the owner (eg, polyuria and polydipsia), and blood glucose concentration was documented to be persistently >11 mmol/L and associated with glycosuria.
Because distributions and reference intervals were not available for predominantly geriatric healthy cats for many variables, corresponding data, including glucose tolerance test data, were collected from 28 clinically healthy control cats enrolled in this study and another study, and control cats were frequency‐matched with the diabetic cats based on age and body condition score. Control cats were selected from clients of the same veterinary practice or from cat owners recruited through the university, and were deemed clinically healthy based on history, physical examination findings, CBC, serum biochemistry, serum total thyroxine concentration, and urinalysis. Ethical approval was obtained from the University of Queensland Animal Ethics Committee, and all clients signed a consent form before their cats were enrolled in the study.
Statistical Analyses
Blood glucose and fructosamine concentrations were compared between remission and control cats using the t‐test for unequal variances performed using the t‐test command in Stata.5 Normality of residuals was assessed by plotting the distributions of these after fitting group (ie, remission or control) with linear regression using the regress command in Stata.5 For the 4 variables compared, distributions were approximately normally distributed. Times to relapse also were compared between cats with low or high fasting glucose concentrations using only cats that had relapsed.
The abilities of dichotomous variables to predict relapse by 9 months (270 days) after baseline testing were assessed using exact logistic regression, with the exlogistic command in Stata.5 Nine months was chosen because only 1 nonrelapsing cat was monitored for <270 days and, at the time analyses were performed, all relapsed cats had relapsed before 270 days. The 1 nonrelapsing cat that was monitored for relapse for <270 days was excluded from these analyses. Probabilities of relapse and associated confidence intervals were calculated using the mid‐p rule. Where no or all cats in an exposure category relapsed, odds ratios were calculated as median unbiased estimates without the mid‐p rule. Predicted probabilities of cats relapsing were calculated with associated exact confidence intervals.
Sensitivities of dichotomous variables for predicting relapse by 9 months after baseline testing were calculated as the proportions of relapsed cats that had values above the cut‐point (defined as concentrations above which cats are considered abnormal), specificities were calculated as the proportions of nonrelapsed cats that had values at or below the cut‐point, positive predictive values were calculated as the proportions of cats with values above the cut‐point that relapsed, and negative predictive values were calculated as the proportions of cats with values at or below the cut‐point that did not relapse. Assuming sensitivities and specificities do not vary with prevalence of relapse, positive, and negative predictive values would vary from these in populations in which the prevalence of relapse differed from that in this study's population.
Univariable analyses also were performed using survival analyses with all cats; all nonrelapsing cats were included and right‐censored at the last time they were monitored. Log‐rank tests were performed using the sts test command in Stata.5 These were relatively complex models given the limited dataset, and did not provide exact P‐values. Because the P‐values for all univariable associations were broadly similar to those obtained from the simpler logistic regression models, these were not reported.
Because cut‐points were not available a priori for some variables, upper limits of 95% reference intervals were used as cut‐points for these. Reference intervals were calculated with data from the 28 clinically healthy control cats. These reference intervals were generated using Reference Interval Draft Version.6 Data were transformed to approximate a normal distribution using the Box‐Cox transformation. Using the transformed data, observations >1.5 times the interquartile range below the 25th percentile and observations >1.5 times the interquartile range above the 75th percentile were considered to be outliers and omitted from further calculations.11, 12 For the lower limit of the reference interval, the spreadsheet used a transformed robust approach.12, 13 The upper limit was calculated in the same way after “flipping” all untransformed values ≥ the median around the median. Associated 90% confidence intervals for the upper and lower limits of the reference intervals were estimated using bootstrapping with 1,000 replications.12
Additional higher cut‐points were assessed post hoc after examination of data, with cut‐points selected to ensure at least modest numbers of cats above the cut‐point. The abilities of various combinations of 2, 3, and 4 predictors to predict relapse by 9 months (270 days) after baseline testing also were assessed.
Results
The diabetic cats (n = 21; 8 female, 13 male; all neutered) had been in remission for a median of 107 days (range, 10 days [ie, off insulin 24 days] to 4 years) at the time of baseline testing. This was the first diabetic remission for all cats. Median age at glucose tolerance testing was 12 years (range, 5–17 years) and median body condition score on a 9‐point scale was 5 (range, 5–7). Feline breeds were Domestic Short Hair (n = 9), Burmese (n = 8), Siamese (n = 2), Australian Mist (n = 1), and Russian‐cross (n = 1). At the time of diagnosis of diabetes, 2 cats had documented pancreatitis (fPLI was available for 15/21 cats), and 5 cats had a recent history of corticosteroid administration. No cats presented with diabetic ketoacidosis at the time of diagnosis.
Matched control cats (n = 28) had a median age of 10 years (range, 5–18 years), median body condition score of 5 (range, 4–8), and were Domestic Short Hair (n = 19), Burmese (n = 5), Siamese (n = 1), Oriental (n = 1), Abyssinian (n = 1), and Tonkinese (n = 1).
Fasting and Screening Blood Glucose Concentration and Glucose Tolerance
Fasting glucose concentrations in all control cats were <6.5 mmol/L (117 mg/dL; Table 1). Mean fasting glucose concentration for the diabetic cats in remission was significantly higher (P = .002), and only 81% (17/21) had concentrations of ≤6.5 mmol/L (117 mg/dL; Table 1). The remaining 4 cats (19%) had fasting glucose concentrations of 6.6, 7.5, 7.8, and 8.4 mmol/L (119, 135, 140, and 151 mg/dL); all of these concentrations were below that required for classification of cats as diabetic (11 mmol/L; 198 mg/dL)10; and these cats were arbitrarily classified post hoc as having mildly (n = 1, glucose 6.5 to <7.5 mmol/L; 117 to <135 mg/dL) to moderately (n = 3; glucose ≥7.5 to 8.4 mmol/L; ≥135 to 151 mg/dL) impaired fasting glucose concentration.
Table 1.
Means, SD, and ranges of blood glucose variables between healthy, age, and body condition score‐matched control (28a) cats and remission (21) cats
| Control Cats | Remission Cats | P‐Value | 95% Reference Interval | ||||
|---|---|---|---|---|---|---|---|
| Mean ± SD | Range | Mean ± SD | Range | Lower Limit (90% CIa) | Upper Limit (90% CI) | ||
| Fasting blood glucose | 4.6 ± 0.9 mmol/L (83 ± 16 mg/dL) | 2.8–6.1 mmol/L (50–110 mg/dL) | 5.7 ± 1.2 mmol/L (103 ± 22 mg/dL) | 3.7–8.4 mmol/L (67–151 mg/dL) | .002 | 2.3 (1.7–2.8) mmol/L [41 (30–50) mg/dL] | 6.3 (5.9–6.6) mmol/L [113 (107–118) mg/dL] |
| Screening blood glucose | 4.9 ± 0.9 mmol/L (88 ± 16 mg/dL) | 2.5–6.0 mmol/L (45–108 mg/dL) | 6.4 ± 1.8 mmol/L (115 ± 33 mg/dL) | 3.2–9.7 mmol/L (58–175 mg/dL) | .002 | 1.5 (0.0–2.8) mmol/L [27 (0–50) mg/dL] | 6.4 (6.1–6.6) mmol/L [115 (110–118) mg/dL] |
| 2 hours blood glucose | 8.6 ± 3.2 mmol/L (155 ± 58 mg/dL) | 3.2–16.3 mmol/L (58–290 mg/dL) | 19.4 mmol/L ± 5.2 (349 ± 94 mg/dL) | 7.6–25.9 mmol/L (136–466 mg/dL) | <.001 | 3.3 (2.5–4.4) mmol/L [59 (45–79) mg/dL] | 16.4 (14.4–18.2) mmol/L [296 (258–327) mg/dL] |
| Fructosamineb | 246 ± 33 μmol/L | 190–305 μmol/L | 272 ± 42 μmol/L | 197–347 μmol/L | .028 | 178 (164–190) μmol/L | 321 (303–334) μmol/L |
CI = confidence interval.
Fructosamine was measured in 24 of the 28 cats.
Screening blood glucose concentration, measured in the consulting room after travel to the clinic, and any time interval after eating, were significantly higher (P = .002) for cats in remission compared to control cats (Table 1).
Glucose concentrations of all control cats during glucose tolerance testing were ≤6.5 mmol/L (117 mg/dL) within 3 hours of glucose administration, indicating normal glucose tolerance, and 36% (10/28) of these cats reached this concentration by 2 hours. In contrast, only 24% (5/21) of the diabetic cats in remission had glucose concentrations ≤6.5 mmol/L (117 mg/dL) within 3 hours (Fig 1), indicating that 76% (16/21) of the diabetic cats in remission had impaired glucose tolerance. Glucose concentrations at 2 hours were significantly higher (P < .001) for cats in remission cats compared to control cats (Table 1).
Figure 1.
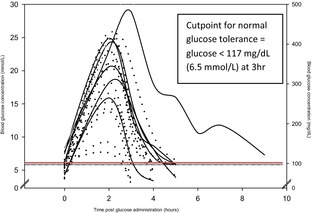
Blood glucose concentrations after a glucose challenge (1 g/kg i.v.) in 21 cats in diabetic remission. Most of these cats (16/21; 76%) had impaired glucose tolerance (glucose concentration >117 mg/dL [6.5 mmol/L] at 3 hours). Solid line = relapsed, dots = did not relapse.
Of the 16 cats in remission with impaired glucose tolerance, a glucose concentration of ≤6.5 mmol/L (117 mg/dL) was first observed at 4 hours in 8 cats and 5 hours in 7 cats. The glucose concentration in the remaining cat was 7.3 mmol/L (131 mg/dL) 9 hours after glucose administration; the fasting glucose concentration of this cat was 7.8 mmol/L (140 mg/dL). All 4 diabetic cats in remission that had impaired fasting glucose concentration (>6.5 mmol/L; >117 mg/dL) also had mildly (4 hours, n = 1), moderately (5 hours, n = 2), or severely (≥6 hours, n = 1) impaired glucose tolerance. Although the majority of cats in remission had impaired glucose tolerance, administration of 1 g/kg glucose IV did not cause persistent exacerbation of hyperglycemia. Blood glucose concentration was measured until a concentration ≤6.5 mmol/L (≤117 mg/dL) was achieved or until 9 hours after the start of the test, and the last measured glucose concentration was lower than the fasting concentration in the majority of cats (19/28 control cats and 16/21 remission cats).
Glucose Variables as Predictors of Relapse
Twenty of the 21 diabetic cats in remission were monitored for relapse for at least 9 months (270 days) after baseline testing; of these, 6 (30%) relapsed and required insulin. One cat died of other causes without relapse 253 days after testing and was excluded from analysis of potential predictors of relapse by 9 months after testing. For the 6 cats that relapsed, the median time from remission to relapse was 139 days (range, 71–515 days) and the median time from baseline testing to relapse was 81 days (range, 50–257 days). The remaining 14 cats were monitored for relapse from baseline testing for a median of 614 days (range, 253–1,079 days). Median time from remission to baseline testing for relapsing cats was 48 days (range, 12–258 days) and for nonrelapsing cats was 179 days (range, 10–1,469 days).
There was evidence that fasting glucose concentration was predictive of relapse (P = .064 and .018 for cut‐points 6.5 [117 mg/dL] and 7.5 mmol/L [135 mg/dL], respectively; Table 2). Estimated probabilities of relapse were 0.79 (95% CI, 0.29–1.00) and 0.18 (95% CI, 0.04–0.43) for cats ≥ and <7.5 mmol/L (135 mg/dL), respectively. Among the 6 cats that relapsed, times to relapse did not differ significantly between those with fasting blood glucose ≥7.5 mmol/L (135 mg/dL; n = 3; median, 58 days; range, 50–103 days) and those with lower fasting glucose concentrations (n = 3; median, 230 days; range, 58–257 days; P = .211).
Table 2.
Unadjusted (ie, univariable) odds ratios for potential predictors of relapse by 9 months after baseline testing in diabetic cats in remission (n = 20, of which 6 cats relapsed)
| Potential Predictor and Cut‐point | Basis for Cut‐point | No. Cats | % (no.) that Relapsed | Odds Ratioa (95% CI) | P‐Value |
|---|---|---|---|---|---|
| Fasting glucose | |||||
| >6.5 mmol/L | Reeve‐Johnson, unpublished | 4 | 75% (3) | 10.9 (0.9–364.4) | .064 |
| ≤6.5 mmol/L | 16 | 19% (3) | Reference category | ||
| Fasting glucose | |||||
| ≥7.5 mmol/Lb | Higher cut‐point selected post hoc | 3 | 100% (3) | 12.8 (1.7 to infinity) | .018 |
| <7.5 mmol/L | 17 | 18% (3) | Reference category | ||
| Screening blood glucose | |||||
| >6.5 mmol/L | Upper limit of reference interval | 9 | 33% (3) | 1.3 (0.2–10.3) | .791 |
| ≤6.5 mmol/L | 11 | 27 (3) | Reference category | ||
| Screening blood glucose | |||||
| >9.2 mmol/L | Reeve‐Johnson, unpublished | 2 | 50% (1) | 2.5 (0.1–108.6) | .600 |
| ≤9.2 mmol/L | 18 | 28% (5) | Reference category | ||
| 2‐h glucose | |||||
| >16.4 mmol/L | Upper limit of reference interval | 14 | 36% (5) | 2.7 (0.3–78.5) | .465 |
| ≤16.4 mmol/L | 6 | 17% (1) | Reference category | ||
| 2‐h glucose | |||||
| >18.0 | Higher cut‐point selected post hoc | 13 | 38% (5) | 3.5 (0.4–103.1) | .321 |
| ≤18.0 | 7 | 14% (1) | Reference category | ||
| 3‐h glucosec | |||||
| >7.3 mmol/L | Upper limit of reference interval | 13 | 38% (5) | 3.5 (0.4–103.1) | .321 |
| ≤7.3 mmol/L | 7 | 14% (1) | Reference category | ||
| 3‐h glucosec | |||||
| >14.0 mmol/L | Higher cut‐point selected post hoc | 6 | 67% (4) | 10.1 (1.1–130.9) | .040 |
| ≤14.0 mmol/L | 14 | 14% (2) | Reference category | ||
| Time until glucose ≤6.5 mmol/Ld | |||||
| >3 hours | Cut‐point established from control cats | 15 | 40% (6) | 3.8 (0.6–infinity) | .129 |
| ≤3 hours | 5 | 0% (0) | Reference category | ||
| Time until glucose ≤6.5 mmol/Ld | |||||
| ≥5 hourse | Higher cut‐point selected post hoc | 8 | 63% (5) | 15.2 (1.5–469.8) | .019 |
| <5 hours | 12 | 8% (1) | Reference category | ||
| Fructosamine | |||||
| >321 μmol/L | Upper limit of reference interval | 4 | 50% (2) | 2.8 (0.2–35.2) | .404 |
| ≤321 mmol/L | 16 | 25% (4) | Reference category | ||
| Concurrent diseasef | |||||
| Present | 8 | 38% (3) | 1.7 (0.2–14.0) | .592 | |
| Absent | 12 | 25% (3) | Reference category | ||
| Corticosteroids | |||||
| Treated | 2 | 100% (2) | 6.5 (0.7 to infinity) | .079 | |
| Not‐treated | 18 | 22% (4) | Reference category | ||
| fPLIg | |||||
| >4.45 μg/L | Upper limit of reference interval | 5 | 40% (2) | 2.2 (0.2–30.5) | .550 |
| ≤4.45 μg/L | 9 | 22% (2) | Reference category | ||
| fPLIg | |||||
| >5.4 μg/L | Higher cut‐point selected post hoc | 3 | 33% (1) | 1.3 (0.0–23.5) | .846 |
| ≤5.4 μg/L | 11 | 27% (3) | Reference category | ||
| Age at diabetes diagnosis | |||||
| >11 years | Cut‐point selected post hoc | 9 | 33% (3) | 1.3 (0.2–10.3) | .791 |
| ≤11 years | 11 | 27% (3) | Reference category | ||
| Age at remission | |||||
| >12 years | Cut‐point selected post hoc | 9 | 33% (3) | 1.3 (0.2–10.3) | .791 |
| ≤12 years | 11 | 27% (3) | Reference category | ||
| Age at baseline testing | |||||
| >12 years | Cut‐point selected post hoc | 9 | 22% (2) | 0.5 (0.1–3.9) | .545 |
| ≤12 years | 11 | 36% (4) | Reference category | ||
Unadjusted (ie, univariable) odds ratio for relapse, relative to cats not exposed to the potential predictor. For example, the estimated odds of relapse were 10.9 times higher in cats with fasting glucose concentration >6.5 mmol/L relative to cats with lower fasting glucose concentrations.
For fasting glucose of ≥7.5 mmol/L (≥135 mg/dL), sensitivity for relapse was 50% (3/6), specificity 100% (14/14), positive predictive value 100% (3/3), and negative predictive value 82% (14/17).
Glucose concentration at 3 hours was assumed to be 6.5 mmol/L or less if the 2 hours concentration was 6.5 mmol/L or less.
Time from glucose administration until blood glucose concentration ≤117 mg/dL (≤6.5 mmol/L) was observed.
For 5 hours or more return to <6.5 mmol/L (<117 mg/dL) in a glucose tolerance test, sensitivity for relapse was 83% (5/6), specificity 79% (11/14), positive predictive value 63% (5/8), and negative predictive value 92% (11/12).
Concurrent disease at baseline testing; 4 cats had renal disease (one of which also had hyperthyroidism), 2 cats had asthma, 1 cat had vomiting and weight loss, and 1 cat had lymphosarcoma and fibrosarcoma.
Feline pancreatic lipase immunoreactivity; not measured for 6 cats, of which 2 relapsed.
Neither of the screening blood glucose concentration cut‐points assessed (>6.5 mmol/L or 117 mg/dL and >9.2 mmol/L or 166 mg/dL) was significantly predictive of relapse. Five of the 9 cats with initial screening blood glucose concentrations >6.5 mmol (117 mg/dL) were retested 3–4 hours later, and 4 had a second screening blood glucose concentration ≤6.5 mmol/L (≤117 mg/dL). Fasting blood glucose concentrations also were normal, and none relapsed. In contrast, the fifth cat's blood glucose concentration on retesting was still >6.5 mmol (117 mg/dL), its fasting blood glucose concentration also was abnormally high, and it relapsed.
Three‐hour glucose concentration >14.0 mmol/L (252 mg/dL) was predictive of relapse (P = .040). Estimated probabilities of relapse were 0.67 (95% CI, 0.22–0.96) and 0.14 (95% CI, 0.02–0.43) for cats > and ≤ to 14.0 mmol/L (252 mg/dL), respectively. Time until glucose concentration decreased to 6.5 mmol/L (117 mg/dL) was predictive of relapse (Table 2). Cats with moderate to severely impaired glucose tolerance (5 hours or more to return to ≤6.5 mmol/L or ≤117 mg/dL) had 15.2 times higher unadjusted odds of relapsing (P = .019) than cats with a shorter time to return to baseline after a glucose challenge.
The combination of fasting glucose concentration (cut‐point 7.5 mmol/L; 135 mg/dL) and 3 hours glucose concentration (cut‐point 14.0 mmol/L or 252 mg/dL) also was assessed. Odds ratios for relapse were 8.3 (95% CI, 0.9 to infinity; P = .057) for cats with fasting glucose concentration >7.5 mmol/L (135 mg/dL; odds ratio adjusted for 3 hours glucose) and 9.6 (95% CI, 0.5–378.6; P = .127) for 3 hours glucose >14 mmol/L (odds ratio adjusted for fasting glucose) compared to cats with lower glucose concentrations. Estimated probabilities of relapse were 0.88 (95% CI, 0.41–1.00) for cats with glucose concentrations > cut‐points for both variables, and 0.08 (95% CI, 0.00–0.36) for cats with blood glucose ≤ to both cut‐points. Importantly, no cat with both normal fasting glucose concentration and normal glucose tolerance (n = 5) relapsed; these 5 cats were monitored for a median of 527 days (range, 225–1,079 days) after baseline testing.
Serum Fructosamine Concentration
Serum fructosamine concentration was significantly higher in remission cats than in control cats (272 μmol/L versus 246 μmol/L; P = .028), but all remission and control cats had serum fructosamine concentrations within the reference range provided by the testing laboratory at the time of testing (<400 μmol/L), including those remission cats with increased fasting blood glucose concentration. Serum fructosamine concentration was not significantly predictive of relapse (Table 2).
Other Underlying Disease and Corticosteroid Use
Four of the 6 (66%) cats that relapsed had identifiable underlying medical causes: severe pancreatitis (fPLI > 50 μg/L) and intestinal disease, spinal disease and other concomitant diseases, infiltrative intestinal disease, and acromegaly diagnosed within 4 months of relapse. In 2 of these cats, corticosteroids were used to palliate clinical signs, and both were euthanized because of their underlying disease (spinal disease and other concomitant diseases, and infiltrative intestinal disease, respectively). Corticosteroids also had been administered shortly before initial diagnosis of diabetes in 1 of these cats. Concurrent disease (P = .706) and corticosteroid treatment (P = .079) were not significantly associated with relapse in this study. Of the 14 cats that did not relapse, 5 (36%) had identifiable underlying disease: asthma (2 cats), International Renal Interest Society (IRIS) stage II or III renal disease7 (2 cats) and IRIS stage I renal disease and hyperthyroidism (1 cat).
fPLI and Pancreatitis
Increased fPLi at the time of testing was not significantly associated with relapse (Table 1). One‐third of cats (6/18) had fPLI above the laboratory's reference range upper limit of 3.5 μg/L (median, 3.5; range 1.0–16.0), and 17% (3/18) were above the laboratory's suggested cut‐point for diagnosis of pancreatitis (5.4 μg/L). None of these cats had clinical signs suggestive of pancreatitis. Two cats in the range consistent with pancreatitis had normal fasting blood glucose concentration, and normal or impaired glucose tolerance at the time of testing.
One cat (an 11‐year‐old female spayed Siamese) with diabetes diagnosed 2 weeks after a depot corticosteroid (methylprednisolone acetate) injection for pruritus, had a clinical history and laboratory test results (fPLI > 50 μg/L) consistent with classification as “other specific type” of diabetes secondary to pancreatitis. Diabetic remission was achieved within 2 months of starting insulin treatment, and the cat had had normal results for fasting glucose concentration, glucose tolerance, and fPLI at baseline testing after 3 months in remission, and the cat did not relapse during the study.
Age
Age when diabetes was diagnosed, age when cats went into remission, and age at the time of glucose tolerance testing were not significant predictors of relapse (Table 2).
Age (≤ or > 11 years old) when diabetes was diagnosed was not a significant predictor of relapse (P = .791). The same result was obtained for age (≤ or >12 years old) when cats went into remission (P = .791). Age at baseline testing (≤ or >12 years old) also was not a significant predictor of relapse (P = .545).
Follow‐up Testing
Six cats were retested once (4 cats) or twice (2 cats) 3–6 months after their baseline testing; all had normal fasting glucose concentrations (results not shown). Glucose tolerance status improved in 1 cat, deteriorated in another cat, and remained stable in 4 cats. The cat with deteriorating glucose tolerance (return to baseline increased from 4 to 7 hours) was eventually euthanized for concomitant disease but did not relapse within 12 months after this retesting. One cat's glucose intolerance improved without weight loss or change in body condition (BCS 5/9, 4.3 kg). Diabetes initially was diagnosed after systemic corticosteroid treatment for asthma. No further steroid treatment was given, and the cat was tested 3 and 6 months after remission. After the first test, diet was changed from commercial dry food supplemented with raw meat to a veterinary prescription diet8 for diabetes. Just prior to publication, a 7th cat relapsed 31 months after initial testing (considered nonrelapsing cat in statistical analysis). On initial testing, fasting glucose concentration was normal, and glucose tolerance was mildly impaired (4 hours to return to normal, glucose concentration at 3 hours 12.2 mmol/L; 220 mg/dL).
Discussion
There are 2 important findings from this study. First, many diabetic cats in remission have impaired glucose tolerance, with or without impaired fasting glucose concentration. Second, the severity of impaired fasting glucose concentration and impaired glucose tolerance, determined by an IV glucose tolerance test, can help predict those cats at greatest risk of relapse. Of cats relapsing, those with worse impairment of fasting glucose concentration or glucose tolerance were at greater risk of relapse than those with normal or mildly impaired fasting glucose concentration or glucose intolerance. In fact, cats with fasting glucose concentrations ≥7.5 mmol/L (≥135 mg/dL) had nearly 13 times higher odds of relapsing than cats with lower fasting glucose concentrations. Similarly, cats that took ≥5 hours to return to baseline during a glucose tolerance test had 15 times higher odds of relapsing than cats that returned to baseline sooner. Cats had an 88% probability of relapsing within 9 months of testing if both fasting glucose concentration was ≥7.5 mmol/L (≥135 mg/dL) and glucose concentration at 3 hours in a glucose tolerance test (1 g/kg) was >14 mmol/L (>252 mg/dL). Conversely, no cat with both normal fasting glucose concentration and normal glucose tolerance relapsed within a median of 527 days after testing. Cats with corticosteriod administration associated with severe illness during remission had nearly 7 times higher odds of relapse. This is finding consistent with previous reports that corticosteroid administration is a risk factor for feline diabetes.6 With a future study involving a larger population of cats, it is possible that less severely impaired fasting glucose concentration or glucose in tolerance would also be associated with relapse, and these findings should not be ignored by clinicians.
Humans with impaired glucose tolerance and impaired fasting glucose concentration are considered prediabetic and are at increased risk of diabetes.8 At least 60% of patients who develop diabetes have either impaired glucose tolerance or impaired fasting glucose concentration identified in the previous 5 years. Patients with impaired glucose tolerance become diabetic at a rate of 5–10% per year, with approximately one‐third becoming diabetic within 2–5 years.8 In our study, 38% of cats with impaired glucose tolerance and 75% with impaired fasting glucose concentration relapsed within a year of testing, suggesting that diabetic cats in remission with abnormal glucose test results also should be considered prediabetic. Importantly, no cat with both normal fasting glucose concentration and normal glucose tolerance relapsed (followed up for between 17 and 37 months from the date of testing); only cats with abnormalities in fasting glucose concentration or glucose tolerance relapsed (time to relapse, 2–31 months from testing). Additional research is required to determine if glucose concentrations found to be predictors of relapse also are predictors for development of diabetes in at‐risk cats, such as aged obese or Burmese cats.
The relapse incidence of 30% in our study is consistent with previous reports of 26–29%.6, 7 Our findings suggest that serial monitoring of cats in diabetic remission is warranted to detect deterioration of glucose tolerance and impending relapse. Glucose tolerance should be evaluated 1–2 months after remission, and if normal, repeated annually. If abnormal, we recommend blood glucose concentration be monitored regularly to identify the onset of impaired fasting glucose concentration, because this finding is associated with increased probability of relapse. Future studies are warranted to determine if more intensive intervention for cats in remission with impaired glucose tolerance or impaired fasting glucose concentration is indicated. Treatments that could be investigated for delay or prevention of relapse in high‐risk cats include intermittent low‐dose insulin treatment, sensitizing drugs such as metformin or darglitazone, or Glucagon‐like Peptide‐1 agonist.
Screening Blood Glucose Concentration
Blood glucose concentration measured during a veterinary consultation rarely represents a fasting sample in cats because of their long postprandial period.14 It may also be affected by stress before or during blood sampling, and the resultant hyperglycemia can take ≥3 hours to resolve.9 The upper limit of the reference interval for screening blood glucose concentration (measured on entry to the clinic and any time after eating) in geriatric cats with ideal body condition is 9.2 mmol/L (166 mg/dL) when measured with a portable glucose meter calibrated for cat blood.3 In our cohort of cats, screening blood glucose concentration was not useful for predicting diabetic relapse, probably because of the impact on screening blood glucose concentration of eating, and of stress associated with travel and admission to the veterinary clinic. However, cats with an initial screening glucose concentration >6.5 mmol/L (118 mg/dL) that were normal when retested 3–4 hours later did not relapse. In contrast, 1 cat with a screening glucose concentration >8 mmol/L (128 mg/dL) on initial and subsequent testing, and with a similar fasting glucose concentration, relapsed within 2 months. This suggests that retesting 3–4 hours later removes some of the variability affecting screening blood glucose concentration, presumably stress, and may be more predictive of relapse. Clinicians should not dismiss increased screening blood glucose concentration as stress associated, but should retest 3–4 hours later, because based on this small cohort, 20% of cats in diabetic remission may be persistently hyperglycemic and at increased risk of relapse. The value of detecting prediabetes in cats by measuring screening blood glucose concentration and remeasuring 3–4 hours later in cats with blood glucose >6.5 mmol/L (117 mmol/L) also could be investigated in cats at risk of developing diabetes, for example obese cats >8 years of age.
Serum Fructosamine Concentration
Serum fructosamine concentration can be useful in diagnosing diabetes when a single blood glucose measurement is not definitive, particularly when the measured concentration is suspected of being affected by stress. However, up to 9% of untreated diabetic cats have false negative results,10 and in our study, serum fructosamine concentration was not useful for predicting relapse. This observation is consistent with the finding that 6 weeks of moderate hyperglycemia (mean, 17 mmol/L or 306 mg/dL) did not consistently increase serum fructosamine concentration above 400 μmol/L in healthy cats.15
Other Types of Diabetes
The majority of diabetic cats are assumed to have type 2 diabetes based on the clinical characteristics of their disease.16 Cats with different types of diabetes may have different patterns of glucose tolerance in remission, and these cats may require different management strategies to prevent diabetic relapse. For example, in this study, only 23% of cats in remission had normal glucose tolerance, and 1 of these had a history of diabetes developing at the time of acute pancreatitis combined with corticosteroid administration, suggesting that the underlying beta cell dysfunction causing diabetes was associated with pancreatitis exacerbated by corticosteroid administration. This would be classified as “other specific type” of diabetes rather than type 2 diabetes. Acromegaly was diagnosed in 1 cat after relapse, and it is unclear if diabetes in this cat should initially have been classified as “other specific type” of diabetes. A small minority of diabetic cats with acromegaly are not clinically insulin resistant17 and occasionally achieve remission (S. Neissen, personal communication). Additional research is needed to determine the importance of these underlying causes of diabetes in cats in terms of prognosis and management of cats in remission.
Limitations
The major limitation of this study was small sample size, which limited the ability of the study to detect variables associated with relapse. However, sample size calculations indicated that the number of cats required to ensure that a future study would have a high probability of detecting associations between these same variables but with more stringent cut‐points was not practical, because this would have involved recruiting between 117 and 614 cats in remission. Although there were more Burmese cats among the cats in remission than in the control group, the upper cut‐points for normal fasting glucose concentration and glucose tolerance are not different from those of non‐Burmese cats,3 and therefore Burmese cats were not excluded from the control group. Of note, if different dosages of glucose are used for the glucose tolerance test, different time and glucose concentration cut‐points would need to be established. At 1 g/kg of glucose, 2‐hour blood glucose concentration was not a useful predictor of relapse, whereas measurement at 3 hour was significantly associated with relapse.
Conclusions
In conclusion, most cats in diabetic remission have impaired glucose tolerance and a minority have impaired fasting glucose concentration. Cats with both normal fasting glucose concentration and normal glucose tolerance are at low risk of relapse. In contrast, cats with fasting glucose concentrations ≥7.5 mmol/L (≥135 mg/dL) have 13 times higher odds of relapsing than cats with lower fasting glucose concentrations. Similarly, cats with a 3 hour glucose concentration >14.0 mmol/L (252 mg/dL) in a glucose tolerance test at 1 g/kg have 10 times higher odds of relapsing than cats with lower concentrations. Cats with concentrations above these fasting and glucose tolerance test cut‐points have an 88% probability of relapsing within 9 months of testing. Therefore, continued monitoring and management are warranted to decrease the risk of relapse. Corticosteroid administration should be avoided in all cats in remission, and especially in those with increased fasting glucose concentrations or impaired glucose tolerance. Additional studies are required to determine if the variables significantly associated with increased odds of relapse in diabetic cats in remission are also predictors of diabetes in other high risk groups such as aged, obese and Burmese cats.
Acknowledgments
The authors thank The Cat Clinic in Brisbane for participating in the trial, and staff who assisted. We also thank the clients who allowed their cats to be enrolled in this study. The authors thank Mia Reeve‐Johnson for assistance with data collection for glucose tolerance tests in control cats.
Grant support: Australian Companion Animal Health Foundation, Abbott Animal Health, and Nestlé Purina.
Conflict of Interest Declaration: The authors disclose no conflict of interest.
Off‐label Antimicrobial Declaration: The authors declare no off‐label use of antimicrobials.
The Cat Clinic, Brisbane.
Abstracts presented at 2011 ACVIM Forum (Denver, CO) and ACVS Science Week 2012 (Gold Coast).
Footnotes
IDEXX laboratories, Brisbane, Qld, Australia
AlphaTRAK, Abbott Animal Health; Cozzi EM et al., 2006
Reeve‐Johnson M, Rand J, Anderson S, et al. Determination of reference values for casual blood glucose concentration in clinically healthy, aged cats measured with a portable glucose meter from an ear or paw sample. J Vet Intern Med 2012;26:755 (abstract)
Reeve‐Johnson M, Rand J, Vankan D, et al. Diagnosis of prediabetes in cats: Cut‐points for impaired fasting glucose concentration and impaired glucose tolerance in cats 8 years and older using ear or paw samples and a portable glucose meter calibrated for cats. J Vet Intern Med 2013;27:639 (abstract)
Version 12.1; StataCorp, College Station, TX
Copyright 2005, Created Amadeo J. Pesce, Paul Horn, and Daniel Lewis, University of Cincinnati, Cincinnati, OH
International Renal Interest Society: http://www.iris-kidney.com
Hills m/d, dry; Hill's Pet Nutrition, Topeka, KS
References
- 1. Marshall R, Rand J, Morton J. Treatment of newly diagnosed diabetic cats with glargine insulin improves glycemic control and results in higher probability of remission that protamine zinc and lente insulins. J Feline Med Surg 2009;11:683–691. [DOI] [PMC free article] [PubMed] [Google Scholar]
- 2. Link K, Allio I, Reinecke M, et al. The effect of experimentally induced chronic hyperglycaemia on serum and pancreatic insulin, pancreatic islet ICF‐I and plasma and urinary ketones in domestic cats (Felis felis). Gen Comp Endocrinol 2013;118:269–281. [DOI] [PubMed] [Google Scholar]
- 3. Nelson R, Griffey S, Feldman E, et al. Transient clinical diabetes mellitus in cats: 10 cases (1989–1991). J Vet Intern Med 1999;13:28–35. [PubMed] [Google Scholar]
- 4. Unger R, Grundy S. Hyperglycemia as an inducer as well as a consequence of impaired islet cell function and insulin resistance: Implications for the management of diabetes. Diabetologia 1985;28:119–121. [DOI] [PubMed] [Google Scholar]
- 5. Bennet N, Greco D, Peterson M, et al. Comparison of a low carbohydrate‐low fibre diet and a moderate carbohydrate‐high fibre diet in the management of feline diabetes mellitus. J Feline Med Surg 2006;8:73–84. [DOI] [PMC free article] [PubMed] [Google Scholar]
- 6. Roomp K, Rand J. Intensive blood glucose control is safe and effective in diabetic cats using home monitoring and treatment with glargine. J Feline Med Surg 2009;11:668–682. [DOI] [PMC free article] [PubMed] [Google Scholar]
- 7. Zini E, Hafner M, Osto M, et al. Predictors of clinical remission in cats with diabetes mellitus. J Vet Intern Med 2010;24:1314–1321. [DOI] [PubMed] [Google Scholar]
- 8. Association AD. Diagnosis and classification of diabetes mellitus. Diabetes Care 2011;34(Suppl 1):S62–S69. [DOI] [PMC free article] [PubMed] [Google Scholar]
- 9. Rand J, Kinnaird E, Baglioni A, et al. Acute stress hyperglycemia in cats is associated with struggling and increased concentrations of lactate and norepinephrine. J Vet Intern Med 2002;12:123–132. [DOI] [PubMed] [Google Scholar]
- 10. Crenshaw K, Peterson M. Pretreatment clinical and laboratory evaluation of cats with diabetes mellitus: 104 cases (1992–1994). J Am Vet Med Assoc 1996;5:943–949. [PubMed] [Google Scholar]
- 11. Horn PF, Feng L, Li Y, Pesce A. Effect of outliers and nonhealthy individuals on reference interval estimation. Clin Chem 2001;47:2137–2145. [PubMed] [Google Scholar]
- 12. Horn P, Pesce A. Reference Intervals: A User's Guide. Washington, DC: AACC Press; 2005. [Google Scholar]
- 13. Horn P, Pesce A, Copeland B. A robust approach to reference interval estimation and evaluation. Clin Chem 1998;44:622–631. [PubMed] [Google Scholar]
- 14. Farrow H, Rand J, Morton J, et al. Postprandial glycaemia in cats fed a moderate carbohydrate meal persists for a median of 12 hours—Female cats have higher peak glucose concentrations. J Feline Med Surg 2012;14:706–715. [DOI] [PMC free article] [PubMed] [Google Scholar]
- 15. Link K, Rand J. Changes in blood glucose concentration are associated with relatively rapid changes in circulating fructosamine concentrations in cats. J Feline Med Surg 2008;10:583–592. [DOI] [PMC free article] [PubMed] [Google Scholar]
- 16. Rand J. Pathogenesis of feline diabetes. Vet Clin North Am 2013;43:221–232. [DOI] [PubMed] [Google Scholar]
- 17. Niessen S, Church D, Forcada Y. Hypersomatotropism, acromegaly, and hyperadrenocorticism and feline diabetes mellitus. Vet Clin North Am 2013;43:319–350. [DOI] [PubMed] [Google Scholar]