Abstract
Background
Cavalier King Charles Spaniels (CKCS) have a high prevalence of Chiari‐like malformation (CM). Herniation of the cerebellum into the foramen magnum is a key diagnostic feature for CM. Midsagittal MR images are the preferred technique for visualizing cerebellar herniation (CH).
Objective
To investigate whether CT can be used to diagnose CH.
Animals
Fifteen client‐owned CKCS dogs referred for investigation of the brain and cranial cervical spine on MRI and CT.
Methods
Two reviewers retrospectively analyzed midsagittal T1WSE and T2WSE MR images and midsagittal pre‐ and postcontrast 2D multiplanar reformatted CT images from each dog for the presence of CH. And, if present, the length (mm, CHL) of the herniation was measured. The results were analyzed statistically.
Results
There was no significant difference between the different observers and techniques for the detection of CH and measurement of CHL. Overall, the CHL was longer on the CT images.
Conclusion and Clinical Importance
Both techniques are useful for detecting CH and measuring CHL. Because CHL does not have a known direct impact on the clinical presentation of CM, CT can be used as a diagnostic tool in a routine clinical practice for CM in CKCS when MRI is not available. We emphasize that MRI is the standard screening technique in CKCS for breeding purposes to detect the presence of CM and SM and, at the current time, CT cannot replace MRI.
Keywords: Axial imaging modalities, Caudal fossa, Chiari‐like malformation
Abbreviations
- CH
cerebellar herniation
- CHL
cerebellar herniation length
- CKCS
Cavalier King Charles Spaniels
- CM
Chiari‐like malformation
- CT
computed tomography
- MRI
magnetic resonance imaging
- SM
syringomyelia
Cavalier King Charles Spaniels (CKCS) have a high prevalence of Chiari‐like malformation (CM). CM is characterized by a disproportion in the volume of the cerebellum and medulla oblongata compared to that of the caudal fossa.1, 2, 3, 4 These abnormalities are associated with displacement or caudal herniation of part of the cerebellum and brainstem into or through the foramen magnum.5 Other reported abnormalities reported in these patients include occipital bone hypoplasia/dysplasia or a shallow caudal cranial fossa,1 kinking of the medulla and malformations of the craniocervical junction,1, 2, 6 syringomyelia (SM)7 and ventriculomegaly or hydrocephalus.3 Indentation and herniation of the caudal cerebellar vermis are most commonly cited as the key diagnostic features for the diagnosis of CM.3, 8 Midsagittal magnetic resonance images (MRI) are mentioned in several articles as the preferred technique for visualizing the caudal fossa and for identifying morphologic changes associated with CM.1, 3, 8, 9 Diagnostic assessment of the caudal fossa is sometimes difficult when computed tomography (CT) is used because of beam hardening artifacts associated with this technique. Studies on the comparison of these imaging modalities for the detection of cerebellar herniation (CH) are absent. The goal of this study was to prospectively evaluate the degree of agreement between low‐field MRI and multislice CT for the detection of CH and cerebellar herniation length (CHL) in CKCS.
Materials and Methods
Subjects
This study included 15 client‐owned CKCS that were evaluated through the Department of Veterinary Medical Imaging and Small Animal Orthopedics of the Faculty of Veterinary Medicine, Ghent University, between January 2012 and December 2013.
After medical histories were obtained and a complete clinical evaluation including neurologic examination was performed, the dogs underwent (in their clinical work‐up) both MRI and CT studies of the brain and cranial cervical spine. Descriptive data were recorded including age, sex, bodyweight, and clinical signs. Owner consent was obtained before the examinations. The study was conducted in accordance with the guidelines of the Animal Care Committee of Ghent University.
MRI Protocol
Imaging was performed using a 0.2 Tesla MRI unit.1 The dogs were anesthetized and positioned in dorsal recumbency with their head in extended position, placed in a multiple array knee coil (paired saddle coil) used in human medicine. Protocols included precontrast sagittal T1‐weighted spin echo (T1WSE) imaging (repetition time, 400–800 milliseconds; echo time, 17 milliseconds) and T2‐weighted spin echo (T2WSE) imaging in sagittal planes (repetition time, 3,000–6,000 milliseconds; echo time, 120 milliseconds). Four‐millimeter‐thick contiguous slices were chosen (image matrix, 512 × 512). Mean examination time was 60 minutes per dog.
CT Protocol
Imaging was performed using a 4‐slice helical CT device.2 The dogs were anesthetized and positioned in dorsal recumbency with their head in extended position. Images in 1.25‐mm‐thick contiguous slices (120 kVp, 140 mAs, image matrix 512 × 512) were obtained, before and immediately after administration of 2 mL/kg intravenous iodinated contrast medium.3 The raw data were reconstructed in soft tissue algorithm. Mean examination time was 10 minutes per dog.
Imaging Analysis
Before analysis, MR and CT images were loaded into an open source imaging software.4 Images with patient information removed were evaluated by two experienced radiologists (IG and HvB). All CT images were reviewed in a brain window (window width, 80–150 HU; window level, 40–75 HU). Adjustments of the window width and level were made by the radiologists to allow better visualization. On midsagittal T1WSE and T2WSE MR images and midsagittal pre‐ and postcontrast 2D multiplanar reformatted CT images, the presence of a CH was noted and the CHL was measured (mm). The CHL was defined as the position of the tip of the cerebellar vermis relative to the foramen magnum as previously described (Fig 1).2, 8
Figure 1.
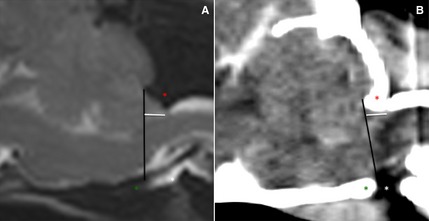
Midsagittal T2WSE image (A) and postcontrast CT image (B) (soft tissue window) of the brain of the same dog. The supraoccipital bone (red asterisk), basioccipital bone (green asterisk) and occipitoatlantoaxial joint is visible (white asterisk). The foramen magnum limit is set (black line) from the rostrodorsal aspect of the supraoccipital bone to the most caudal aspect of the basioccipital bone. The cerebellar herniation length (mm, white line) is measured caudal from the foramen magnum.
Statistical Analysis
Statistical analyses were performed with an open source software package R.10 Bland‐Altman analyses were performed to evaluate the interobserver agreement. Wilcoxon signed‐ranked test was used to analyze differences between the observers and modalities. To investigate the true effects of the imaging modality instead of the effect of the observer, the mean was used. The Bonferroni correction was applied for multiple comparisons. Data are presented as mean and P < .05 was considered significant.
Results
Animals
Fifteen CKCS (6 males and 9 females; median age, 66 months [range: 8–144 months]) were included in this study. Clinical signs detected or reported by owners at the initial evaluation varied, the most common of which were neck pain, phantom scratching, behavioral change (such as sudden fearfulness, unwillingness to play, agression, etc.), head tilt, ataxia and paresis or paralysis.
Subjective Assessment of the Presence of CH
There was 100% agreement between the observers concerning the presence of CH on MRI sequences and CT, which determined the evidence of CH in all dogs in the study.
Interobserver Agreement
Wilcoxon signed‐ranked test showed that there was no significant difference for measuring CHL on T1WSE (P = .71) and a significant difference for measuring CHL on T2WSE MR images (P = .04) and pre‐ (P = .05) and postcontrast (P = .01) CT images between the observers. Bland–Altman plots (Fig 2) showed there was a large variation between measurements of CHL on CT images, before and after contrast medium administration, between the observers.
Figure 2.
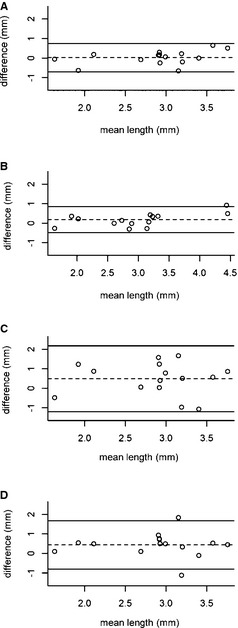
Bland–Altman plot indicating agreement between the observers for the cerebellar herniation length on the different techniques. (A) T1WSE MR images, (B) T2WSE MR images, (C) precontrast CT images, (D) postcontrast CT images. The x‐axis corresponds to the mean value for both observers, whereas the y‐axis corresponds to the difference between the two observers. The mean of the differences (dashed line) and 95% limits of agreement (upper and lower lines) are indicated.
Intermethod Agreement
Wilcoxon signed‐ranked test followed by the Bonferroni correction for multiple comparisons (Fig 3) showed there was no significant difference between the various imaging techniques for measuring CHL: T1WSE and T2WSE MR images (P = 1), CT images before and after contrast medium injection (P = .29), T1WSE MR images and pre‐ (P = 1) and postcontrast (P = .38) CT images and T2WSE MR images and pre‐ (P = 1) and postcontrast (P = 1) CT images.
Figure 3.
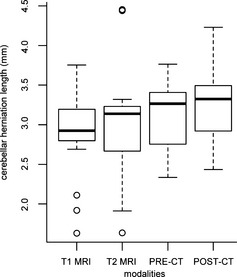
Box‐and‐whisker plot, indicating median (horizontal bar), 25th and 75th percentiles (box), and range of cerebellar herniation length (mm) in Cavalier King Charles Spaniels on both sequences on MR images and pre‐ and postcontrast CT images. Overall, the median length and the range of the length of the CH was higher and longer on the CT images.
Discussion
Results of this study indicate that low‐field MR and multislice CT imaging can provide comparable information regarding the presence of CH. CT and MRI are both imaging modalities to visualize the brain and to detect a variety of intracranial lesions in humans and animals. Each method has specific advantages and disadvantages to observe certain brain regions as the patient's general condition, the availability of the equipment and economic considerations determine the choice of either method. More specific compared to MRI studies, CT examinations take less time, hence require shorter anesthesia and therefore are more suitable for unstable patients. The purchase of CT is less expensive and devices are more widely available compared to MRI.11
For morphometric studies of the caudal fossa and associated abnormalities related to CM, T1WSE, and T2WSE midsagittal MR images are used in both human and veterinary studies.1 Sagittal images provide a clear delineation of the boundaries of intracranial structures that are orientated in a rostrocaudal direction e.g., the corpus callosum, brainstem, and cerebellar vermis.9 Both sequences provide a good contrast between brain parenchyma and cerebrospinal fluid. T1WSE images reveal better the gross external anatomy and structure of the cerebellum and bony components, as T2WSE sequences provide a better view of the internal anatomy of the cerebellum and pathological conditions.12
In our study, no significant difference was detected for measuring or detecting CH between both sequences. CT scans of the caudal fossa are not routinely performed to evaluate the cerebellum because of the presence of several artifacts, foremost partial volume effect, and beam hardening, which are reported to influence the evaluation. These artifacts are most prominent at the caudal fossa because of the thick petrous temporal bone and are more pronounced in older CT devices. Multislice CT devices use filters to perform beam hardening correction to reduce artifacts and provide better temporal and contrast resolution.13 Also, opting for thin slices, increases the in‐plane resolution and decreases the partial volume effects.14 The use of different reconstruction variables optimizes the image quality of specific brain regions such as the caudoventral cerebellar margin.14 The ability to reconstruct thick slices from thin slices reduces skull base‐related artifacts.15 A bone algorithm was not used in this study to reconstruct CT images and to measure the CH. Although the use of a bone reconstruction algorithm would enhance the boundary between the cerebellum and the surrounding bone, it would also increase noise, making the boundary between the cerebellum and the other soft tissues more difficult to delineate.
Statistical analysis performed in this study confirmed that there was no significant difference in MRI and CT for the measurement of the CHL, but overall, the length of the CH was longer on CT (Fig 4). Because the measurements of the CHL were made on images of live dogs, and no necropsy could be performed, the actual CHL cannot be verified. The differences in length on the images, between both the techniques, can be explained by the different technical properties. MRI provides greater soft tissue detail which might allow for a better delineation of the cerebellum. Also the use of a variable window level and width used by the observers can have a effect on the accuracy of the CT measurements16 compared with those on the MR images. The effect of different voxel size and spatial resolution between CT and MR can also explain the discrepancy in the measurements. Furthermore on MR images, the dorsal atlanto‐occipital membrane is visible in the extended head position, at the dorsocaudally border of the cerebellum17 (Fig 5). This limits the extent of the CH and can be used as the end border of the CH on these images. On CT images structures, such as this ligament in this region are not consistently visualized because of lesser soft tissue detail and the presence of artifacts as mentioned before. This can decrease the visibility of the caudal border of the herniation and be a cause for the increase in CHL on CT images compared with MR images. The degree of CH is significantly worse in dogs with a flexed compared to an extended head position.17 Keeping this in mind, because the dogs in our study were positioned with their head in an extended position, measurements both on our MR and CT images can already be an underestimate of the herniation length in the more natural flexed position.
Figure 4.
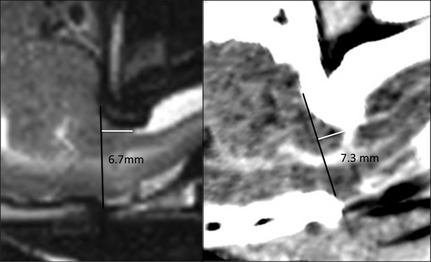
Midsagittal T2WSE image (A) and postcontrast CT image (B) (soft tissue window) at the level of the cerebellum of the same dog. The cerebellar herniation length is longer on the CT image.
Figure 5.
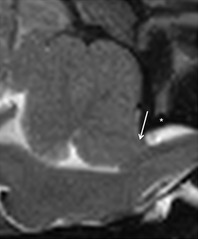
Midsagittal T2WSE image at the level of the cerebellum. A hypointense soft tissue structure (atlanto‐occipital membrane) (white arrow) is visible dorsal to the spine, between the dorsal edge of the foramen magnum and the cranial border of the arch of the atlas (white asteriks).
Previous studies have not found an association between the degree of CH and either clinical signs or SM in CKCS with CM.2, 4, 7, 8 The difference in CHL between MR and CT images and the less natural head position does, therefore, not have an impact on the clinical signs and SM. Herniation of the cerebellar vermis into the foramen magnum8 is next to indention of the cerebellum by the occipital bone,3 a diagnostic feature for the diagnosis of CM. The occurrence of CM on its own is not enough to exclude CKCS from breeding programs5 but the presence of SM is a crucial factor in this decision. SM is characterized by the development of fluid‐filled cavities within the spinal cord7 and has been associated with neurological signs such as thoracic and pelvic limb ataxia and neuropathic pain in CKCS.2, 18, 19 The size (diameter) and asymmetry of the syrinx18 is an important predictor of pain.
Further studies have to be performed to investigate if SM can be equally visible on CT and MR images to determine if CT can be used as an alternative imaging technique for CM/SM in CKCS. From this study, we can draw the following conclusions regarding the clinical relevance of the study findings. Because CH is consistently identified by different observers on CT and on MRI, CT can be used in certain clinical circumstances as a diagnostic tool for CM in CKCS when MRI is not available. Furthermore, the results of this study suggest that CT can be used to confirm or rule out CH in other situations such as when considering a cisternal puncture for cerebral spinal fluid collection or cisternal injection for myelography.14 We emphasize that, at the current time, CT cannot replace MRI as the standard screening technique for CKCS for breeding purposes for the presence of CM and SM.
Acknowledgment
Funding: No funding.
Conflict of Interest Declaration: The authors disclose no conflict of interest.
Off‐label Antimicrobial Declaration: The authors declare no off‐label use of antimicrobials.
Department of Medical Imaging of Domestic Animals and Orthopedics of Small Animals, Faculty of Veterinary Medicine, Ghent University, Salisburylaan 133, 9820 Merelbeke, Belgium.
Footnotes
Airis Mate, Hitachi, Japan
Lightspeed Qx/i; General Electric Medical Systems, Milwaukee, WI
Ultravist 300; N.N. Shering S.A., Berlin, Germany.
OsiriX Medical Imaging Software, Geneva, Switzerland.
References
- 1. Carrera I, Dennis R, Mellor DJ, et al. Use of magnetic resonance imaging for morphometric analysis of the caudal cranial fossa in Cavalier King Charles Spaniels. Am J Vet Res 2009;70:340–345. [DOI] [PubMed] [Google Scholar]
- 2. Cerda‐Gonzales S, Olby NJ, Mccullough S, et al. Morphology of the caudal fossa in Cavalier King Charles Spaniels. Vet Radiol Ultrasound 2009;50:37–46. [DOI] [PubMed] [Google Scholar]
- 3. Cross HR, Cappello R, Rusbridge C. Comparison of cerebral cranium volumes between Cavalier King Charles Spaniels with Chiari‐like malformation, small breed dogs and Labradors. J Small Anim Pract 2009;50:399–405. [DOI] [PubMed] [Google Scholar]
- 4. Driver CJ, Rusbridge C, Cross H, et al. Relationship of brain parenchyma within the caudal cranial fossa and ventricle size to syringomyelia in Cavalier King Charles Spaniels. J Small Anim Pract 2010;51:382–386. [DOI] [PubMed] [Google Scholar]
- 5. Capello R, Rusbridge C. Report from the Chiari‐like malformation and syringomyelia working group round table. Vet Surg 2007;36:509–512. [DOI] [PubMed] [Google Scholar]
- 6. Marino DJ, Loughin CA, Dewey CW, et al. Morphometric features of the craniocervical junction region in dogs with suspected Chiari‐like malformation determined by combined use of magnetic resonance imaging and computed tomography. Am J Vet Res 2012;73:105–111. [DOI] [PubMed] [Google Scholar]
- 7. Rusbridge C, Macsweeney JE, Davies JV, et al. Syringohydromyelia in Cavalier King Charles Spaniels. J Am Anim Hosp Assoc 2000;36:34–41. [DOI] [PubMed] [Google Scholar]
- 8. Lu D, Lamb CR, Pfeiffer DU, et al. Neurological signs and results of magnetic resonance imaging in 40 Cavalier King Charles Spaniels with Chiari type 1‐like malformation. Vet Rec 2003;153:260–263. [DOI] [PubMed] [Google Scholar]
- 9. Benigni L, Lamb CR. Comparison of fluid‐attenuated inversion recovery and T2‐weighted magnetic resonance images in dogs and cats with suspected brain disease. Vet Radiol Ultrasound 2005;46:287–292. [DOI] [PubMed] [Google Scholar]
- 10. R Core team (2012). R: A Language and Environment for Statistical Computing. Vienna, Austria: R Foundation for Statistical Computing; ISBN 3‐900051‐07‐0, URL http://www.R-project.org/. Accessed March 15, 2014. [Google Scholar]
- 11. Gielen I, Kromhout K, Gavin P, et al. Agreement between low‐field MRI and CT for the detection of suspected intracranial lesions in dogs and cats. J Am Vet Med Assoc 2013;243:367–375. [DOI] [PubMed] [Google Scholar]
- 12. Parizel PM, van den Hauwe L, De Belder F, et al. Magnetic resonance imaging of the brain In: Reimer P, Parizel PM, Meaney JFM, Stichnoth FA, eds. Clinical MR Imaging, 3rd ed Berlin: Springer; 2010:107–195. [Google Scholar]
- 13. Schwarz T, Saunders J, eds. Veterinary Computed Tomography, 1st ed West‐Sussex: John Wiley & Sons Ltd; 2011. [Google Scholar]
- 14. Zarelli M, Schwarz T, Puggioni A, et al. An optimized protocol for multislice computed tomography of the canine brain. Vet Radiol Ultrasound 2014;55:387–392. [DOI] [PubMed] [Google Scholar]
- 15. Porat‐Mosenco Y, Schwarz T, Kass PH. Thick‐section reformatting of thinly collimated computed tomography for reduction of skull‐base‐related artifacts in dogs and horses. Vet Radiol Ultrasound 2004;45:131–135. [DOI] [PubMed] [Google Scholar]
- 16. Auriemma E, Voorhout G, Barthez PY. Determination of optimal window width and level for measurement of the canine pituitary gland height on computed tomographic images using a phantom. Vet Radiol Ultrasound 2007;48:113–117. [DOI] [PubMed] [Google Scholar]
- 17. Upchurch JJ, McGonnell IM, Driver CJ, et al. Influence of head positioning on the assessment of Chiari‐like malformation in Cavalier King Charles spaniels. Vet Rec 2011;169:277–282. [DOI] [PubMed] [Google Scholar]
- 18. Rusbridge C, Carruthers H, Dube MP, et al. Syringomyelia in Cavalier King Charles Spaniels: The relationship between syrinx dimensions and pain. J Small Anim Pract 2007;48:432–436. [DOI] [PubMed] [Google Scholar]
- 19. Rusbridge C, Jeffery ND. Pathophysiology and treatment of neuropathic pain associated with syringomyelia. Vet J 2008;175:164–172. [DOI] [PubMed] [Google Scholar]


