

Abstract
The current standard of care for epithelial ovarian cancer does not discriminate between different histologic subtypes (serous, clear cell, endometrioid and mucinous) despite the knowledge that ovarian carcinoma subtypes do not respond uniformly to conventional platinum/taxane‐based chemotherapy. Exploiting addictions and vulnerabilities in cancers with distinguishable molecular features presents an opportunity to develop individualized therapies that may be more effective than the current ‘one size fits all' approach. One such opportunity is arginine depletion therapy with pegylated arginine deiminase, which has shown promise in several cancer types that exhibit low levels of argininosuccinate synthetase including hepatocellular and prostate carcinoma and melanoma. Based on the high levels of argininosuccinate synthetase previously observed in ovarian cancers, these tumours have been considered unlikely candidates for arginine depletion therapy. However, argininosuccinate synthetase levels have not been evaluated in the individual histologic subtypes of ovarian carcinoma. The current study is the first to examine the expression of argininosuccinate synthetase at the mRNA and protein levels in large cohorts of primary and recurrent ovarian carcinomas and ovarian cancer cell lines. We show that the normal fallopian tube fimbria and the majority of primary high‐grade and low‐grade serous ovarian carcinomas express high levels of argininosuccinate synthetase, which tend to further increase in recurrent tumours. In contrast to the serous subtype, non‐serous ovarian carcinoma subtypes (clear cell, endometrioid and mucinous) frequently lack detectable argininosuccinate synthetase expression. The in vitro sensitivity of ovarian cancer cell lines to arginine depletion with pegylated arginine deiminase was inversely correlated with argininosuccinate synthetase expression. Our data suggest that the majority of serous ovarian carcinomas are not susceptible to therapeutic intervention with arginine deiminase while a subset of non‐serous ovarian carcinoma subtypes are auxotrophic for arginine and should be considered for clinical trials with pegylated arginine deiminase.
Keywords: arginine, argininosuccinate synthetase, ovarian carcinoma histologic subtypes, arginine deiminase, ADI‐PEG 20
Introduction
The amino acid arginine is required for diverse cellular processes that include the synthesis of nitric oxide, nucleotides, polyamines and proteins 1, and cancer growth 2, 3, 4, 5. Most arginine is provided to cells via the bloodstream, but eukaryotic cells are also capable of synthesizing arginine, making it a nonessential amino acid for survival. The rate‐limiting enzyme for arginine synthesis is argininosuccinate synthetase (ASS1; EC 6.3.4.5.). ASS1 catalyses the conversion of citrulline and aspartate to argininosuccinate, which is then converted to arginine and fumarate. ASS1 is expressed at high levels in several normal tissues including hepatocytes, proximal renal tubules and endothelial cells 6, 7, 8, 9.
ASS1 expression is frequently downregulated in several cancers including melanoma, hepatocellular carcinoma, pleural mesothelioma, myxofibrosarcoma, lymphoma and cancers of the kidney, prostate, bladder and lung 10, 11, 12, 13, 14, 15, 16, 17, 18, 19, 20, 21, 22, 23. This tumour‐specific downregulation of ASS1 results in the inability of tumour cells to synthesize their own arginine and exposes an intrinsic dependence on extracellular blood‐borne arginine. This dependence on extracellular arginine, known as arginine auxotrophy 24, provides the basis for a therapeutic approach in which selective elimination of arginine from the circulation of patients has been used to target tumours that exhibit low levels of ASS1 expression 8, 17, 25, 26. Arginine deiminase (ADI; EC 3.5.3.6.) is a microbial enzyme that efficiently depletes arginine from peripheral blood by hydrolysing arginine to citrulline and ammonia 27, thus forcing cells to rely on their own ability to generate arginine through ASS1. Arginine depletion therapy with pegylated arginine deiminase (ADI‐PEG 20) was reported to be safe and effective in advanced melanoma, hepatocellular carcinoma and mesothelioma in phase I/II clinical trials 28, 29, 30, 31, 32.
It is unknown whether patients with ovarian cancer would benefit from ADI‐PEG 20. Primary ovarian cancers have been shown to express high levels of ASS1 33 and thus have been considered unsuitable for arginine depletion by ADI‐PEG 20. However, two studies indicate that patients with relapsed ovarian cancer could be susceptible to arginine depletion due to the downregulation of ASS1 in cisplatin resistant recurrent tumours 34, 35. In contrast to these studies, ASS1 was identified as one of the significantly upregulated genes in recurrent samples relative to paired primary samples 36. Resolving this difference in results will have important implications for the potential selection and inclusion of ovarian cancer patients into on‐going clinical trials with ADI‐PEG 20.
To date, most studies regarding ASS1 expression in ovarian cancer have not distinguished between the different histologic subtypes (serous, clear cell, endometrioid and mucinous) of ovarian carcinomas. The clear cell and mucinous subtypes are less sensitive to current chemotherapy regimens 37, 38. Thus, there is a great need to identify and validate new therapeutic targets specific to each histologic subtype, especially the non‐serous subtypes, which have been far less studied than serous ovarian carcinoma. With the goal of defining ovarian cancer patient groups that might benefit from arginine depletion therapy, we used large ovarian cancer datasets generated in recent years as well as our own ovarian cancer samples with well‐annotated clinical outcomes to (a) test the hypothesis that ASS1 expression at diagnosis is associated with clinical outcome; (b) establish whether ASS1 levels are different between primary and recurrent ovarian tumours; (c) assess the levels of ASS1 in different histologic subtypes of ovarian carcinoma; and (d) test the inhibitory potential of ADI‐PEG 20 in ovarian cancer cell lines that exhibit different levels of ASS1.
Materials and methods
Tissue microarrays and full tissue sections
Studies involving human specimens were approved by the Cedars‐Sinai Medical Center Institutional Review Board (IRB). All patients signed an IRB‐approved consent for biobanking, clinical data extraction and molecular analysis. A cancer microarray containing different histologic subtypes of primary ovarian carcinoma (Subtype Array) was arrayed on four slides with each patient sample consisting of duplicate cores 1 mm in diameter. Different histologic subtypes of ovarian carcinoma were represented on all four slides. A tissue microarray containing high‐grade primary serous ovarian carcinomas (Serous Array) was arrayed on three slides with each patient sample consisting of three cores 0.5 mm in diameter. None of the patients on the Serous Array overlapped with the serous ovarian carcinoma patients on the Subtype Array. All sections from paired primary and recurrent/persistent tumours were cut on the same day.
Immunohistochemistry and western blot analysis
Immunohistochemical staining was performed by the Cedars‐Sinai Medical Center Department of Pathology and Laboratory Medicine. Formalin‐fixed, paraffin‐embedded tissue microarrays and tissue slides were stained with mouse monoclonal antibody against ASS1 (Polaris Pharmaceuticals, Inc., San Diego, CA) at 1:5000 dilution on the Leica Bond III instrument using the Bond Refine DAB detection kit. Antibody incubation was 15 minutes. Mayer's haematoxylin was used as a counterstain. Paired primary and recurrent/persistent tumour sections were stained at the same time to minimize technical variations. Immunostained microarrays and tissue sections were evaluated by two investigators (AEW and SO) who assigned scores: 0 (absent), +1 (weak), +2 (moderate) or +3 (strong). Primary and recurrent tumour pairs were randomly arranged to ensure that the investigators did not know if a given section represented a primary or recurrent tumour. The immunostained sections of each pair were compared to each other and scored as ‘equal' or ‘higher in this section'. The sections with higher ASS1 expression were then identified as primary or recurrent tumours. Discrepancies in scoring were resolved by consensus. Non‐informative cases (lack of tissue sample or absence of unequivocal tumour tissue) were excluded from the analysis. Sections of normal liver and kidney, known to express ASS1, served as positive controls. Lymphoid tissue, known to lack ASS1, served as a negative control. Western blot analysis was done as previously described 39. Ten micrograms of cell lysate was loaded per lane onto a gradient gel. The ASS1 antibody was used at 1:5000 dilution.
Cell lines and in vitro treatment with ADI‐PEG 20 and cisplatin
All cell lines were purchased from the American Type Culture Collection (ATCC, Manassa, VA) and maintained in DMEM media, supplemented with 10% fetal bovine serum and 1% penicillin‐streptomycin. For ADI‐PEG 20 treatment, 103 cells were plated in 96‐well luminometer plates in quadruplicate. The next day the cells were treated with the indicated concentration of ADI‐PEG 20 (Polaris Pharmaceuticals, Inc., San Diego, CA) for 5 days. For combinatorial treatment with cisplatin (Sigma, San Diego, CA), the same number of cells was treated with either ADI‐PEG 20, cisplatin or both, at various concentrations for 5 days. Cell viability was measured on indicated days by the CellTiter‐Glo luminescent cell viability assay (Promega, Madison, WI). The Relative Light Unit (RLU) was normalized, transformed to the log scale and calculated for the IC50 value using the GraphPad PRISM (version 6.0; Graph‐Pad Software, La Jolla, CA).
Microarray data analysis
Publicly available expression profile datasets were analysed using online bioinformatic tools in Oncomine (http://www.oncomine.org), KM Plotter (http://kmplot.com/analysis/index.php?p=service&cancer=ovar), cBio Portal for Cancer Genomics (http://www.cbioportal.org) and Cancer Cell Line Encyclopedia (CCLE; http://www.broadinstitute.org/ccle/). The U133A platform‐based datasets for ovarian carcinoma (GSE20565) and hepatocellular carcinoma (GSE5364) were processed and normalized by GENT (Gene Expression across Normal and Tumour tissue; http://medicalgenome.kribb.re.kr/GENT/). The parameters used for each analysis are indicated in the figures.
Statistical analysis
Kaplan–Meier survival curves were generated using GraphPad PRISM (version 6.0; Graph‐Pad Software, La Jolla, CA). Progression‐free survival (PFS) was defined as the interval between surgery and first recurrence. Overall survival was defined as the interval between surgery and death. Statistical significance was determined by the log‐rank Mantel‐Cox test. In vitro cell viability between the treated and control groups was analysed by an unpaired t‐test using GraphPad PRISM software. Data are presented with mean ± standard error of mean (SEM). p‐Value <0.05 was considered statistically significant.
Results
ASS1 is highly expressed in high‐grade and low‐grade serous ovarian carcinomas and their putative precursor cells
Previous studies have shown that mRNA levels of ASS1 are significantly increased in ovarian carcinoma compared to levels in the normal ovary 33. Our analysis of Oncomine datasets confirms higher levels of ASS1 mRNA in ovarian carcinomas compared to normal cells and tissues including ovarian surface epithelial cells, mesothelial cells lining the peritoneum or whole ovaries (supplementary material Figure S1). However, equally high levels of ASS1 were identified when serous ovarian carcinomas were compared to normal fallopian tubes 40 (supplementary material Figure S1).
The exact origin of serous ovarian carcinoma is still under debate 41, 42 with two cell types proposed as the main precursors: epithelial cells present on the ovarian surface or trapped within the ovary as epithelial inclusion cysts 43, 44, and secretory cells present in the fallopian tube fimbria or trapped within the ovary as epithelial inclusion cysts 45. Endometrioid and clear cell carcinomas are thought to develop from endometriosis, while the origin of mucinous tumours is not well characterized 46. We performed immunohistochemical staining with a monoclonal ASS1‐specific antibody to determine if any particular cell types within the ovary, tubal fimbria, endometrium and endometriotic tissue express ASS1. We first confirmed that ASS1 protein is detected with high specificity in three cell types known to express high levels of ASS1: hepatocytes, epithelial cells of the proximal renal tubule and endothelial cells 6, 7, 9 (supplementary material Figure S2). Within the ovary, we observed that ovarian surface epithelial cells (Figure 1A) and epithelial inclusion cysts lined by a simple monolayer of epithelial cells (Figure 1B) were negative to weakly positive for ASS1, while epithelial inclusion cysts lined by columnar cells were strongly positive for ASS1 (Figure 1C). Within the fallopian tube fimbria, secretory cells were strongly positive for ASS1 (Figure 1D). Serous carcinoma cells within the fallopian tube mucosa were also strongly positive for ASS1 (Figure 1E). In the normal endometria and endometriotic tissues, ASS1 was present in the endothelial and stromal cells but the epithelial cells were negative or weakly positive for ASS1 (supplementary material Figure S3).
Figure 1.
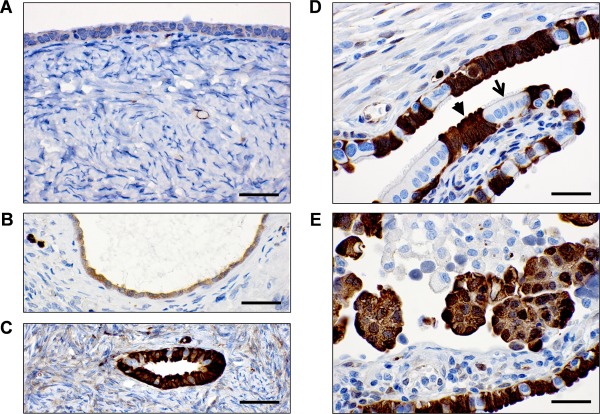
Immunohistochemical detection of the ASS1 protein in the ovary and fallopian tube. (A) Ovarian surface lined with mesothelial/cuboidal epithelial cells. (B) Ovarian inclusion cyst lined with mesothelial/cuboidal epithelial cells. (C) Ovarian inclusion cyst lined with columnar cells that resemble tubal fimbrial cells. (D) Fallopian tube fimbria secretory cells (arrowhead) and ciliated cells (arrow). (E) Serous carcinoma within the fallopian tube mucosa. Scale bar = 50 µm.
Serous ovarian carcinomas can be divided into two groups based on their distinct biological and molecular characteristics. Low‐grade, early‐stage, indolent serous ovarian carcinomas are frequently associated with mutations in KRAS, BRAF or ERBB2 47 while high‐grade, invasive serous carcinomas are genetically unstable and almost invariably associated with p53 mutations 47, 48. Both types of serous ovarian carcinomas are thought to originate from the ovarian and/or tubal epithelial cells 49. Our analysis of the GSE12172 dataset containing 30 low‐grade and 60 high‐grade tumours 50 revealed no significant difference in ASS1 mRNA expression when tumours were grouped by grade, stage and KRAS, BRAF or ERBB2 mutation status (supplementary material Figure S4). Thus, the serous histological subtype of ovarian carcinoma is characterized by high levels of ASS1 regardless of tumour grade, differentiation status, invasive potential or molecular profile.
ASS1 levels in high‐grade serous ovarian carcinoma do not correlate with patient survival and cisplatin resistance
To examine the association of ASS1 mRNA expression with clinical outcomes, we analysed 1171 primary ovarian cancer samples (the majority of which were high‐grade, late‐stage serous ovarian carcinomas) from ten publicly available datasets using the Kaplan–Meier plotter tool 51. There was no correlation between ASS1 mRNA expression and patient survival when patients were split by the median or the software auto‐calculated best cut‐off where approximately two‐third of patients expressed high levels of ASS1 (supplementary material Figure S5). ASS1 levels were not associated with survival when the analysis was restricted to a subgroup of patients (n = 363) with optimally debulked grade 3, stage III or IV serous ovarian carcinomas (data not shown). Similarly, when we analysed the ovarian TCGA Agilent microarray data from 489 samples of primary high‐grade serous ovarian carcinoma 40 using the cBio Portal for Cancer Genomics software 52, there was no significant correlation between ASS1 mRNA levels and methylation status, overall survival, disease‐free survival or cisplatin resistance (supplementary material Figure S6). Oncomine analysis of the provisional ovarian TCGA Affymetrix microarray data from 594 samples of primary high‐grade serous ovarian carcinoma also did not show significant correlation between ASS1 mRNA levels and tumour grade, stage or overall survival (supplementary material Figure S7).
To determine the range of ASS1 protein levels in serous ovarian carcinoma and a possible association between ASS1 protein levels and patient outcome, a tissue microarray containing high‐grade primary serous ovarian carcinoma samples was immunostained with the ASS1 antibody and levels of positivity were correlated with patient survival. Immunostaining positivity scores (0–3) and patient data are shown in Figure 2A. The analysis only included patients who were diagnosed with grade 3, stage III or IV primary serous ovarian carcinoma and had received standard platinum/taxane therapy after primary tumour cytoreduction (optimal cytoreduction was achieved in >90% of patients). Of the 198 informative patient samples that satisfied the above criteria, high levels of the ASS1 protein (score 3) were observed in 147 (74%) samples while medium levels (score 2) were observed in 47 (24%) samples. ASS1 protein was expressed at low levels (score 1) or absent (score 0) in four (2%) samples (Figure 2A). To correlate ASS1 protein expression levels with survival, Kaplan–Meier curves were compared between the 147 patients with a score of 3 and the remaining 51 patients with a score of <3 (0, 1 and 2). Mean age at diagnosis was 63 years for patients with a score of 3 and 60 for patients with a score <3. There was no significant correlation between ASS1 protein expression and progression‐free survival or overall survival (Figure 2B), indicating that the ASS1 protein level at diagnosis is not a predictor of survival in high‐grade, late‐stage serous ovarian carcinomas. There was no significant correlation between ASS1 protein expression and survival when 22 patients with low‐grade or low‐stage disease were included in the analysis (supplementary material Figure S8).
Figure 2.
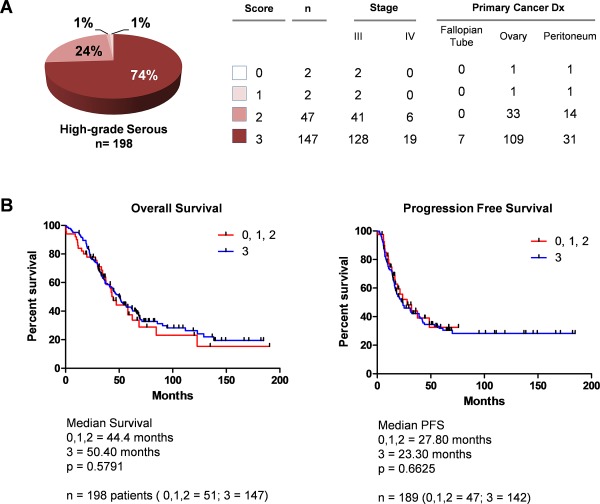
ASS1 protein levels in high‐grade serous ovarian carcinoma do not correlate with patient survival. (A) Pie chart indicating the percentage of high‐grade, late‐stage serous ovarian carcinomas with tissue microarray immunohistochemistry scores 0, 1, 2 and 3. (B) Kaplan–Meier survival curves comparing patients with a score of 3 (blue) versus patients with scores of 0, 1 and 2 (red).
ASS1 is upregulated in a subset of recurrent serous ovarian carcinomas
Previous studies have yielded conflicting results about ASS1 mRNA levels in recurrent ovarian tumours, with ASS1 found to be either downregulated 34, 35 or upregulated 36 in cisplatin‐resistant recurrent tumours. Our analysis of the 12 matched pairs of primary and recurrent high‐grade serous ovarian carcinomas from the ovarian TCGA database shows an increase of ASS1 mRNA in the majority of recurrent tumours (Figure 3A and supplementary material Table S1). To determine if ASS1 protein levels differ between primary and recurrent serous ovarian carcinomas, we immunohistochemically analysed 27 matched pairs of primary and recurrent/persistent high‐grade serous ovarian carcinomas (patient data are shown in supplementary material Table S2). Although ASS1 levels were unchanged in the majority of the paired samples, we observed higher levels of the ASS1 protein in eight (29%) recurrent/persistent tumours in comparison to their primary tumours (Figure 3B). The eight patients with increased ASS1 levels had a wide range of time to recurrence (Figure 3B).
Figure 3.
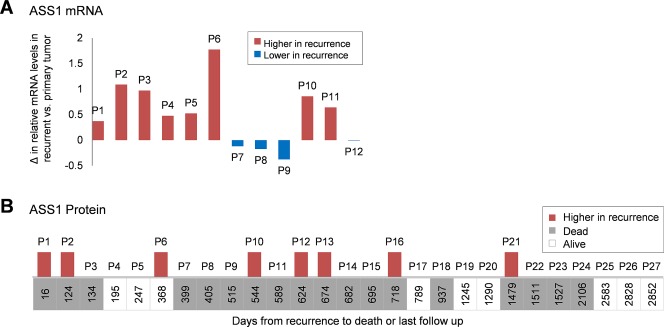
Comparison of ASS1 levels in matched pairs of primary and recurrent serous ovarian carcinomas. (A) Comparison of ASS1 mRNA levels in matched primary and recurrent samples from 12 patients. Relative mRNA values were obtained from the ovarian TCGA dataset. The graph shows the difference in mRNA values in recurrent versus primary tumours; P, patient. (B) Comparison of ASS1 immunopositivity in 27 matched pairs of primary and recurrent tissue sections ordered by the time from recurrence to death or last follow‐up. Higher levels of the ASS1 protein in recurrent tumours are indicated by red bars in the graph. The absence of bars indicates equal levels of the ASS1 protein in matched primary and recurrent tumours. None of the patients exhibited lower levels of the ASS1 protein in recurrent tumours; P, patient.
ASS1 mRNA and protein levels are significantly lower in the non‐serous subtypes compared to the serous subtype of ovarian carcinoma
To examine the levels of ASS1 expression in the four major histologic subtypes of ovarian carcinoma, we first conducted a comparative mRNA expression analysis using publicly available Oncomine microarray datasets consisting of a total of 246 serous, 42 clear cell, 110 endometrioid and 46 mucinous ovarian carcinoma samples. In each of the five datasets, this analysis revealed lower levels of ASS1 expression in clear cell, endometrioid and mucinous carcinomas compared to serous carcinomas (Figure 4A). To compare the ranges of ASS1 mRNA expression in individual ovarian carcinoma samples to those in normal liver and hepatocellular carcinoma, we plotted ASS1 mRNA expression levels from the Meyniel (GSE20565) dataset and a dataset that contained normal liver and hepatocellular carcinoma samples (GSE5364). As shown in Figure 4B, most serous ovarian carcinomas exhibited high levels of ASS1, while most clear cell, endometrioid and mucinous carcinomas showed reduced levels of ASS1. Importantly, the ASS1 levels in the non‐serous ovarian carcinomas were comparable to the ASS1 levels in hepatocellular carcinoma (Figure 4B), one of the cancers that usually exhibits low levels of ASS1 and in which ADI‐PEG 20 therapy has advanced to a phase III clinical trial (ClinicalTrials.gov; Identifier: NCT01287585).
Figure 4.
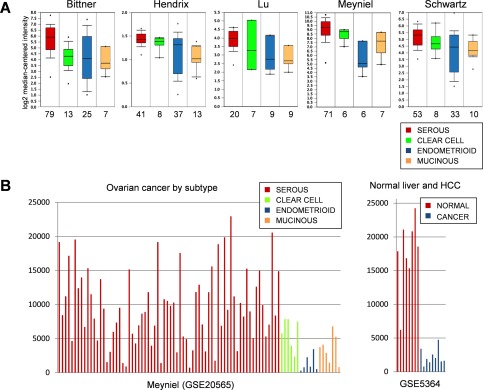
ASS1 mRNA expression in the major histologic subtypes of ovarian carcinoma. (A) Box and whisker plots of ASS1 expression levels in five ovarian cancer datasets, each containing the four major histologic subtypes of ovarian carcinoma. The Y axis indicates relative ASS1 expression levels and the X axis indicates the number of tumour samples for each histologic subtype. The box and whisker plots display the normalized expression values including the maximum value, the 90th, 75th, median, 25th and 10th percentiles and the minimum value. (B) ASS1 expression levels in individual ovarian carcinoma samples in the GSE20565 dataset and in normal liver and hepatocellular carcinoma (HCC) samples in the GSE5364 dataset. The U133A platform was used for both datasets and expression data were normalized and analysed by the GENT (Gene Expression across Normal and Tumor tissue) software. The Y axis indicates relative ASS1 expression levels.
To evaluate ASS1 protein levels in the major histologic subtypes of ovarian carcinoma, we performed ASS1 immunohistochemistry on a tissue microarray containing 43 serous, 39 clear cell, 34 endometrioid and 24 mucinous ovarian carcinomas. Representative images of each ovarian carcinoma subtype scored for ASS1 staining in tumour epithelial cells are shown in Figure 5A. The ASS1 protein was detected at varying levels (scores 0–3) in the epithelial component of the tumours and in the endothelial cells, which served as a positive control for the immunohistochemical staining of individual samples (inset in Figure 5A). The proportion of tumour samples that were assigned each score is shown in Figure 5B. Consistent with the results obtained on a tissue microarray containing serous ovarian carcinoma samples (Figure 2A), 75% of serous carcinomas on this array expressed high levels of ASS1 (score 3) while only 25% had scores <3. Low‐to‐intermediate levels of staining (scores 1–2) were observed in 87% of clear cell carcinomas. Low‐to‐absent levels of staining (scores 1–0) were observed in 65% of endometrioid and 67% of mucinous carcinomas. These data suggest that a subset of non‐serous ovarian carcinomas may be auxotrophic for arginine.
Figure 5.
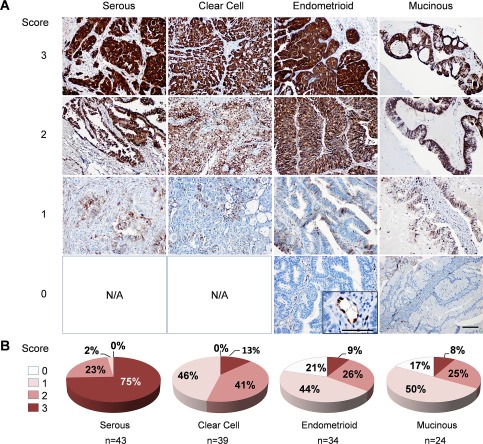
ASS1 protein expression in the major histologic subtypes of ovarian carcinoma. (A) Representative images of ASS1 immunohistochemical scoring in a tissue microarray consisting of the four major histologic subtypes of ovarian carcinoma; scale bar = 100 µm. The inset shows ASS1 expression in endothelial cells; scale bar = 50 µm. (B) Pie charts depicting the percentage of serous, clear cell, endometrioid and mucinous ovarian carcinomas with 0, 1, 2 and 3 scores. The total number of scored tumours in each histologic subtype is indicated by n. N/A, not applicable.
ASS1 levels in ovarian cancer cell lines are inversely correlated with sensitivity to ADI‐PEG 20
When we plotted ASS1 mRNA expression levels in nine ovarian cancer cell lines that had been analysed by the Cancer Cell Line Encyclopedia (CCLE) project 53, we observed a broad range of ASS1 mRNA expression across the different cell lines (Figure 6A). Immunostaining demonstrated that ASS1 protein was detectable in the three cell lines with the highest levels of ASS1 mRNA (OVCAR3, CAOV3 and OVCAR4) but not in the remaining cell lines (Figure 6B).
Figure 6.
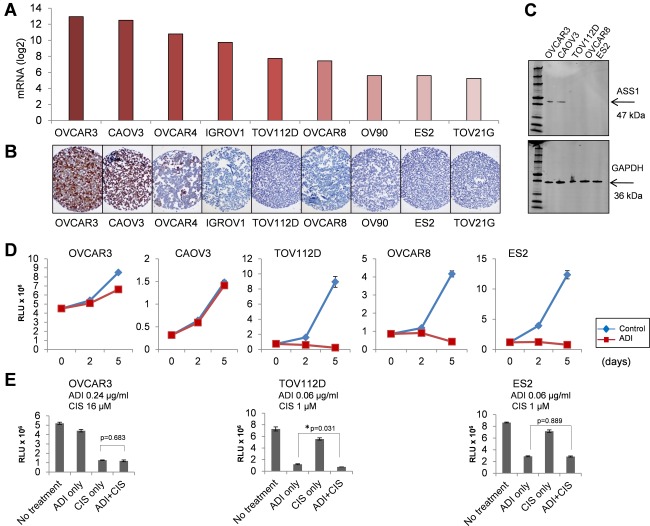
Correlation between ASS1 levels and sensitivity of ovarian cancer cells to arginine depletion. (A) ASS1 mRNA expression levels in human ovarian cancer cell lines were derived from the CCLE dataset. (B) ASS1 protein levels determined by immunohistochemical staining of a cell pellet array of ovarian cancer cell lines. (C) Western blot detection of ASS1 protein in ovarian cancer cell lines. GAPDH protein was used as a loading control. (D) In vitro sensitivity of ovarian cancer cell lines to ADI‐PEG 20. Cell viability (Y axis) at day 2 and 5 (X axis) after treatment with 1.1 µg/ml ADI‐PEG 20 treatment is shown. The value 1 in the Y axis corresponds to 106 Relative Light Unit (RLU). Error bars indicate ±SEM. (E) In vitro sensitivity of ovarian cancer cell lines to ADI‐PEG 20 and cisplatin used as monotherapy and in combination at indicated concentrations. The Y axis shows cell viability at day 5 with the value 1 corresponding to 106 RLU. Error bar indicates ±SEM. p‐Values between the monotherapy and combinatorial treatment were determined by t‐test. The asterisk indicates statistical significance.
To correlate the ASS1 levels with sensitivity to ADI‐PEG 20 in ovarian cancers, we focused on five ovarian cancer cell lines, including two cell lines that were positive for ASS1 (OVCAR3 and CAOV3) and three that were negative (TOV112D, OVCAR8, ES2) by immunohistochemical and western blot detection (Figure 6B and C). The cell lines were treated with various concentrations of ADI‐PEG 20 (0–2.4 µg/ml) for five days and cell viability was assessed using a CellTiter‐Glo luminescent cell viability assay. Cell lines with detectable levels of ASS1 protein (OVCAR3 and CAOV3) were resistant to ADI‐PEG 20 and did not show a decrease in cell viability up to 2.4 µg/ml of ADI‐PEG 20 (Figure 6D and data not shown). In contrast, cell lines with undetectable ASS1 protein (TOV112D, OVCAR8, ES2) showed a significant decrease in cell viability at lower concentrations of ADI‐PEG 20 (Figure 6D). The EC50 values were 0.08 µg/ml for OVCAR8, 0.07 µg/ml for TOV112D and 0.06 µg/ml for ES2 cells (data not shown).
Platinum agents, such as cisplatin, are the standard for ovarian cancer treatment. To assess whether ADI‐PEG 20 synergizes with cisplatin, OVCAR3, TOV112D and ES2 cell lines were treated with different concentrations of ADI‐PEG 20 (0–0.24 µg/ml) and cisplatin (0–16 µm), as single agents or in combination. The concentration range was determined based on the EC50 values in the three cell lines. As in the previous experiment, ADI‐PEG 20 was effective as a single agent in reducing the viability of the TOV112D and ES2 cell lines with undetectable ASS1 protein (Figure 6E). When different concentrations of cisplatin were added to the EC50 value (0.06 µg/ml) of ADI‐PEG 20, we observed a minor additive effect in TOV112D cells but not in ES2 cells (Figure 6E). In contrast, the OVCAR3 cells, which express high levels of the ASS1 protein, were more resistant to both ADI‐PEG 20 and cisplatin than the TOV112D and ES2 cells (Figure 6E and data not shown). As a single agent, ADI‐PEG 20 was ineffective in reducing the viability of the OVCAR3 cells at 0.06 µg/ml, whereas the majority of the TOV112D and ES2 cells were killed (data not shown). When different concentrations of cisplatin (0–16 µm) were applied to this condition, cisplatin as a single agent was effective in reducing cell viability but there was no synergistic or additive effect of combinatorial treatment with ADI‐PEG 20 and cisplatin in comparison to the monotherapy (Figure 6E).
Discussion
ADI‐PEG 20 has currently advanced into a phase III trial for hepatocellular carcinoma and is being investigated as a treatment strategy for other arginine auxotrophic cancers, such as melanoma, small cell lung cancer, prostate cancer and metastatic pleural mesothelioma (ClinicalTrials.gov). Presently, there is no clinical trial with ADI‐PEG 20 specifically for ovarian cancer. ASS1 deficiency will likely be a key factor in selecting patients for clinical trials with ADI‐PEG 20 monotherapy. Primary ovarian carcinomas were shown to express high levels of ASS1 33 but two studies have indicated that ASS1 may be downregulated in recurrent ovarian tumours in association with cisplatin resistance 34, 35. Currently, options for the treatment of cisplatin resistant tumours are extremely limited, making the possibility of arginine depletion therapy highly relevant. Thus, it was important to thoroughly assess the levels of ASS1 in ovarian cancer.
We first addressed the question of ASS1 expression in serous ovarian carcinoma and a possible correlation between ASS1 levels and clinical outcome as implied in Nicholson et al 35. Our studies of multiple microarray datasets of serous ovarian carcinomas did not show a correlation between ASS1 mRNA levels and clinical parameters such as stage, grade, cisplatin resistance, progression‐free survival and overall survival. At the protein level, we confirmed the lack of association between these clinical parameters and ASS1 expression in 198 patients with high‐grade, late‐stage serous ovarian carcinoma. Notably, >70% of serous ovarian carcinomas exhibited high levels of ASS1 protein, comparable to the levels of ASS1 in normal hepatocytes, proximal renal tubule epithelial cells and endothelial cells. These data are consistent with the previous finding that, among different cancer types, ovarian cancers exhibit peak levels of ASS1 33. We conclude that ASS1 mRNA or protein levels at diagnosis are not a good predictor of clinical outcome in patients with serous ovarian carcinomas.
Second, we asked whether ASS1 is differentially expressed in recurrent tumours in patients who become resistant to cisplatin because two previous studies demonstrated upregulation 34, 35 and one study demonstrated downregulation 36 of ASS1 mRNA in recurrent tumours. Our analyses of ASS1 expression in matched pairs of primary and recurrent high‐grade serous ovarian carcinoma samples at the mRNA (12 patient pairs) and protein (27 patient pairs) levels predominantly showed equal or increased ASS1 in recurrent tumours. Together, our data obtained from large cohorts of patients do not provide a rationale for the inclusion of patients with primary or recurrent serous ovarian carcinoma into clinical trials with ADI‐PEG 20. Instead, it may be beneficial to explore the possible dependency of serous ovarian carcinoma on elevated levels of ASS1.
In contrast to serous ovarian carcinoma, we observed low levels of ASS1 mRNA and protein in the clear cell, endometrioid and mucinous subtypes of ovarian carcinoma. Thus, ASS1 levels are associated with the histologic subtype (serous vs non‐serous) rather than the invasive potential (type I vs type II) of ovarian carcinoma. In this regard, ASS1 is similar to WT1, which is expressed at high levels in high‐grade and low‐grade serous tumours but at low levels in non‐serous ovarian carcinomas 54, 55. Currently, it is unclear why non‐serous histologic subtypes express lower levels of ASS1 than the serous subtype. The most likely explanation is the tumour tissue of origin. Both high‐grade and low‐grade serous carcinomas are thought to originate from cells in the fallopian tube or ovarian inclusion cysts, which express high levels of ASS1, while the ovarian clear‐cell, endometrioid and mucinous subtypes are thought to arise from endometriosis and other gynaecologic tissues that express low levels of ASS1.
Regardless of the mechanism(s) that regulate or determine ASS1 expression in different histologic subtypes of ovarian carcinoma, our study has practical implications because it identifies patients with non‐serous ovarian carcinomas as candidates for arginine depletion therapy. Currently, a phase I trial with ADI‐PEG 20 in combination with cisplatin is open for patients with metastatic melanoma and other advanced solid malignancies (ClinicalTrials.gov; Identifier: NCT01665183). The majority of patients with advanced non‐serous ovarian carcinomas are treated with cisplatin. Our data suggest that these tumours could be tested for their levels of ASS1, and that the results could be used to select patients for possible inclusion in this clinical trial. Further exploration of the effects of arginine depletion in non‐serous ovarian carcinomas may yield more effective diagnostic and therapeutic strategies for these patients and improve their clinical outcome.
Author contribution
SO conceived the study, supervised the experiments and wrote the manuscript. DC and AEW created the study design, obtained and analysed the data, and contributed to manuscript writing. DC conducted all experiments involving cancer cell lines and drug treatments. AEW and SO scored the slides and microarrays. JAB, WRW, JL and CSW contributed to data analysis. JSB and BYK provided crucial reagents. All authors participated in manuscript revisions and final approval for submission.
Supporting information
The following supplementary material may be found online.
Table S1. ASS1 mRNA expression levels and clinical information for 12 matched primary and recurrent ovarian serous carcinomas in the TCGA dataset.
Table S2. ASS1 protein immunopositivity and clinical information for 27 matched primary and recurrent ovarian serous carcinomas.
Figure S1. Comparison of ASS1 mRNA levels between normal tissues and serous ovarian cancers in multiple datasets. The figure is compiled from publicly available graphs of data analysed by the software provided by Oncomine. The Y axis shows relative ASS1 mRNA levels. The number of individual samples in each group on the X axis is indicated in parentheses. The software algorithms for calculating the p‐value and t‐test are described in the ‘Overview of Oncomine' document, which is available online at www.oncomine.org.
Figure S2. Immunohistochemical detection of ASS1 protein in normal tissues. (A) Liver, (B) fetal kidney and (C) blood vessels. Scale bar = 100 µm.
Figure S3. Immunohistochemical detection of the ASS1 protein in the normal endometrium and endometriosis. (A) Proliferative endometrium. (B) Secretory endometrium. (C) Endometriosis. The images are representative of staining patterns in six women with normal endometria and six women with endometriosis. ESC, endometrial stromal cells; EEC, endometrial epithelial cells; EC, endothelial cells. Scale bar = 50 µm.
Figure S4. Comparison of ASS1 mRNA levels in low‐grade and high‐grade serous ovarian carcinomas. ASS1 levels were compared in 90 serous ovarian carcinomas grouped by grade, stage, and presence of KRAS, BRAF or ERBB2 mutations using the Oncomine portal. The Y axis shows relative ASS1 mRNA levels. The number of individual samples in each group on the X axis is indicated in parentheses.
Figure S5. Correlation between ASS1 mRNA expression and survival using the Kaplan–Meier plotter tool. Ten combined ovarian cancer datasets were used to generate Kaplan–Meier survival plots using the KM plotter tool (http://kmplot.com/analysis/index.php?p=service&cancer=ovar). Patients were split by the median or software‐calculated auto best cutoff expression levels of ASS1 mRNA (probe 207076_s_at).
Figure S6. Analysis of ASS1 expression in high‐grade ovarian serous carcinoma in the TCGA Agilent microarray dataset. The Agilent microarray of 489 cases of serous ovarian carcinoma in the TCGA dataset was analysed using the cBio Cancer Genomics Portal (http://www.cbioportal.org). (A) ASS1 mRNA expression Z‐scores versus ASS1 copy number. By setting the mRNA expression Z‐score threshold to −1.0, the patients were divided into two groups: 115 (24%) patients with ‘low' ASS1 and 374 (76%) patients with ‘high' ASS1 expression. (B) ASS1 mRNA expression Z‐scores versus ASS1 methylation status. (C) Kaplan–Meier plot analysis in patients with low versus high expression of ASS1 mRNA. (D) Platinum sensitivity status in patients with low and high ASS1 mRNA expression.
Figure S7. Analysis of ASS1 expression in ovarian serous carcinoma in the TCGA Affymetrix dataset. The Human Genome U133A Affymetrix array consisting of 594 serous ovarian carcinoma samples was analysed using the Oncomine portal. The Y axis displays relative ASS1 mRNA levels. The number of individual samples in each group on the X axis is indicated in parentheses.
Figure S8. Analysis of ASS1 protein levels and survival in serous ovarian carcinoma. (A) Pie chart indicating the percentage of serous ovarian carcinomas with tissue microarray immunohistochemistry scores 0, 1, 2 and 3. (B) Kaplan–Meier survival curves comparing patients with a score of 3 (blue) versus patients with scores of 0, 1 and 2 (red).
Acknowledgements
We thank Fai Chung in the Department of Pathology and Laboratory Medicine for immunohistochemical staining with the ASS1 antibody; Hang Tran for technical assistance; and Kristy Daniels for assistance in the preparation of the manuscript. This work was supported by the Pacific Ovarian Cancer Research Consortium Developmental Grant P50 CA083636 to SO and the Specimen Core Grant P50 CA083636 to BYK. SO is also supported by grants from the Margaret E. Early Medical Research Trust, the National Center for Advancing Translational Sciences (UL1TR000124), the American Cancer Society (RSG‐10‐252‐01‐TBG) and the Department of Defense Ovarian Cancer Clinical Translational Leverage Award (W81XWH‐13‐OCRP‐TLA). DC is supported by the Ovarian Cancer Research Fund Ann Schreiber Mentored Investigator Award and the University of California Office of the President's Tobacco‐Related Disease Research Program.
References
- 1. Michel T. R is for Arginine: metabolism of arginine takes off again, in new directions. Circulation 2013; 128: 1400–1404. [DOI] [PMC free article] [PubMed] [Google Scholar]
- 2. Gilroy E. The influence of arginine upon the growth rate of a transplantable tumour in the mouse. Biochem J 1930; 24: 589–595. [DOI] [PMC free article] [PubMed] [Google Scholar]
- 3. Gonzalez GG, Byus CV. Effect of dietary arginine restriction upon ornithine and polyamine metabolism during two‐stage epidermal carcinogenesis in the mouse. Cancer Res 1991; 51: 2932–2939. [PubMed] [Google Scholar]
- 4. Yeatman TJ, Risley GL, Brunson ME. Depletion of dietary arginine inhibits growth of metastatic tumor. Arch Surg 1991; 126: 1376–1381; discussion 1381–1372. [DOI] [PubMed] [Google Scholar]
- 5. Yerushalmi HF, Besselsen DG, Ignatenko NA, et al. Role of polyamines in arginine‐dependent colon carcinogenesis in Apc(Min) (/+) mice. Mol Carcinog 2006; 45: 764–773. [DOI] [PubMed] [Google Scholar]
- 6. Levillain O. Expression and function of arginine‐producing and consuming‐enzymes in the kidney. Amino Acids 2012; 42: 1237–1252. [DOI] [PubMed] [Google Scholar]
- 7. Morel F, Hus‐Citharel A, Levillain O. Biochemical heterogeneity of arginine metabolism along kidney proximal tubules. Kidney Int 1996; 49: 1608–1610. [DOI] [PubMed] [Google Scholar]
- 8. Delage B, Fennell DA, Nicholson L, et al. Arginine deprivation and argininosuccinate synthetase expression in the treatment of cancer. Int J Cancer 2010; 126: 2762–2772. [DOI] [PubMed] [Google Scholar]
- 9. Husson A, Brasse‐Lagnel C, Fairand A, et al. Argininosuccinate synthetase from the urea cycle to the citrulline‐NO cycle. Eur J Biochem 2003; 270: 1887–1899. [DOI] [PubMed] [Google Scholar]
- 10. Bowles TL, Kim R, Galante J, et al. Pancreatic cancer cell lines deficient in argininosuccinate synthetase are sensitive to arginine deprivation by arginine deiminase. Int J Cancer 2008; 123: 1950–1955. [DOI] [PMC free article] [PubMed] [Google Scholar]
- 11. Delage B, Luong P, Maharaj L, et al. Promoter methylation of argininosuccinate synthetase‐1 sensitises lymphomas to arginine deiminase treatment, autophagy and caspase‐dependent apoptosis. Cell Death Dis 2012; 3: e342. [DOI] [PMC free article] [PubMed] [Google Scholar]
- 12. Dillon BJ, Prieto VG, Curley SA, et al. Incidence and distribution of argininosuccinate synthetase deficiency in human cancers: a method for identifying cancers sensitive to arginine deprivation. Cancer 2004; 100: 826–833. [DOI] [PubMed] [Google Scholar]
- 13. Ensor CM, Holtsberg FW, Bomalaski JS, et al. Pegylated arginine deiminase (ADI‐SS PEG20,000 mw) inhibits human melanomas and hepatocellular carcinomas in vitro and in vivo. Cancer Res 2002; 62: 5443–5450. [PubMed] [Google Scholar]
- 14. Feun LG, Marini A, Walker G, et al. Negative argininosuccinate synthetase expression in melanoma tumours may predict clinical benefit from arginine‐depleting therapy with pegylated arginine deiminase. Br J Cancer 2012; 106: 1481–1485. [DOI] [PMC free article] [PubMed] [Google Scholar]
- 15. Kelly MP, Jungbluth AA, Wu BW, et al. Arginine deiminase PEG20 inhibits growth of small cell lung cancers lacking expression of argininosuccinate synthetase. Br J Cancer 2012; 106: 324–332. [DOI] [PMC free article] [PubMed] [Google Scholar]
- 16. Kim RH, Coates JM, Bowles TL, et al. Arginine deiminase as a novel therapy for prostate cancer induces autophagy and caspase‐independent apoptosis. Cancer Res 2009; 69: 700–708. [DOI] [PMC free article] [PubMed] [Google Scholar]
- 17. Kobayashi E, Masuda M, Nakayama R, et al. Reduced argininosuccinate synthetase is a predictive biomarker for the development of pulmonary metastasis in patients with osteosarcoma. Mol Cancer Ther 2010; 9: 535–544. [DOI] [PubMed] [Google Scholar]
- 18. Kuo MT, Savaraj N, Feun LG. Targeted cellular metabolism for cancer chemotherapy with recombinant arginine‐degrading enzymes. Oncotarget 2010; 1: 246–251. [DOI] [PMC free article] [PubMed] [Google Scholar]
- 19. Sugimura K, Ohno T, Kusuyama T, et al. High sensitivity of human melanoma cell lines to the growth inhibitory activity of mycoplasmal arginine deiminase in vitro. Melanoma Res 1992; 2: 191–196. [DOI] [PubMed] [Google Scholar]
- 20. Szlosarek PW, Klabatsa A, Pallaska A, et al. In vivo loss of expression of argininosuccinate synthetase in malignant pleural mesothelioma is a biomarker for susceptibility to arginine depletion. Clin Cancer Res 2006; 12: 7126–7131. [DOI] [PubMed] [Google Scholar]
- 21. Yoon CY, Shim YJ, Kim EH, et al. Renal cell carcinoma does not express argininosuccinate synthetase and is highly sensitive to arginine deprivation via arginine deiminase. Int J Cancer 2007; 120: 897–905. [DOI] [PubMed] [Google Scholar]
- 22. Huang HY, Wu WR, Wang YH, et al. ASS1 as a novel tumor suppressor gene in myxofibrosarcomas: aberrant loss via epigenetic DNA methylation confers aggressive phenotypes, negative prognostic impact, and therapeutic relevance. Clin Cancer Res 2013; 19: 2861–2872. [DOI] [PubMed] [Google Scholar]
- 23. Allen MD, Luong P, Hudson C, et al. Prognostic and therapeutic impact of argininosuccinate synthetase 1 control in bladder cancer as monitored longitudinally by PET imaging. Cancer Res 2014; 74: 896–907. [DOI] [PubMed] [Google Scholar]
- 24. Haines RJ, Pendleton LC, Eichler DC. Argininosuccinate synthase: at the center of arginine metabolism. Int J Biochem Mol Biol 2011; 2: 8–23. [PMC free article] [PubMed] [Google Scholar]
- 25. Feun L, You M, Wu CJ, et al. Arginine deprivation as a targeted therapy for cancer. Curr Pharm Des 2008; 14: 1049–1057. [DOI] [PMC free article] [PubMed] [Google Scholar]
- 26. Wheatley DN, Campbell E. Arginine deprivation, growth inhibition and tumour cell death: 3. Deficient utilisation of citrulline by malignant cells. Br J Cancer 2003; 89: 573–576. [DOI] [PMC free article] [PubMed] [Google Scholar]
- 27. Miyazaki K, Takaku H, Umeda M, et al. Potent growth inhibition of human tumor cells in culture by arginine deiminase purified from a culture medium of a mycoplasma‐infected cell line. Cancer Res 1990; 50: 4522–4527. [PubMed] [Google Scholar]
- 28. Ascierto PA, Scala S, Castello G, et al. Pegylated arginine deiminase treatment of patients with metastatic melanoma: results from phase I and II studies. J Clin Oncol 2005; 23: 7660–7668. [DOI] [PubMed] [Google Scholar]
- 29. Izzo F, Marra P, Beneduce G, et al. Pegylated arginine deiminase treatment of patients with unresectable hepatocellular carcinoma: results from phase I/II studies. J Clin Oncol 2004; 22: 1815–1822. [DOI] [PubMed] [Google Scholar]
- 30. Glazer ES, Piccirillo M, Albino V, et al. Phase II study of pegylated arginine deiminase for nonresectable and metastatic hepatocellular carcinoma. J Clin Oncol 2010; 28: 2220–2226. [DOI] [PubMed] [Google Scholar]
- 31. Yang TS, Lu SN, Chao Y, et al. A randomised phase II study of pegylated arginine deiminase (ADI‐PEG 20) in Asian advanced hepatocellular carcinoma patients. Br J Cancer 2010; 103: 954–960. [DOI] [PMC free article] [PubMed] [Google Scholar]
- 32. Szlosarek PW, Luong P, Phillips MM, et al. Metabolic response to pegylated arginine deiminase in mesothelioma with promoter methylation of argininosuccinate synthetase. J Clin Oncol 2013; 31: e111–e113. [DOI] [PubMed] [Google Scholar]
- 33. Szlosarek PW, Grimshaw MJ, Wilbanks GD, et al. Aberrant regulation of argininosuccinate synthetase by TNF‐alpha in human epithelial ovarian cancer. Int J Cancer 2007; 121: 6–11. [DOI] [PubMed] [Google Scholar]
- 34. Helleman J, Jansen MP, Span PN, et al. Molecular profiling of platinum resistant ovarian cancer. Int J Cancer 2006; 118: 1963–1971. [DOI] [PubMed] [Google Scholar]
- 35. Nicholson LJ, Smith PR, Hiller L, et al. Epigenetic silencing of argininosuccinate synthetase confers resistance to platinum‐induced cell death but collateral sensitivity to arginine auxotrophy in ovarian cancer. Int J Cancer 2009; 125: 1454–1463. [DOI] [PubMed] [Google Scholar]
- 36. L'Esperance S, Popa I, Bachvarova M, et al. Gene expression profiling of paired ovarian tumors obtained prior to and following adjuvant chemotherapy: molecular signatures of chemoresistant tumors. Int J Oncol 2006; 29: 5–24. [PubMed] [Google Scholar]
- 37. del Carmen MG, Birrer M, Schorge JO. Clear cell carcinoma of the ovary: a review of the literature. Gynecol Oncol 2012; 126: 481–490. [DOI] [PubMed] [Google Scholar]
- 38. Hess V, A'Hern R, Nasiri N, et al. Mucinous epithelial ovarian cancer: a separate entity requiring specific treatment. J Clin Oncol 2004; 22: 1040–1044. [DOI] [PubMed] [Google Scholar]
- 39. Gozo MC, Aspuria PJ, Cheon DJ, et al. Foxc2 induces Wnt4 and Bmp4 expression during muscle regeneration and osteogenesis. Cell Death Differ 2013; 20: 1031–1042. [DOI] [PMC free article] [PubMed] [Google Scholar]
- 40. TCGA . Integrated genomic analyses of ovarian carcinoma. Nature 2011; 474: 609–615. [DOI] [PMC free article] [PubMed] [Google Scholar]
- 41. Auersperg N. Ovarian surface epithelium as a source of ovarian cancers: unwarranted speculation or evidence‐based hypothesis? Gynecol Oncol 2013; 130: 246–251. [DOI] [PubMed] [Google Scholar]
- 42. Kurman RJ, Shih Ie M. Molecular pathogenesis and extraovarian origin of epithelial ovarian cancer—shifting the paradigm. Hum Pathol 2011; 42: 918–931. [DOI] [PMC free article] [PubMed] [Google Scholar]
- 43. Okamura H, Katabuchi H. Detailed morphology of human ovarian surface epithelium focusing on its metaplastic and neoplastic capability. Ital J Anat Embryol 2001; 106: 263–276. [PubMed] [Google Scholar]
- 44. Scully RE. Pathology of ovarian cancer precursors. J Cell Biochem Suppl 1995; 23: 208–218. [DOI] [PubMed] [Google Scholar]
- 45. Lee Y, Miron A, Drapkin R, et al. A candidate precursor to serous carcinoma that originates in the distal fallopian tube. J Pathol 2007; 211: 26–35. [DOI] [PubMed] [Google Scholar]
- 46. Lim D, Oliva E. Precursors and pathogenesis of ovarian carcinoma. Pathology 2013; 45: 229–242. [DOI] [PubMed] [Google Scholar]
- 47. Kurman RJ. Origin and molecular pathogenesis of ovarian high‐grade serous carcinoma. Ann Oncol 2013; 24 Suppl 10: x16–x21. [DOI] [PubMed] [Google Scholar]
- 48. Nik NN, Vang R, Shih Ie M, et al. Origin and pathogenesis of pelvic (ovarian, tubal, and primary peritoneal) serous carcinoma. Annu Rev Pathol 2014; 9: 27–45. [DOI] [PubMed] [Google Scholar]
- 49. Vang R, Shih Ie M, Kurman RJ. Fallopian tube precursors of ovarian low‐ and high‐grade serous neoplasms. Histopathology 2013; 62: 44–58. [DOI] [PubMed] [Google Scholar]
- 50. Anglesio MS, Arnold JM, George J, et al. Mutation of ERBB2 provides a novel alternative mechanism for the ubiquitous activation of RAS‐MAPK in ovarian serous low malignant potential tumors. Mol Cancer Res 2008; 6: 1678–1690. [DOI] [PMC free article] [PubMed] [Google Scholar]
- 51. Gyorffy B, Lanczky A, Szallasi Z. Implementing an online tool for genome‐wide validation of survival‐associated biomarkers in ovarian‐cancer using microarray data from 1287 patients. Endocr Relat Cancer 2012; 19: 197–208. [DOI] [PubMed] [Google Scholar]
- 52. Cerami E, Gao J, Dogrusoz U, et al. The cBio cancer genomics portal: an open platform for exploring multidimensional cancer genomics data. Cancer Discov 2012; 2: 401–404. [DOI] [PMC free article] [PubMed] [Google Scholar]
- 53. Barretina J, Caponigro G, Stransky N, et al. The Cancer Cell Line Encyclopedia enables predictive modelling of anticancer drug sensitivity. Nature 2012; 483: 603–607. [DOI] [PMC free article] [PubMed] [Google Scholar]
- 54. Barcena C, Oliva E. WT1 expression in the female genital tract. Adv Anat Pathol 2011; 18: 454–465. [DOI] [PubMed] [Google Scholar]
- 55. Liliac L, Carcangiu ML, Canevari S, et al. The value of PAX8 and WT1 molecules in ovarian cancer diagnosis. Rom J Morphol Embryol 2013; 54: 17–27. [PubMed] [Google Scholar]
Associated Data
This section collects any data citations, data availability statements, or supplementary materials included in this article.
Supplementary Materials
The following supplementary material may be found online.
Table S1. ASS1 mRNA expression levels and clinical information for 12 matched primary and recurrent ovarian serous carcinomas in the TCGA dataset.
Table S2. ASS1 protein immunopositivity and clinical information for 27 matched primary and recurrent ovarian serous carcinomas.
Figure S1. Comparison of ASS1 mRNA levels between normal tissues and serous ovarian cancers in multiple datasets. The figure is compiled from publicly available graphs of data analysed by the software provided by Oncomine. The Y axis shows relative ASS1 mRNA levels. The number of individual samples in each group on the X axis is indicated in parentheses. The software algorithms for calculating the p‐value and t‐test are described in the ‘Overview of Oncomine' document, which is available online at www.oncomine.org.
Figure S2. Immunohistochemical detection of ASS1 protein in normal tissues. (A) Liver, (B) fetal kidney and (C) blood vessels. Scale bar = 100 µm.
Figure S3. Immunohistochemical detection of the ASS1 protein in the normal endometrium and endometriosis. (A) Proliferative endometrium. (B) Secretory endometrium. (C) Endometriosis. The images are representative of staining patterns in six women with normal endometria and six women with endometriosis. ESC, endometrial stromal cells; EEC, endometrial epithelial cells; EC, endothelial cells. Scale bar = 50 µm.
Figure S4. Comparison of ASS1 mRNA levels in low‐grade and high‐grade serous ovarian carcinomas. ASS1 levels were compared in 90 serous ovarian carcinomas grouped by grade, stage, and presence of KRAS, BRAF or ERBB2 mutations using the Oncomine portal. The Y axis shows relative ASS1 mRNA levels. The number of individual samples in each group on the X axis is indicated in parentheses.
Figure S5. Correlation between ASS1 mRNA expression and survival using the Kaplan–Meier plotter tool. Ten combined ovarian cancer datasets were used to generate Kaplan–Meier survival plots using the KM plotter tool (http://kmplot.com/analysis/index.php?p=service&cancer=ovar). Patients were split by the median or software‐calculated auto best cutoff expression levels of ASS1 mRNA (probe 207076_s_at).
Figure S6. Analysis of ASS1 expression in high‐grade ovarian serous carcinoma in the TCGA Agilent microarray dataset. The Agilent microarray of 489 cases of serous ovarian carcinoma in the TCGA dataset was analysed using the cBio Cancer Genomics Portal (http://www.cbioportal.org). (A) ASS1 mRNA expression Z‐scores versus ASS1 copy number. By setting the mRNA expression Z‐score threshold to −1.0, the patients were divided into two groups: 115 (24%) patients with ‘low' ASS1 and 374 (76%) patients with ‘high' ASS1 expression. (B) ASS1 mRNA expression Z‐scores versus ASS1 methylation status. (C) Kaplan–Meier plot analysis in patients with low versus high expression of ASS1 mRNA. (D) Platinum sensitivity status in patients with low and high ASS1 mRNA expression.
Figure S7. Analysis of ASS1 expression in ovarian serous carcinoma in the TCGA Affymetrix dataset. The Human Genome U133A Affymetrix array consisting of 594 serous ovarian carcinoma samples was analysed using the Oncomine portal. The Y axis displays relative ASS1 mRNA levels. The number of individual samples in each group on the X axis is indicated in parentheses.
Figure S8. Analysis of ASS1 protein levels and survival in serous ovarian carcinoma. (A) Pie chart indicating the percentage of serous ovarian carcinomas with tissue microarray immunohistochemistry scores 0, 1, 2 and 3. (B) Kaplan–Meier survival curves comparing patients with a score of 3 (blue) versus patients with scores of 0, 1 and 2 (red).