

Abstract
Extraskeletal osteosarcoma (ESOSA) is a rare soft tissue neoplasm representing <5% of osteosarcomas and <1% of all soft‐tissue sarcomas. Herein, we investigate the clinicopathological and molecular features of ESOSA and explore potential parameters that may affect outcome. Thirty‐two cases were retrieved and histomorphology was reviewed. Clinical history and follow‐up were obtained through electronic record review. DNA from formalin‐fixed paraffin‐embedded (FFPE) tissue was extracted and processed from 27 cases. Genome‐wide DNA copy number (CN) alterations and allelic imbalances were analyzed by single nucleotide polymorphism array using Affymetrix OncoScan FFPE Assay. Massive high‐throughput deep parallel sequencing was performed using a customized panel targeting 410 cancer genes. Log rank, Fisher's exact test and Cox proportional hazards were used for statistical analysis. In this series of 32 patients (male n = 12, female n = 20), the average age was 66 years (19–93) and median follow up was 24 months (range 6–120 months). Frequent genomic alterations included CN losses in tumour suppressor genes including CDKN2A (70%), TP53 (56%) and RB1 (49%). Mutations affecting methylation/demethylation, chromatin remodeling and WNT/SHH pathways were identified in 40%, 27%, and 27%, respectively. PIK3CA and TERT promoter variant mutations were identified in 11% of the cases. Cases harbouring simultaneous TP53 and RB1 biallelic CN losses were associated with worse overall survival and local recurrence (p = 0.04, p = 0.02, respectively). CDKN2A losses and positive margins were also associated with worse overall survival (p = 0.002; p = 0.03, respectively). Our findings suggest that age above 60, positive margin status, simultaneous biallelic TP53 and RB1 losses and CDKN2A loss are associated with a worse outcome in ESOSA. Comparison between conventional paediatric osteosarcoma and ESOSA shows that, while both share genetic similarities, there are notable dissimilarities and mechanistic differences in the molecular pathways involved in ESOSA.
Keywords: extraskeletal osteosarcoma, osteosarcoma, next generation sequencing, SNP array
Introduction
Extraskeletal osteosarcoma (ESOSA) is an extremely rare malignant soft‐tissue neoplasm that produces osteoid/bone in association with a chondroblastic component, at times without demonstrable attachments to bone or periosteum 1. ESOSA represents 2% to 5% of osteosarcomas and <1% of all soft‐tissue sarcomas with a predilection for older patients; it typically occurs in the sixth decade 2. Little is known about the clinical and pathological features that may affect outcome in ESOSA. Previous studies investigating clinicopathological factors have shown that size less than 5 cm is associated with a better prognosis 3. More recent studies showed better survival in patients with superficial tumours and negative margins at resection 4. Other groups have reported that size larger than 10 cm and older age are significantly associated with worse outcome 5. In general, outcomes have historically been poor, with high rates of metastatic disease and overall survival at 5 years ranging from 25% to 77% 6, 7. Unlike primary osteosarcoma of bone, which arises predominantly in children and adolescents and where response to preoperative combination chemotherapy is the strongest predictor of overall survival 8, the role of chemotherapy and/or radiation in ESOSA remains controversial. Prospective studies assessing these regimens are lacking mainly due to the rarity of this tumour. While some authors have reported outcome benefit with adjuvant chemotherapy in ESOSA, a similar association with death due to disease or disease‐free survival was not found in other studies 7, 8. Surgical resection with clear margins remains the mainstay of treatment. Recent advances in molecular technologies such as massively parallel high throughput sequencing (including whole genome and targeted exome sequencing), cytogenomic single nucleotide polymorphism (SNP) arrays and comparative genomic hybridization have enabled investigators to define the molecular landscape of conventional paediatric osteosarcoma 9, 10. Apart from anecdotal reports, the molecular landscape of ESOSA has not been investigated. These reports include three separate cases of ESOSA where two cases showed highly complex genomic aberrations 11, one moderate hyperdiploidy with few chromosomal aberrations 12 and one primary ESOSA of the lung showing 1q gain, 8q gain, 13q and 15q loss 13. Herein, we investigated potential clinicopathological and molecular factors affecting clinical outcome in a series of ESOSAs that were collected over a 23‐year period at our institution. In order to define the molecular landscape of ESOSA, we used parallel testing on cytogenomic SNP microarray and hybrid capture‐based next generation sequencing platforms. Specifically, we focused on identifying recurrent copy number (CN) variants, somatic mutations and structural variants. Recurrent molecular genetic events (both structural and mutational) were correlated with clinical outcome.
Material and methods
Patient selection and pathological review
After institutional review board approval, 32 cases of ESOSA were accrued by searching through our pathology database to identify patients with ESOSA treated at our medical centre between July 1992 and July 2015 inclusive. All patients underwent treatment and resections at our institution. Two expert bone and soft‐tissue pathologists reviewed all cases and confirmed the diagnosis. Twenty‐seven cases had sufficient material for molecular testing in parallel on the SNP array using Affymetrix OncoScan FFPE Assay (Affymetrix, CA, USA) and next generation sequencing platforms.
Clinical follow‐up and statistical analysis
Clinical follow‐up information was obtained from hospital electronic records in 32 patients. One patient was lost to follow‐up. This patient was excluded from further statistical analysis. Fisher's exact test was used to determine correlations between different clinical and pathological variables and genetic findings. Survival curves were constructed using the methods of Kaplan and Meier with local recurrence/metastasis‐free survival, disease‐free survival and overall survival as end points. Time to these events was calculated beginning with the date of initial surgery. Cox proportional hazard models were used for multivariate analysis of variable that showed significance on univariate analysis. Patients were censored accordingly. All statistical analyses were performed using SPSS statistics (version 22.0).
SNP array analysis
Genomic DNA was extracted from FFPE tumour tissues using Qiagen DNeasy Tissue & Blood kit. Genome‐wide DNA CN alterations and allelic imbalances were analysed by SNP array using Affymetrix OncoScan FFPE Assay with 80 ng input of tumour genomic DNA for each sample. Processing of samples was performed according to the manufacturer's guidelines (Affymetrix). Assay data were processed and analysed by the combination of OncoScan Console software and OncoScan Nexus Express software. Array data were manually reviewed and consensus was reached for alterations not automatically called by the software or false alterations due to the highly fragmented nature of the tumour genome. In terms of the data analysis, we used allele peak information to help with the determination of diploid genomic regions, if needed. As such, we felt comfortable to make absolute CN calls.
Targeted exon high throughput massive parallel sequencing
The tumour DNA samples used for SNP‐array analysis were also screened for gene mutations in 410 key cancer‐associated genes (gene list with genomic coordinates for the covered areas are available in online supplementary material 1) using solution‐phase exon capture and next generation sequencing (MSK‐IMPACT, MSK‐Integrated Mutation Profiling of Actionable Cancer Targets) 14. MSK‐IMPACT is designed to focus on somatic mutation detection by filtering out alterations also present in matched normal samples. Matching normal with enough material for MSK‐IMPACT study was available for all cases and the normal DNAs were sequenced in parallel with the corresponding tumour DNAs. Additionally, a mixture of pooled FFPE normal DNA was used as unmatched normal control for mutation calling. Briefly, barcoded sequences are prepared and captured by hybridization with custom biotinylated DNA probes for all exons and selected introns of 410 oncogenes and tumour suppressor genes using 100–250 ng of input DNA. Captured libraries were sequenced on an Illumina HiSeq (2 × 100bp paired‐ends read). Bioinformatics analysis included alignment of reads to the human genome (hg19) using BWA‐MEM (v 0.7.5a); duplicate read removal, base recalibration and Indel realignment using GATK (v 2.6‐5) following best practices; variant calling using MuTect (v 1.1.4) for single nucleotide variants and Somatic Indel Detector (GATK 2.3‐9) for indels. Annovar was used to annotate the variants for cDNA and amino acid changes as well as presence in dbSNP database (v137) and COSMIC database (v68) and 1000 genomes minor allele frequencies.
Unsupervised cluster analysis
Samples were scored based on copy‐number loss, deleterious mutations or monoallelic mutations for recurrent alterations in tumour suppressor genes and/or oncogenes to generate a matrix. Six tumour suppressor genes (TP53, RB1, CDKN2A, NF1, PTEN and LSAMP) showed recurrent events and were included in the final matrix. Hierarchical clustering analysis was performed on the score matrix using the measure of similarity based on the biological impact of the genomic alteration (ie, a biallelic inactivation event is scored similarly to a monoallelic deletion with a simultaneous inactivating mutation on the other allele). R (v 3.0.2) was used to parse the data and rendered graphically using the heatmap tool.
Immunohistochemistry
Five‐micron‐thick, 10% formalin‐fixed, paraffin‐embedded tissue sections were deparaffinized, rehydrated and washed in xylene, graded alcohols and distilled water, respectively. Immunostaining for p53 (mouse monoclonal antibody, dilution 1:500; Santa Cruz Biotechnology Inc., Dallas, TX, USA) and pRB1 (mouse monoclonal antibody, dilution 1:50; Novocastra, Leica biosystems, IL, USA) were performed using commercially available antibodies. On‐board epitope retrieval was accomplished according to the manufacturers’ instructions. Overnight incubation was performed with the primary antibody at 41°C. Subsequent incubation was performed for 1 h at room temperature with a goat biotinylated secondary antibody (dilution 1:500; Vector Laboratories Inc., Burlingame, CA, USA). Finally, incubation with ABC detection kit (Vector Laboratories Inc.) for 30 min and the chromogen diaminobenzidine tetrachloride for 5 min was performed to visualize the antibody–antigen complex. Appropriate control slides were prepared.
Results
Clinical and pathological features
Over a 23‐year period, we identified 32 patients; one patient was lost to follow up and was excluded from further survival analysis. Twenty seven cases had sufficient pathological material and were tested in parallel on a SNP‐array platform using the Affymetrix OncoScan FFPE Assay and a NGS platform (MSK‐IMPACT). Clinicopathological data on the patients and tumours in the study group are shown in Table 1. Tumour size ranged from 2 to 9 cm. Tumours were either located in the extremities (65%) or were axial (35%). Among the 32 cases, eight (26%) had microscopically positive margins defined as tumour present at or within 0.1 cm from the inked margin. A variety of histological subtypes were present:
Table 1.
Summary of clinicopathological findings
| Median age (range) | 66 (19–93) |
| Average tumour size, cm (range) | 8.45 (2–19) |
| Stage | |
| IIA | 7 (20%) |
| III | 24 (75%) |
| IV | 1 (3%) |
| Site (%) | |
| Extremities | 20 (62%) |
| Axial | 12 (38%) |
| Histological subtype (%) | |
| Giant cell rich | 8 (25%) |
| Spindle/Pleomorphic | 16 (50%) |
| Osteoblastic and/or chondroblastic | 8 (25%) |
| Treatment modality (%) | |
| Surgery | 13 (40%) |
| Surgery + chemotherapy and/or radiation | 19 (60%) |
| Margin status (%) | |
| Negative | 24 (75%) |
| Positive | 8 (25%) |
| Outcome (%) | |
| Death from disease | 10 (33%) |
| Metastasis/Local recurrence | 12 (39%) |
| No evidence of disease | 15 (48%) |
Osteoblastic conventional subtype.
Spindle/fibroblastic subtype.
Giant cell‐rich subtype showing neoplastic stroma rich with osteoclast‐like giant cells.
Chondroblastic subtype showing hypercellular hyaline cartilage
Pleomorphic sarcoma histology.
All cases exhibited unequivocal osteoid matrix, which was more than a focal finding enabling the diagnosis of ESOSA. None of the cases contained a well‐differentiated liposarcoma component. This was a pertinent negative finding to rule out the possibility of a dedifferentiated liposarcoma. Cases showed frequent overlap between the different histological subtypes mainly between spindle/pleomorphic and chondroblastic/osteoblastic subtypes (Figure 1). Classification of different categories was based on the most predominant subtype.
Figure 1.
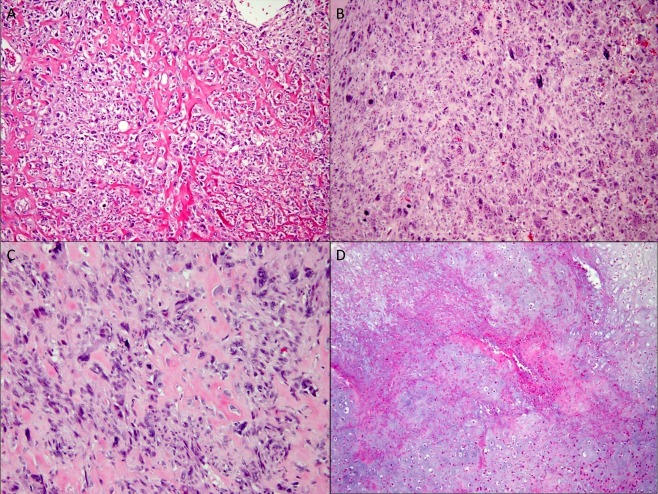
Morphological subtypes of ESOSA A‐D, 20× magnification. (A) osteoblastic subtype showing epithelioid cells surrounding lacey bone formation. (B) Giant cell rich subtype showing numerous osteoclast‐like giant cells. (C) Pleomorphic subtype with large cells and severe atypia. (D) Chondroblastic subtype with hypercellular cartilaginous areas with necrosis.
SNP array results
SNP array revealed a highly complex genomic profile with numerous CN aberrations including CN losses and gains with an average of 16 chromosomal alterations/tumour (range 3–35 chromosomal alterations; Figure 2). Recurrent chromosomal CN aberrations included CN losses affecting chromosomes 13q n = 16 (60%), 17p n = 11 (40%), 9p n = 14 (52%), 11p n = 10 (37%), and CN gains involving chromosome 8q n = 8 (30%), 19p n = 9 (33%) (online supplementary material 2). Focused analysis of candidate tumour suppressor genes and oncogenes (which are usually involved in conventional paediatric osteosarcoma) 15, 16, 17 revealed CN losses in the following tumour suppressor genes: CDKN2A (70%), TP53 (56%), RB1 (49%), PTEN (37%), NF1 (27%), LSAMP (19%) including numerous biallelic CN losses, monoallelic CN losses and CN‐LOH. Previously described CN gains and amplifications in oncogenes involved in conventional paediatric OSA were also seen in our series with variable frequencies as follows: RUNX2 (25%), CDC5L (11%), COPS3 (19%), EGFR (15%), MDM2 (11%), CDK4 (11%) and PMP22 (10%) (online supplementary material 3) 15, 16, 17. All cases were evaluated for the absence or presence of chromothripsis. The definition of chromothripsis employed in this study is more than 10 breakpoints along the length of a chromosome arm or chromosome segment with CN changes between 2 and 3 stages (loss, normal ± gain). Only one case showed evidence of chromothripsis, which affected chromosome arms 1p and 10p.
Figure 2.
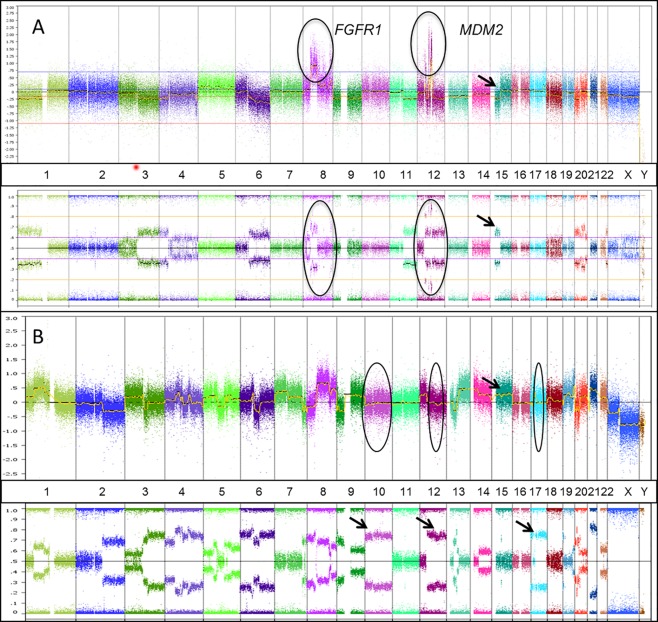
Cytogenomic SNP array of sample cases. (A) Sample case showing CN gains in FGFR1and MDM2 (chromosomes 8 and 12, respectively) shown on the CN track (circles in the upper track) and supported by deviation from the centre line on the B allele frequency SNP track (circles on lower track). Additionally, an example of CN loss is shown on chromosome 15 supported by the SNP track. B. Sample case showing a highly unstable genome with Copy Neutral Loss of Heterozygosity (CNLOH) on chromosomes 10, 12 and 17 (circles and corresponding arrows on the CN and allele tracks, respectively) in addition to other CN losses and gains (arrow highlights chromosome 15 CN gain on the upper track). Log 2 ratio of genomic CN is plotted on the y axis. Captured chromosomal regions are plotted on the x axis with numbers corresponding to chromosomes. Hybridization probes targeting the genomic loci of interest are represented by colour‐coded dots. The lower track represents the B‐allele frequency (BAF) enabling assessment of allelic imbalances.
NGS data analysis
Next generation sequencing analysis of 410 cancer‐associated genes showed a median coverage of 293.5X across all samples (Range 77–686X) with a median coverage of 431X across tumour samples and 131X across normal samples. Cases where normal tissue had suboptimal coverage <100X were analyzed unmatched (five cases) and matched to pooled FFPE normal DNA. A total of 92 mutations affecting 65 genes were detected across all samples. Further manual review confirmed a total of 77 mutations with potential biological impact (online supplementary material 4). Additionally, 93 CN events were detected across 19 samples. The CN number events were compared with the results obtained from SNP array data showing high concordance between the two platforms. All cases were evaluated for the absence or presence of kataegis by visual inspection of the mutation and CN signature. None of the studied cases revealed kataegis by visual inspection.
Recurrent mutational events in cancer related pathways
Gathering data from our NGS panel we identified recurrent mutational events occurring in genes affecting numerous cancer related pathways. The four major pathways involved included: (1) Tumour suppressor genes including cell cycle checkpoint genes in 65% of the cases (TP53, PTEN, RB1, NF1, SMARCA4), (2) Chromatin remodeling genes (ATRX, DAXX, BRCA1, DAXX2, CHECK2, ARID5B) in 40% of the cases, (3) Histone methylation and demethylation genes (BCOR, DNMT3A, MKK3) in 27% of the cases and (4) WNT and Sonic Hedghog pathways genes (AMER1, AXIN2, GSK3B, GLI1, NOTCH3) in 27% of the cases. The mutational variants included frame shift insertion/deletions (10%), nonsense stop codon mutations (10%), missense mutations (78%) and one TERT promoter variant (g.1295228 C>T). Missense mutations affecting tumour suppressor genes and other genes involved in the negative feedback of WNT pathways have damaging effects on the encoded proteins through substitutions with alterantive residues with different electric charges and hydrophilic/hydrophobic properties leading to abnormal protein folding and destabilization. These findings were further confirmed by querying research‐based predictive models POLYPHEN (http://genetics.bwh.harvard.edu/pph2/) and SIFT (http://sift.jcvi.org/). Using these prediction algorithms, 56 events (73%) showed a potential damaging effect on the protein function. Additional mutations affecting the helical loop (c.1490A>G, p.N497S) and kinase domain (c.3140A>G, p.H1047R) of PIK3CA were also identified.
Significant clinicopathological prognostic factors
Survival analysis using all pathological and clinical factors listed in Table 1 revealed that age above 60 years and positive margins were both associated with a worse overall survival and local recurrence (p = 0.0017 and p = 0.02, respectively) (Figure 3). Stage did not show any association with outcome. Multivariate analysis incorporating significant identified variables through univariate analysis (age, margin, CDKN2A loss) showed positive margin as an independent factor associated with a shorter overall survival and higher rate of local recurrence [HR = 8.34, 95% CI = (1.13, 61.42), p = 0.037] and [HR = 12,495% CI = (2.25, 68.79), p = 0.0004], respectively.
Figure 3.
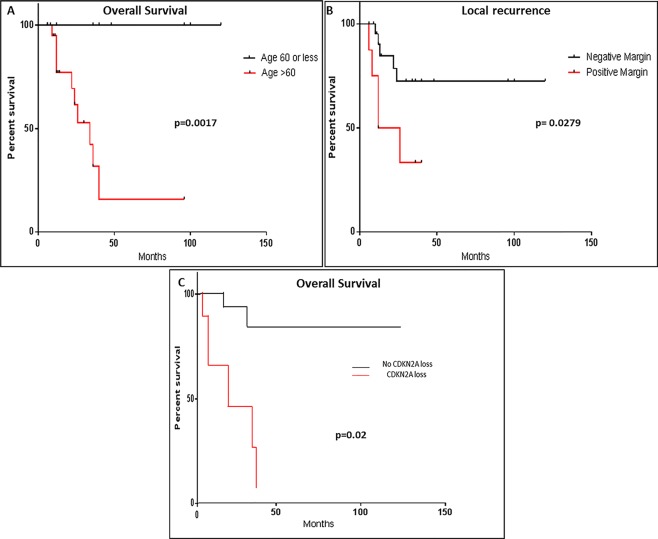
Clinicopathological factors affecting outcome. Kaplan–Meyer survival curves showing that (A) age above 60 years, (B) positive margin status, and (C) CDKN2A losses are associated with worse overall survival, local recurrence and overall survival (p = 0.0017, p = 0.00279, p = 0.02), respectively .
Single‐gene event correlation with outcome and morphology
CDKN2A loss (including biallelic, monoallelic and CN‐LOH) was associated with significantly worse overall survival in our patients (p = 0.002; Figure 3). Further outcome analysis including single‐gene CN aberrations (gains or losses) did not reveal any significant correlation with outcome with other aberrant genes. Additionally, the number of CN alterations per case did not correlate with outcome (ie, one versus two versus three). RB1 loss (including biallelic, monoallelic and CN‐LOH) showed a significant association with non‐giant cell morphology (ie, giant cell rich cases showed fewer RB1 losses) (p = 0.022).
Cluster analysis and gene event correlation with outcome
Unsupervised hierarchical clustering analysis of recurrent CN losses and mutations affecting tumour suppressor genes segregated cases in three major clusters (Figure 4):
Figure 4.
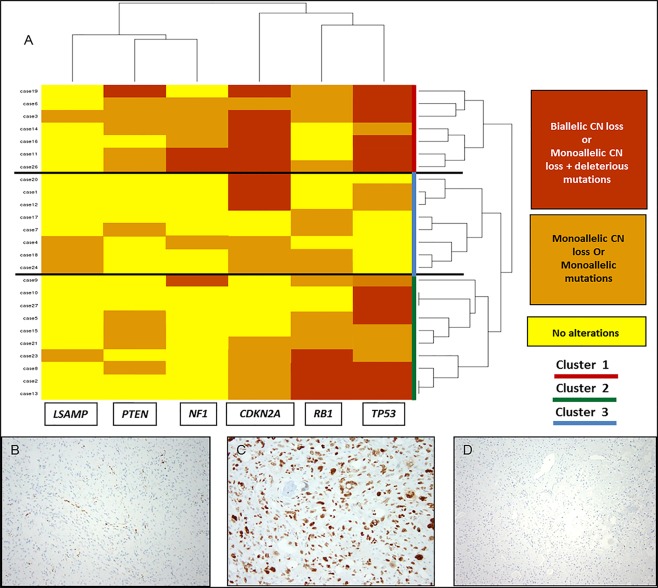
Cluster analysis of recurrent tumour suppressor gene events and examples of protein immunohistochemistry. (A) Cluster analysis showing the segregation of cases into three major clusters. Cluster 1 (red) shows frequent biallelic losses affecting CDKN2A/TP53. Cluster 2 shows frequent monoallelic losses affecting RB1 and/or TP53. Cluster 3 shows frequent biallelic losses of TP53 and RB1. The cluster analysis is based on unsupervised clustering using R software. (B) RB1 immunohistochemical stain showing loss of nuclear staining in the tumour cells with positive immunoreactivity within the vessels and non‐neoplastic tissue. (C) TP53 immunohistochemical stain in a case with monoallelic mutations of TP53 showing nuclear overexpression of the TP53 protein in tumour cells. (D) TP53 immunohistochemical stain in a case with biallelic CN losses in TP53 showing lack of protein expression in the tumour cells.
Cluster 1 with recurrent simultaneous biallelic inactivation of CDKN2A and TP53 (n = 7).
Cluster 2 with recurrent biallelic CN losses in CDKN2A and/or monoallelic losses or mutations in either TP53 or RB1 (n = 8).
Cluster 3 with recurrent simultaneous biallelic events (CN losses and/or mutations) affecting both TP53 and RB1 (n = 10).
Further outcome analysis showed that cluster 3 patients had a worse overall survival and higher local recurrence rates (p = 0.04 and p = 0.02, respectively) (Figure 5). Within this cluster (cluster 3) immunohistochemical studies showed high concordance with the genetic events detected in our cluster plot. Complete loss of nuclear RB protein expression in the lesional tissue and retained expression in the surrounding normal tissue was seen in all 10 cases tested. Similarly, cases with biallelic losses of TP53 (n = 6) showed complete loss of nuclear expression of the protein (similar to what is observed with homozygous p53 null mutation) in the lesional tissue. Cases with monoallelic CN losses or monoallelic mutations showed nuclear overexpression of the protein in the lesional tissue (n = 4) (Figure 4).
Figure 5.
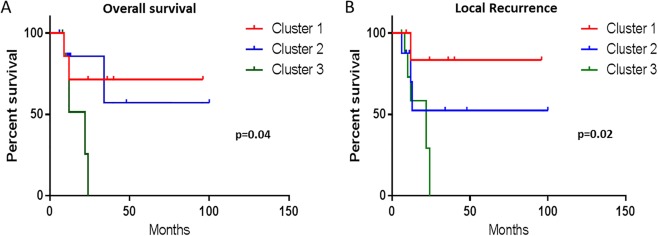
Correlation of cluster analysis with outcome. Kaplan–Meyer survival curves of cases from cluster 3 with biallelic TP53 and RB1 losses show worse overall survival and local recurrence compared to cases from Cluster 1 and Cluster 2 (p = 0.04, p = 0.02), respectively.
Discussion
ESOSA is a rare bone‐forming malignant soft‐tissue neoplasm. Due to its rarity, few comprehensive studies addressing both clinicopathological and molecular aspects of this entity exist. Furthermore, most of the reported studies have focused on conventional paediatric osteosarcoma due to its relatively high prevalence when compared to ESOSA. The molecular landscape of conventional paediatric osteosarcoma has been well elucidated using gene expression analysis, targeted exome sequencing and whole genome sequencing in several studies.
The CDKN2A locus, one of the widely studied loci in conventional paediatric osteosarcoma, contains the CDKN2A/p16 and CDKN2A/p14Arf genes 18. Small or large biallelic CN losses rather than promoter methylation seem to be among the driver genetic events underlying conventional osteosarcoma. Biallelic CN losses affecting the CDKN2A gene are seen in up to15% of conventional osteosarcomas 19. In our series, CDKN2A losses were seen in 70% of the cases; around half of which are biallelic losses (30% of our cases). This fact highlights the importance of this gene in ESOSA tumourigenesis and aggressiveness. This is further supported by the association we found between CDKN2A losses (biallelic and monoallelic) and worse overall survival in our cohort. This finding is expected as CDKN2A locus loss leads to escape from the cell cycle control by CDKN2A/p16, and blocks apoptosis by impairing the TP53 pathway via concomitant deletion of CDKN2A/p14ARF 18.
TP53 is a major tumour suppressor gene involved in a variety of human cancers. In our series, TP53 CN losses/deletions (mono and biallelic events) occurred in 56% of the cases, a frequency that is higher than that reported in conventional osteosarcoma (30–40%) 16, 18. Furthermore, among tumour suppressor genes, TP53 was the most commonly mutated gene with a frequency of 45%; this is significantly lower than that reported in conventional paediatric osteosarcoma (80–90%) 9. All of the detected mutations in the TP53 gene are either known truncating mutations including non‐sense mutations and frame shift deletions or common hotspot missense mutations including well known mutations at residues 273, 280 and 282. All mutational events were distributed in a non‐clustered manner across exons, 4, 5, 8 and 10.
Apart from investigating the molecular landscape of ESOSA, we sought specific molecular biomarkers (ie, gene events) that would serve as potential predictors for outcome in ESOSA patients. Our survival analysis suggests that patients whose tumours are in cluster 3, with frequent simultaneous biallelic inactivation of TP53 and RB1, have a worse outcome. This is not surprising as both of these genes are involved in cell cycle checkpoint control and determining cell fate. Both act in parallel on different phases of the mitotic cycle and are regulated by the products of CDKN2A (p14ARFand p16) 19. The high concordance between recurrent genetic events in cluster 3 (frequent simultaneous TP53 and RB1 deletions and/or mutations) with protein expression/loss by immunohistochemistry suggest that this cost effective and relatively cheap method could be used to identify ‘high risk’ patients based on our outcome analysis.
WNT and Sonic Hedgehog pathways are interesting pathways identified in our ESOSA series. Most of the damaging mutations identified occurred in genes such as AMER1, AXIN2 and GSK3B, which have regulatory function on the canonical WNT pathway leading to degradation of β catenin 20. The WNT pathway has been implicated in conventional osteosarcoma development 20, 21. Furthermore, significant crosstalk exists between the Sonic hedgehog (SHH) and WNT pathways. SHH protein binding to its receptor patched (PTCH) protein is thought to prevent normal inhibition by patched of smoothened (SMO). This leads to transcriptional activation and tumour growth 21. This finding highlights this pathway as a potential target for future therapies in advanced and metastatic ESOSA. Vismodegib, a cyclopamine‐based competitive antagonist of SMO, has been investigated in a Phase I/II clinical trial in a series of soft tissue sarcomas including ESOSA (ClinicalTrials.gov identifier NCT01154452); the results of this study are still pending 22. In our series, none of the cases showing TP53 mutations or events showed MDM2 amplification. This pattern of mutual exclusivity between TP53 and MDM2 is similar to that previously reported in conventional paediatric osteosarcoma 23, 24. Interestingly, the instability score reflected by the average number of chromosomal changes/alterations per tumour was significantly lower in cases lacking biallelic TP53 inactivation (ie, biallelic CN loss or monoallelic CN loss with mutation occurring on the other allele) (eight chromosomal alterations/tumour) compared to the overall group of tumours tested (average 16 chromosomal alterations/tumour) (p = 0.001) [95% CI: −10.48 to −5.52]. This finding is in line with what has been reported in conventional osteosarcoma where TP53 mutations have been associated with high levels of genomic instability. This is in contrast to MDM2 amplified cases, which showed less genomic instability 24.
Chromothripsis is a catastrophic event caused by numerous simultaneous breaks happening at once in confined short segments of the genome with subsequent rearrangements leading to disruption of numerous genes. It has been described in up to 25% of conventional psediatric osteosarcomas 23. In this series of ESOSA, we had only one case with chromothripsis, which affected chromosome arms 1p and 10p. Another known mechanism for catastrophic disruption is kataegis. Kataegis is a hyperemutational phenomenon defined by the presence of the following 25:
Enriched C→T and C→G substitutions at TpCpX trinucleotides.
The same class of nucleotide mutation occurring for contiguous stretches before switching to a different class.
Mutations within short stretches of the genome occurring on the same parental chromosome.
Clustering of heavily mutated short stretches of the genome at multiple scales.
Association of the hypermutated region with rearrangement breakpoints.
Recent work has highlighted the assessment of kataegis in cancer samples from high throughput sequencing data 26. In the analysis of the 410 gene panel, we observed some evidence of kataegis from the CN plot in other tumours such as breast cancer. By visual inspection of the dataset reported here, it appears that kataegis is not a common event in ESOSA as compared to paediatric conventional osteosarcoma.
Co‐amplification of MDM2 and CDK4 (12q13‐15, respectively) occurs frequently in parosteal osteosarcoma and only rarely in conventional osteosarcoma. Studies have reported a 12q13‐15 amplification frequency of 67% in parosteal osteosarcoma and 8–12% in conventional osteosarcoma (12%) 27. It is also postulated that some of these conventional osteosarcomas with 12q13‐15 amplicons could represent dedifferentiated low‐grade osteosarcoma 27. Among the three cases in our series with 12q13‐15 alterations, one case showed isolated amplification of MDM2. Although co‐amplification of CDK4 and MDM2 suggests that both genes are necessary for cancer progression, our finding and previously reported cases of isolated MDM2 amplification suggest that MDM2 alone could be a mediator of tumourigenesis in some ESOSA cases 20. All three cases also harboured additional genetic events including amplification of FGFR1 in two cases and TERT amplification in one case. No TP53 events were seen in these cases, but other tumour suppressor genes including PTEN, RB1 and CDKN2A showed evidence of monoallelic CN losses. Our findings suggest that MDM2 and CDK4 amplifications require additional cooperative genomic aberrations involving oncogenes or tumour suppressor genes that would lead to the development of the aggressive high‐grade morphotype seen in ESOSA. MDM2 amplification as seen in three cases in this series is potentially targetable with novel inhibitor therapies. There is an ongoing phase 1 clinical trial (ClinicalTrials.gov Identifier NCT01877382) investigating MDM2 inhibitors in solid tumours increasing the opportunity for alternative therapy in metastatic and advanced ESOSA cases that fail conventional chemotherapeutical regimens 22.
Other findings in our study included phosphoinositide‐3‐kinase (PI3K), catalytic, alpha polypeptide (PIK3CA) and telomerase reverse transcriptase (TERT) promoter variants, which were identified in 10% of our cases, respectively. Both of these mutations have been reported in many epithelial tumours (breast carcinoma, ovarian adenocarcinoma, papillary thyroid carcinoma, etc) and sarcomas including myxoid liposarcomas and solitary fibrous tumours, respectively 28, 29, 30. To the best of our knowledge, these mutations have not been previously reported in paediatric conventional osteosarcoma. In a recent targeted exon sequencing study, Choy et al demonstrated PIK3CA mutations in three cases of adult osteosarcomas involving the helical domain [E545K] and the kinase domain [H1047R] 31. The same helical domain [E545K] and kinase domain [H1047R] mutations have been reported in 14 to 18% in myxoid/round cell liposarcomas 30, 31. These findings suggest that, from a molecular standpoint, ESOSA shares molecular similarities to conventional paediatric osteosarcoma, adult osteosarcoma and possibly soft tissue sarcomas (Figure 6). The similarity between ESOSA and adult osteosarcoma is also reflected by their aggressive clinical course and lack of response to conventional chemotherapy in most of the cases. Detailed genotypic data on high‐grade adult soft tissue sarcomas are yet to be available for comparison.
Figure 6.
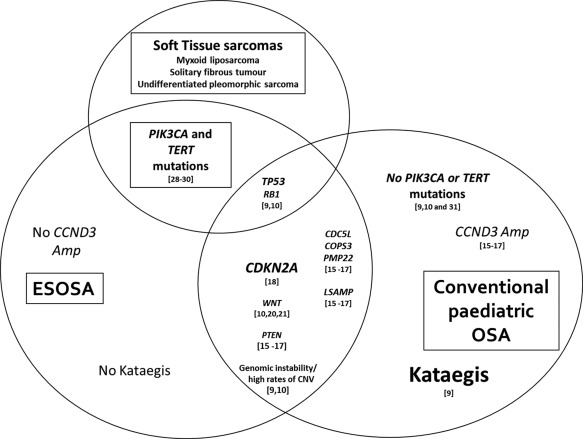
VENN diagram showing different possible logical relationships between ESOSA, paediatric osteosarcoma and soft tissue sarcomas based on the published literature and our current study.
In conclusion, ESOSA is a rare soft tissue neoplasm showing high genomic complexity similar to paediatric conventional osteosarcoma. Yet, significant genetic differences exist between these two entities. In spite of the size limitations of our study, we were able to identify specific targetable genes and pathways (Sonic Hedgehog, PIK3CA mutations) as well as potential aggressive molecular subgroups (ie, CDKN2A loss or Biallelic simultaneous losses of RB1 and TP53). These findings highlight the heterogeneity of ESOSA and provide an opportunity to stratify therapies (whether conventional or targeted) according to the risk factors generated by the mutational status.
Author contributions
GJ, LW, and MH contributed to the design, data analysis and manuscript preparation. JS executed molecular experiments. AZ, SM, WC and KN contributed to data analysis and statistical analysis. JH, LC and NA contributed to manuscript review and critique.
Supporting information
The following supplementary material may be found in the online version of this article:
Supplementary material 1
Supplementary material 2
Supplementary material 3
Supplementary material 4
Acknowledgements
This study is supported by Departmental Research & Development funding.
This study is supported by Departmental Research & Development funding. [MSK Cancer Center Support Grant/Core Grant (P30 CA008748)].
The authors have declared no conflict of interest.
References
- 1. Rosenberg AE. Extraskeletal osteosarcoma In WHO Classification of Tumors of Soft Tissue and Bone, Fletcher CDM, Bridge JA, Hogendoorn PCW, Mertens F. (eds), 4th edn. International Agency for Research on Cancer (IRAC): Lyon, France, 2013; 161–162. [Google Scholar]
- 2. McCarter MD, Lewis JJ, Antonescu CR, et al Extraskeletal osteosarcoma: analysis of outcome of a rare neoplasm. Sarcoma 2000;4: 119–123. [DOI] [PMC free article] [PubMed] [Google Scholar]
- 3. Bane BL, Evans HL, Ro JY, et al Extraskeletal osteosarcoma. A clinicopathologic review of 26 cases. Cancer 1990;12: 2762–2770. [DOI] [PubMed] [Google Scholar]
- 4. Choi LE, Healey JH, Kuk, et al Analysis of outcomes in extraskeletal osteosarcoma: a review of fifty‐three case. J Bone Joint Surg Am 2014;96: e2. [DOI] [PMC free article] [PubMed] [Google Scholar]
- 5. Sio TT, Vu CC, Sohawon S, et al Extraskeletal osteosarcoma: an International Rare Cancer Network study. Am J Clin Oncol 2014. Epub ahead of print. [DOI] [PMC free article] [PubMed] [Google Scholar]
- 6. Lidang JM, Schumacher B, Myhre JO, et al Extraskeletal osteosarcomas: a clinicopathologic study of 25 cases. Am J Surg Pathol 1998;22: 588–594. [DOI] [PubMed] [Google Scholar]
- 7. Goldstein‐Jackson SY, Gosheger G, Delling G, et al Extraskeletal osteosarcoma has a favourable prognosis when treated like conventional osteosarcoma. J Cancer Res Clin Oncol 2005;131: 520–526. [DOI] [PMC free article] [PubMed] [Google Scholar]
- 8. Collins, M. Wilhelm M, Conyers R, et al Benefits and adverse events in younger versus older patients receiving neoadjuvant chemotherapy for osteosarcoma: findings from a meta‐analysis. J Clin Oncol 2013;31: 2303–2312. [DOI] [PubMed] [Google Scholar]
- 9. Chen X, Bahrami A, Pappo A, et al Recurrent somatic structural variations contribute to tumorigenesis in pediatric osteosarcoma. Cell Rep 2014;7: 104–112. [DOI] [PMC free article] [PubMed] [Google Scholar]
- 10. Reimann E, Kõks S, Ho X, et al Whole exome sequencing of a single osteosarcoma case integrative analysis with whole transcriptome RNA‐seq data. Hum Genomics 2014;8: 20. [DOI] [PMC free article] [PubMed] [Google Scholar]
- 11. Mertens F, Fletcher CD, Dal Cin P, et al Cytogenetic analysis of 46 pleomorphic soft tissue sarcomas and correlation with morphologic and clinical features: a report of the CHAMP Study Group. Chromosomes and MorPhology. Genes Chromosomes Cancer 1998;22: 16–25. [DOI] [PubMed] [Google Scholar]
- 12. Mohamed AN, Zalupski MM, Ryan JR, et al Cytogenetic aberrations and DNA ploidy in soft tissue sarcoma. A Southwest Oncology Group Study. Cancer Gen Cytogenet 1997;99: 45–53. [DOI] [PubMed] [Google Scholar]
- 13. Chapman AD, Pritchard SC, Yap WW, et al Primary pulmonary osteosarcoma: case report and molecular analysis. Cancer 2001;91: 779–784. [PubMed] [Google Scholar]
- 14. Cheng DT, Mitchell TN, Zehir A, et al Memorial Sloan Kettering‐Integrated Mutation Profiling of Actionable Cancer Targets (MSK‐IMPACT): a hybridization capture‐based next‐generation sequencing clinical assay for solid tumor molecular oncology. Mol Diagn 2015;17: 251–264. [DOI] [PMC free article] [PubMed] [Google Scholar]
- 15. Lu XY, Lu Y, Zhao YJ, et al Cell cycle regulator gene CDC5L, a potential target for 6p12‐p21 amplicon in osteosarcoma. Mol Cancer Res 2008;6: 937–946. [DOI] [PMC free article] [PubMed] [Google Scholar]
- 16. Both J, Wu T, Bras J, et al Identification of novel candidate oncogenes in chromosome region 17p11.2‐p12 in human osteosarcoma. PLoS One 2012;7: e30907. [DOI] [PMC free article] [PubMed] [Google Scholar]
- 17. Mejia‐Guerrero S, Quejada M, Gokgoz N, et al Characterization of the 12q15 MDM2 and 12q13‐14 CDK4 amplicons and clinical correlations in osteosarcoma. Genes Chromosomes Cancer 2010;49: 518–525. [DOI] [PubMed] [Google Scholar]
- 18. Mohseny AB, Tieken C, van der Velden PA, et al Small deletions but not methylation underlie CDKN2A/p16 loss of expression in conventional osteosarcoma. Genes Chromosomes Cancer 2010;49: 1095–103. [DOI] [PubMed] [Google Scholar]
- 19. Mohseny AB, Szuhai K, Romeo S, et al Osteosarcoma originates from mesenchymal stem cells in consequence of aneuploidization and genomic loss of Cdkn2. J Pathol 2009;219: 294–305. [DOI] [PubMed] [Google Scholar]
- 20. Vijayakumar, S. , Liu G, Rus IA, et al High‐frequency canonical Wnt activation in multiple sarcoma subtypes drives proliferation through a TCF/β‐catenin target gene, CDC25A. Cancer Cell 2011;19: 601–612. [DOI] [PMC free article] [PubMed] [Google Scholar]
- 21. Cai, Y Cai T, Chen Y. l. Wnt pathway in osteosarcoma, from oncogenic to therapeutic. J Cell Biochem 2014;115: 625–631. [DOI] [PubMed] [Google Scholar]
- 22. https://clinicaltrials.gov/ct2/results?term=NCT01877382&Search=Search. Last accessed on 11 September 2015.
- 23. Kansara M, Teng MW, Smyth MJ, et al Translational biology of osteosarcoma. Nat Rev Cancer 2014,14: 722–735. [DOI] [PubMed] [Google Scholar]
- 24. Overholtzer M, Rao PH, Favis R, et al The presence of p53 mutations in human osteosarcomas correlates with high levels of genomic instability. Proc Natl Acad Sci USA 2003;100: 11547–11552. [DOI] [PMC free article] [PubMed] [Google Scholar]
- 25. Nik‐Zainal S, Alexandrov LB, Wedge DC, et al Mutational processes molding the genomes of 21 breast cancers Cell 2012;149: 979–993. [DOI] [PMC free article] [PubMed] [Google Scholar]
- 26. Alexandrov LB, Nik‐Zainal S, Wedge DC, et al Signatures of mutational processes in human cancer. Nature 2013;500: 415–421. [DOI] [PMC free article] [PubMed] [Google Scholar]
- 27. Yoshida A, Ushiku T, Motoi T, et al MDM2 and CDK4 immunohistochemical coexpression in high‐grade osteosarcoma: correlation with a dedifferentiated subtype. Am J Surg Pathol 2012;36: 423–431. [DOI] [PubMed] [Google Scholar]
- 28. Koelsche C, Renner M, Hartmann W, et al TERT promoter hotspot mutations are recurrent in myxoid liposarcomas but rare in other soft tissue sarcoma entities. J Exp Clin Cancer Res 2014;33: 33–41. [DOI] [PMC free article] [PubMed] [Google Scholar]
- 29. Barretina J, Taylor BS, Banerji S, et al Subtype‐specific genomic alterations define new targets for soft‐tissue sarcoma therapy. Nat Genet 2010;42: 715–721. [DOI] [PMC free article] [PubMed] [Google Scholar]
- 30. Demicco EG, Torres KE, Ghadimi MP, et al Involvement of the PI3K/Akt pathway in myxoid/round cell liposarcoma. Mod Pathol 2012;25: 212–221. [DOI] [PMC free article] [PubMed] [Google Scholar]
- 31. Choy E, Hornicek F, MacConaill L, et al High‐throughput genotyping in osteosarcoma identifies multiple mutations in phosphoinositide‐3‐kinase and other oncogenes. Cancer 2012;118: 2905–2914. [DOI] [PMC free article] [PubMed] [Google Scholar]
Associated Data
This section collects any data citations, data availability statements, or supplementary materials included in this article.
Supplementary Materials
The following supplementary material may be found in the online version of this article:
Supplementary material 1
Supplementary material 2
Supplementary material 3
Supplementary material 4