

Abstract
Worldwide, laboratory technicians tediously read sputum smears for tuberculosis (TB) diagnosis. We demonstrate proof of principle of an innovative computational algorithm that successfully recognizes Ziehl-Neelsen (ZN) stained acid-fast bacilli (AFB) in digital images.
Automated, multi-stage, color-based Bayesian segmentation identified possible ‘TB objects’, removed artifacts by shape comparison and color-labeled objects as ‘definite’, ‘possible’ or ‘non-TB’, bypassing photomicrographic calibration. Superimposed AFB clusters, extreme stain variation and low depth of field were challenges. Our novel method facilitates electronic diagnosis of TB, permitting wider application in developing countries where fluorescent microscopy is currently inaccessible and unaffordable. We plan refinement and validation in the future.
Keywords: tuberculosis, sputum, microscopy, diagnostic imaging, software, Bayes’ theorem
Sputum smear microscopy using the ubiquitous Ziehl-Neelsen (ZN) stain, the primary diagnostic strategy for active tuberculosis (TB) worldwide that is recommended by the World Health Organization (WHO),1 is constrained by its reliance on human skill and time-intensive nature. In developing countries, fewer skilled technicians, inadequate equipment and high caseloads compound the problem of numerous samples at limited microscopy facilities. Reading of three initial smears and viewing of 100 high-power fields per slide is recommended. This takes at least 15 min for experienced staff,2 is subject to error,3 and the mental concentration and visual strain limits the volume of slides handled per day. Automated detection of acid-fast bacilli (AFB) could hasten diagnosis, enhance quantitative classification and reduce errors. Two reported studies applying computational image processing to detect TB bacilli used the expensive, less accessible auramine-rhodamine fluorescent stain.4,5 We demonstrate proof of principle of an innovative computational algorithm to recognize ZN-stained AFB in digital images. Color-edge detection methods applied to fluorescent images work poorly on ZN images. Our new method, free from scale calibration, uses prior knowledge about the distinctive ZN stain color to label a given image pixel as a ‘TB object’ or a ‘non-TB object’, followed by shape/size analysis to refine detection.
METHODS
Digital images of ZN-stained smears and tissue were obtained from the Centers for Disease Control’s (CDC’s) Public Health Image Library (PHIL) laboratories and other sources (Kandavelu K, personal communication, 2006).6-9 To be selected, images had to depict ZN-stained AFB. For simpler segmentation, we used clear Mycobacterium tuberculosis broth images to characterize AFB color. Computational algorithms (Figure 1) were implemented on a personal laptop in MATLAB 7 Image Processing Toolbox software (The Mathworks Inc., Natick, MA, USA, 2004).
Figure 1.
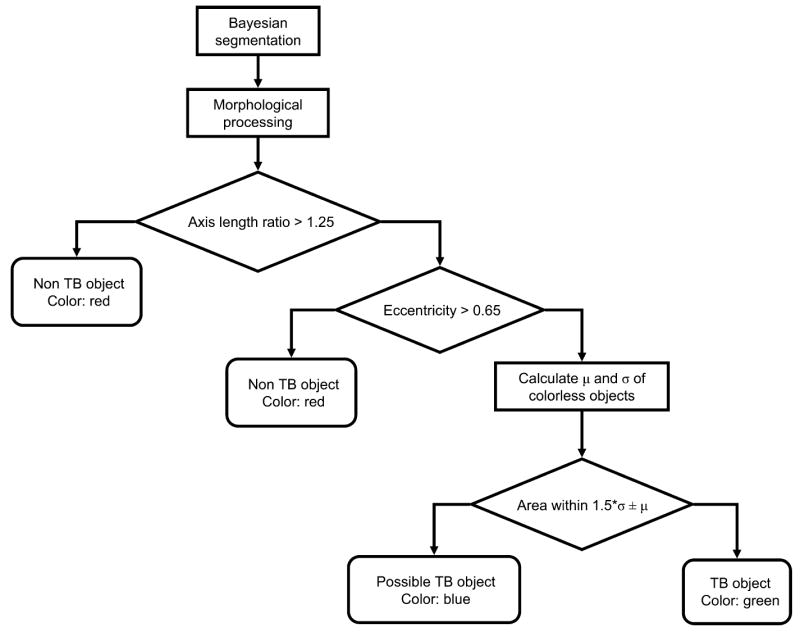
Flowchart showing the classification steps for automatic identification and labelling of bacilli in the ZN-stained digital images. ZN = Ziehl-Neelsen; TB = tuberculosis.
Color segmentation
Color gradient-based AFB segmentation and edge detection work poorly for ZN stains, which have greater background detail than fluorescent images. We used 1) Bayesian segmentation to predict the probability of a pixel representing a ‘TB object’ using prior knowledge of ZN stain colors; and 2) shape/size analysis. Pixel probabilities were derived from the three-dimensional probability density function histogram created by manually segmenting ZN-stained AFB-positive images. Most true AFB pixels had red green blue values that were significantly different from non-TB objects. Thresholding pixel probabilities created a binary mask which was improved using morphological dilation of the image with a circular structuring element.
Shape extraction
We discriminated true AFB from other AFB-positive artifacts such as Nocardia using shape. Matching nearest-neighbor connected pixels were grouped; to account for varying bacillary orientations and magnification, we bypassed size calibration by employing two shape descriptors that were invariant to rotation, translation, skew transformations and scale: 1) axis ratio (1 for circles, higher for line segments) and 2) eccentricity, a ratio of distance between elliptical foci to major axis length (1 for line segments, 0 for circles). The typical axis ratio of 2–2.5 for true AFB was significantly different from approximately ‘one’ for non-AFB objects; similarly, true AFB eccentricity was 0.90–0.96 and centered at zero for non-AFB. To maximize rod-shaped object recognition, we empirically chose conservative threshold cut-offs (axis-ratio >1.25 and eccentricity >0.65) as indicating AFB. Objects below the thresholds were labeled red as ‘non-TB’ objects. Calculating the mean AFB size μ and standard deviation σ from a broth image, we labeled all size outliers > μ ± 1.5σ in blue as ‘possible’ and within μ ± 1.5σ in green as ‘definite’ TB objects.
RESULTS
The algorithm recognized AFB under wide latitudes of staining, magnification and resolution (Figure 2). In Figure 2a,b nearly all visible bacilli were color-labeled as TB objects (green); conglomerations were labeled possible objects (blue). In Figure 2c,d the single typical TB bacillus was clearly recognized alongside a minor artifact. In Figure 2e,f, all AFB were recognized. In a challenge tissue slide (image not shown), the single TB bacillus was successfully detected without artifacts.
Figure 2.
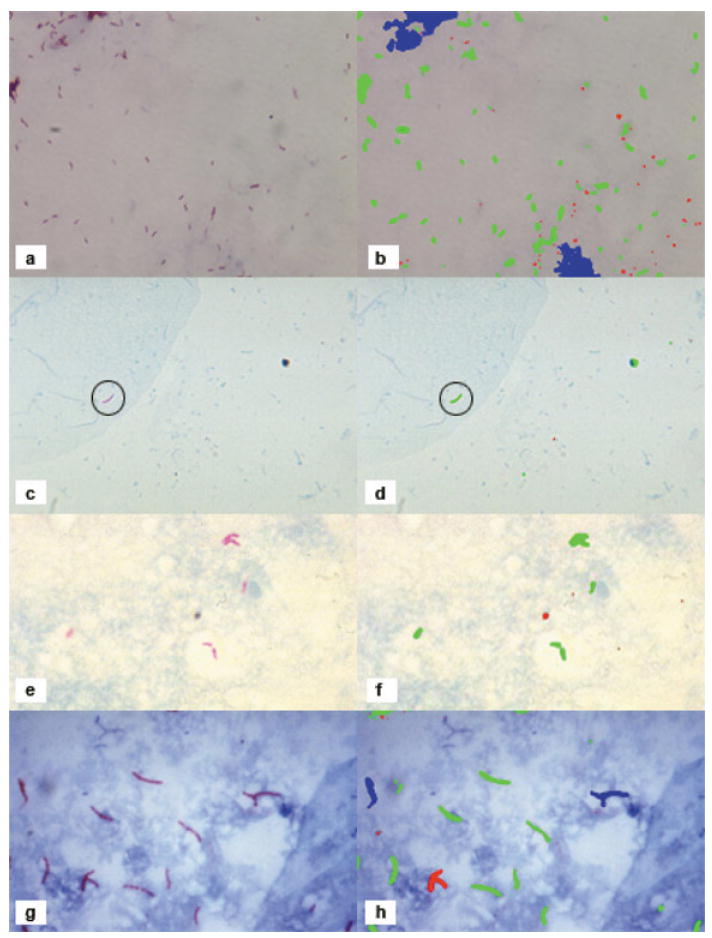
Result of our automated method for labelling TB bacilli. In the left column are the original images and in the right column are the results of the automatic identification. Red objects are those detected by Bayesian segmentation but rejected as TB objects based on shape. Blue objects are those detected by Bayesian segmentation and by shape segmentation but have an incorrect size and are considered as ‘possible’ TB objects. Green objects are ‘definite’ TB objects that passed Bayesian segmentation, shape segmentation, and size analysis. TB = tuberculosis. This image can be viewed online in colour at http://www.ingentaconnect.com/content/iuatld/ijtld
In the typical sputum smear image (Figure 2g,h), the algorithm successfully detected most of the single bacilli; most overlapping bacilli were labeled as ‘possible TB’. In all images, very little of the slide background was incorrectly labeled as possible or definite TB. In an image showing AFB in a skin lesion (image not shown), individual bacilli and small groups were correctly identified, while conglomerations and contiguous background were labeled ‘possible TB’. Even with bacillary conglomerations in AFB-positive images, individual bacilli were likely to be correctly labeled.
DISCUSSION
We present the first report of automated computational recognition of AFB in ZN-stained digital images, a challenge due to color density similarity between primary stain and counterstain. Our approach has several benefits. First, we specifically targeted the widely used ZN staining method, which is globally relevant to national TB programs. Second, our method succeeds despite considerable background artifacts. Third, our incorporation of size-invariant shape selection allows differing magnification and increases robustness for automated processing without human interaction. The programming simplicity of our algorithm permits conversion to stand-alone software for use on numerous personal computers in developing countries.
Overstaining or understaining may impact the current algorithm, as Bayesian segmentation uses stored probabilities. However, the algorithm can easily be modified to ‘learn’ stain characteristics for a new batch of slides by a color calibration step where new sample images are compared to the training database and flagged for differing color histograms. However, staining errors are unlikely in laboratories that follow the quality control procedures recommended by the WHO.1 Descriptors for ‘Y’ or ‘T’ shaped bacillary conglomerations could be another future improvement. Extensive refinement and validation is planned.
Relevant to centers having few skilled technicians and high workload, our method could reduce TB diagnostic delays. High bacillary load images could be rapidly labeled for immediate analysis and images with few bacilli could be reviewed faster with color-labeling. Our technique could also potentially quantify TB bacilli in ZN smears for future use as a surrogate marker of prognosis or cure in TB patient follow-up and to evaluate new anti-tuberculosis compounds. Program personnel and researchers could gainfully exploit the convenience and speed of automated processing to accurately and rapidly diagnose active TB worldwide.
Acknowledgments
The authors thank R C Ellis, Laboratory Manager, Division of Pathology, Institute of Medical and Veterinary Science, The Queen Elizabeth Hospital, Woodville, South Australia and the Armed Forces Institute of Pathology, Washington DC, USA, for permission to reproduce AFB images from their collections, and K Kandavelu, MBBS, of the Johns Hopkins Bloomberg School of Public Health, Baltimore, MD, USA, for providing digital images of M. tuberculosis broth cultures. Thanks are due to N Hooper for suggesting the CDC PHIL database. The authors are grateful to J M Samet, MD, MS, for his thoughtful comments on the manuscript.
This work was supported in part by a grant from the Fogarty TB/AIDS International Training and Research Programs through the Fogarty International Center/US National Institute of Health Grant no. 2 D 43 TW000010-18-AITRP and the National Science and Engineering Research Council grant 31-611387.
Footnotes
Competing interests: The authors declare that they have no competing interests.
References
- 1.World Health Organization Global Tuberculosis Programme. Laboratory services in tuberculosis control. Part II: microscopy. WHO/TB/98.258. Geneva, Switzerland: WHO; 1998. [Google Scholar]
- 2.Central TB Division. Revised National Tuberculosis Control Programme: module for laboratory technicians. 2. New Delhi, India: Directorate General of Health Services, Ministry of Health and Family Welfare, Government of India; 2005. [Google Scholar]
- 3.Nguyen TN, Wells CD, Binkin NJ, Pham DL, Nguyen VC. The importance of quality control of sputum smear microscopy: the effect of reading errors on treatment decisions and outcomes. Int J Tuberc Lung Dis. 1999;3:483–487. [PubMed] [Google Scholar]
- 4.Forero MG, Cristobal G, Alvarez-Borrego J. Automatic identification techniques of tuberculosis bacteria. Applications of Digital Image Processing XXVI; Proceedings of SPIE; 2003 Nov 1; 2003. pp. 71–81. [Google Scholar]
- 5.Veropoulos K, Learmonth G, Campbell C, Knight B, Simpson J. Automated identification of tubercle bacilli in sputum. A preliminary investigation. Anal Quant Cytol Histol. 1999;21:277–282. [PubMed] [Google Scholar]
- 6.Ellis RC. Gallery of histological sections: acid-fast bacilli. Woodwill, South Australia, Australia: IMVS Division of Pathology, The Queen Elizabeth Hospital; 2004. [January 2007]. http://www.adam.com.au/royellis/zn.html. [Google Scholar]
- 7.Centers for Disease Control and Prevention. Public health image library. Atlanta, GA, USA: CDC; 2007. [January 2007]. http://phil.cdc.gov/phil/home.asp. [Google Scholar]
- 8.Armed Forces Institute of Pathology. Department of Veterinary Pathology. Washington DC, USA: AFIP; [January 2007]. http://www.afip.org/vetpath. [Google Scholar]
- 9.Raqib R. International Centre for Diarrhoeal Disease Research, Bangladesh. Dhaka, Bangladesh: ICCDDR, B; [March 2007]. http://www.icddrb.org. [Google Scholar]