Abstract
Herein we describe the development and application of a bioorthogonal fluorogenic chelate linker that can be used for facile creation of labeled imaging agents. The chelate linker is based on the trans-cyclooctene(TCO)-tetrazine(Tz) chemistry platform and incorporates deferoxamine (DFO) as a 89Zr PET tracer and a BODIPY fluorophore for multimodal imaging. The rapid (<3 min) ligation between mAb-TCO and Tz-BODIPY-DFO chelator is monitored using fluorescence and allows for determination of labeling completion. Utilizing BODIPY as the linker between mAb and DFO facilitates in chelator quantification using spectrophotometry, allowing for an alternative to traditional methods (mass and isotope dilution assay). Radiolabeling with 89Zr to form 89Zr-DFO-BODIPY-trastuzumab was found to be quantitative after incubation at room temperature for 1 h (1.5 mCi/mg specific activity). The cell binding assay using HER2+ (BT474) and HER2- (BT20) cell lines showed significant binding to 89Zr-DFO-BODIPY-trastuzumab (6.45 ± 1.87% in BT474 versus 1.47 ± 0.39% in BT20). In vivo PET imaging of mice bearing BT20 or BT474 xenografts with 89Zr-DFO-BODIPY-trastuzumab showed high tumor conspicuity, and biodistribution confirmed excellent, specific probe uptake of 237.3 ± 14.5% ID/g in BT474 xenografts compared to low, nonspecific probe uptake in BT20 xenografts (16.4 ± 5.6% ID/g) 96 h p.i. . Ex vivo fluorescence (465ex/520em) of selected tissues confirmed superb target localization and persistence of the fluorescence of 89Zr-DFO-BODIPY-trastuzumab. The described platform is universally adaptable for simple antibody labeling.
Graphical abstract

INTRODUCTION
Targeted monoclonal antibody (mAb) therapy is a promising area of clinical medicine with an increasing number of clinically available immunotherapeutics and many in clinical and preclinical development.1,2 Due to their high target specificity, mAbs can be used in concert with positron emission tomography (PET) as a powerful noninvasive method for the direct monitoring of tumor lesions and in determining a patient’s course of treatment.3,4 89Zr (t1/2 = 78.4 h, β+ = 395 keV (22%), γ = 897 keV) is one of several ideal isotopes for this purpose and is already in use for clinical immunoPET.5,6 Attachment of 89Zr to mAbs requires the use of a bifunctional metal chelator that provides stable incorporation of the radioisotope onto the mAb. Deferoxamine (DFO) is currently considered the gold standard 89Zr chelator.7–9 Conjugation of DFO can be carried out using various established methods, whereafter the corresponding 89Zr complex is formed rapidly under mild conditions that do not compromise the integrity of sensitive mAbs.10
In order to prepare 89Zr labeled mAbs with potential for clinical use, it is imperative that there is minimal batch variation in terms of labeling efficiency, achievable specific activity, and retained affinity of the mAb postconjugation. This requires quantification of the number of covalently conjugated DFO moieties. The current methods of choice for quantification is accomplished by mass spectrometry methods or by isotope dilution assay.11–13 These methods can be time-consuming (a particular problem in clinical pharmacies), be costly, and/or lack accuracy, all of which may impede clinical translation of new immuno-PET agents significantly.
Herein we present a technology that enables real-time monitoring of coupling efficiency and rapid quantification of mAb functionalization with DFO, while simultaneously rendering the conjugate suitable for bimodal imaging applications (PET and fluorescence imaging). This is accomplished by designing a bioorthogonal fluorogenic DFO probe that displays fluorescence turn-on upon ligation with a mAb-trans-cyclooctene (TCO). While examples of chelate–fluorophore conjugates have been reported,14–17 they do not provide direct monitoring of the conjugation reaction. Moreover, while PET provides essentially unlimited depth penetration, but limited resolution (mm scale), optical techniques have resolution down to the sub-μm scale. Multimodal imaging agents can thus provide complementary information (beyond monitoring synthetic reaction conditions), particularly for subsequent intraoperative resection, margin determination of tumors, or endoscopic tattooing and biopsy.
RESULTS AND DISCUSSION
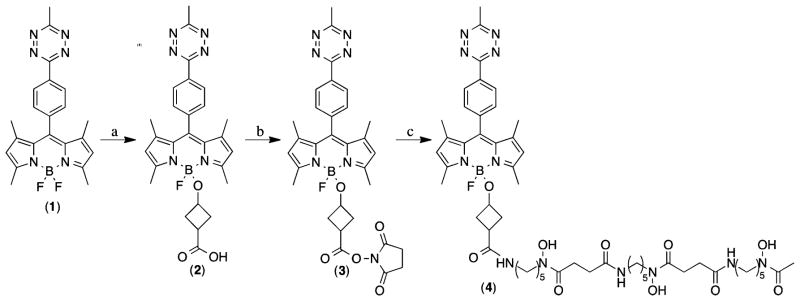
Several synthetic approaches are possible for creating a multimodal tetrazine–dye conjugate. Among fluorescent probes, BODIPY derivatives represent a promising family due to their exceptional properties. They exhibit high stability, high extinction coefficients, sharp emission bands, and high quantum yields.18 With this in mind we chose our previously reported BODIPY–tetrazine conjugates as a starting point for multimodal probe development. These fluorogenic compounds display excellent fluorescence enhancement by utilizing through-bond energy transfer (TBET) as the main quenching mechanism in addition to good in vitro stability. Recently published BODIPY modification strategies that rely on modifications to the BF2 core proved to be a concise route to a stable conjugate that does not alter the fluorescence properties of the BODIPY core, yet retains high in vitro and in vivo inertness of the linker moiety.19,20 The original work done on alkoxy-substituted BODIPYs discovered that increasingly larger substituents were less prone to hydrolysis and displayed improved stability.20 We selected the commercially available 3-hydroxycyclobutanecarboxylic acid as a suitable linker for its increased size compared to the original glycol-BODIPY derivatives.20 Furthermore, the acid provides a synthetic handle for DFO conjugation. We began with the bioorthogonal fluorogenic BODIPY-Tz probe 1 in our synthesis (Scheme 1).21 To this end, the borenium intermediate generated by combining 1 and TMSOTf at 0 °C was quenched with 3-hydroxycyclobutanecarboxylic acid to give 2. Intermediate 2 was converted to the NHS activated ester 3 using N,N′-disuccinimidyl carbonate and pyridine. Finally, NHS 3 was amidated with deferoxamine mesylate and Et3N in DMF to give 4.
Scheme 1.
Synthesis of Bioorthogonal Fluorogenic PET Probe (4)a
aReagents and conditions: (a) TMSOTf at 0 °C for 2 min in DCM, followed by 3-hydroxycyclobutanecarboxylic acid and DIPEA; (b) DSC and pyridine in DCM at rt; (c) Deferoxamine mesylate and Et3N in DMF at rt.
With bifunctional dye 4 in hand, we developed an efficient protocol to construct trastuzumab–TCO analogs with varying degrees of conjugation (see Experimental Procedures). Utilizing the fluorescence turn-on properties of 4, we successfully tracked the ligation between mAb-TCO and 4 (Figure 1) to its rapid completion (under 3 min). Having constructed several DFO-BODIPY-trastuzumab conjugates, we used UV/vis to determine the labeling efficiency and verified our results by a conventional characterization method, MALDI (Table 1).
Figure 1.
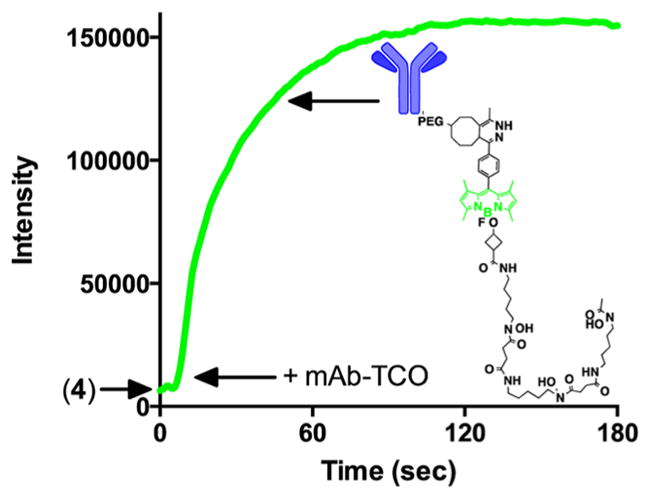
Fluorescence turn on observation during the reaction between trastuzumab-TCO and Tz-BODIPY-DFO 4 to yield DFO-BODIPY-trastuzumab.
Table 1.
Quantification of Trastuzumab–TCO Derivatives Using UV–vis (absorption at 280 and 500 nm) and MALDI Analysisc
| molecule | mass (m/z) | mass differencea (m/z) | labeling ratio BODIPY/Ab | A280 (1 cm) | A500 (1 cm) | [BODIPY]b M | [trastuzumab] M (corrected) | labeling ratio BODIPY/Ab |
|---|---|---|---|---|---|---|---|---|
| Trastuzumab | 147 366 | - | - | - | - | - | - | - |
| Conjugate A | 148 806 | 1440 | 1.00 | 0.91 | 0.29 | 3.7 × 10⁻⁶ | 3.85 × 10⁻⁶ | 0.95 |
| Conjugate B | 150 793 | 3427 | 2.40 | 0.99 | 0.8 | 1.0 × 10⁻⁵ | 3.87 × 10⁻⁶ | 2.62 |
Calculated by subtracting the MALDI mass of trastuzumab from the MALDI mass of a respective conjugate and dividing the resultant mass by the mass of the PEG4-TCO-dihydropyridazine-BODIPY-DFO clicked product (~1428.8 Da).
Calculated based on an extinction coefficient of 79 000 M−1 cm−1 at 500 nm (unpublished data)
Trastuzumab was utilized as a mass reference for the measurements.
We determined the absorbance spectrum of 4 after reaction with free trans-cyclooctenol to establish the A280/A500 ratio of the dye after tetrazine ligation. This correction factor allows quantification of the BODIPY contribution to the A280 of the conjugate, enabling deconvolution of the protein and dye concentrations from their characteristic extinction coeficients and calculation of the degree of labeling, per standard methods. Conjugate A was used for in vivo study based on its low labeling density and hence higher likeness to the native mAb.
With the coupling method and quantification validated, we next determined the radiolabeling and in vitro cell binding properties of DFO-BODIPY-trastuzumab conjugate A. For this, we used a typical radiolabeling protocol starting from 89Zr-oxalate (0.4 mCi) in 1 M oxalic acid. After adjusting the pH of 89Zr-oxalate to 7.4–7.6, an aliquot of DFO-BODIPY-trastuzumab conjugate A (100 μg) was added and the reaction was gently mixed at room temperature for 1 h, affording quantitative radiolabeling yield. The reaction was quenched and the 89Zr labeled mAb was purified by size exclusion chromatography. The purified product 89Zr-DFO-BODIPY-trastuzumab was further characterized by radioTLC and gel electrophoresis (Figure 2). Comparison of Coomassie blue stained gel with autoradiography confirms association of the radiolabel with the antibody fragments.
Figure 2.
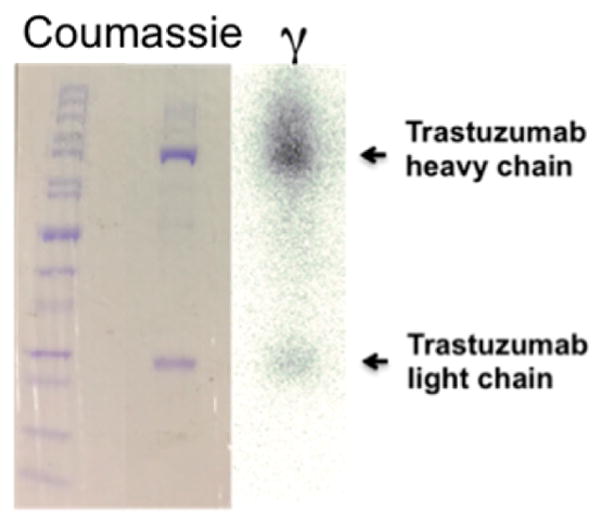
Gel electrophoresis of 89Zr-DFO-BODIPY-trastuzumab, showing heavy and light chain both in the photograph obtained after coumassie protein staining, as well as image obtained from autoradiography of identical gel, indicating association of the radioactive label with the mAb fragments.
In order to compare the new conjugation method to an established method of incorporating DFO onto antibodies, we synthesized a DFO–trastuzumab conjugate using conventional TFP-activation chemistry. The product was isolated and radiolabeled under analogous conditions as 89Zr-DFO-BODI-PY-trastuzumab, forming 89Zr-DFO-trastuzumab. Radiolabeling properties and obtained yields do not differ from the conventional 89Zr-DFO-trastuzumab analogue, which was synthesized as a reference.
Next, we compared specific binding of the mAb conjugate 89Zr-DFO-BODIPY-trastuzumab to HER2+/HER2- cells and compared its behavior to the conventional conjugate 89Zr-DFO-trastuzumab. We found that the two compounds exhibited very similar binding to HER2+ (BT474) and HER2- (BT20) cells in vitro (Figure 3), with significant differences between the binding obtained to HER2+ and HER2- cell lines for both compounds. The difference in binding of 89Zr-DFO-BODIPY-trastuzumab (6.45 ± 1.87% in BT474 versus 1.47 ± 0.39% in BT20) versus 89Zr-DFO-trastuzumab (5.48 ± 0.45% in BT474 versus 0.75 ± 0.21% in BT20) in HER2+ cells was found to be nonsignificant. Average nonspecific binding to BT20 is elevated for 89Zr-DFO-BODIPY-trastuzumab, possibly caused by the enhanced lipophilicity of the BODIPY-tetrazine fragment.
Figure 3.
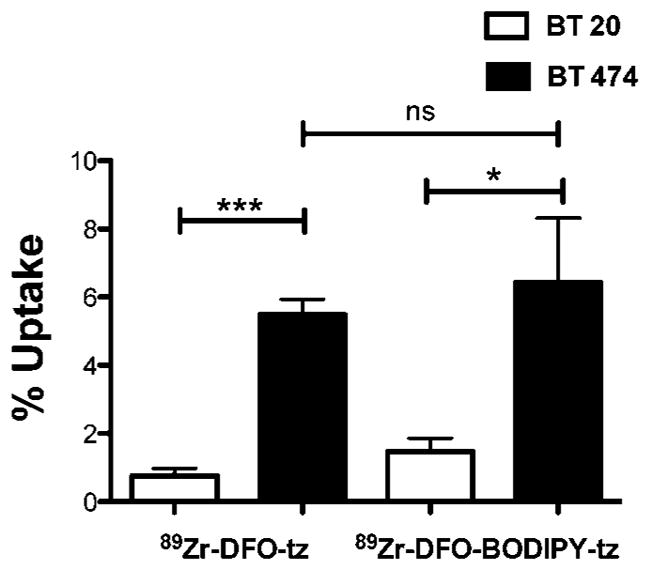
Quantification of cell uptake of trastuzumab (tz) conjugates shows significant difierence in uptake in HER2+ cells versus HER2-cells for both 89Zr-DFO-BODIPY-trastuzumab and 89Zr-DFO-trastuzumab (n = 4).
With the in vitro experiments providing satisfactory information on the performance of 89Zr-DFO-BODIPY-trastuzumab, we aimed to evaluate the bimodal probe in vivo. We generated tumor xenografts in female nude mice using HER2+ and HER2- cell lines for in vivo probe validation. Mice were injected with either probe and imaged 24, 48, 72, and 96 h after probe administration, followed by full biodistribution analysis after the last imaging time point.
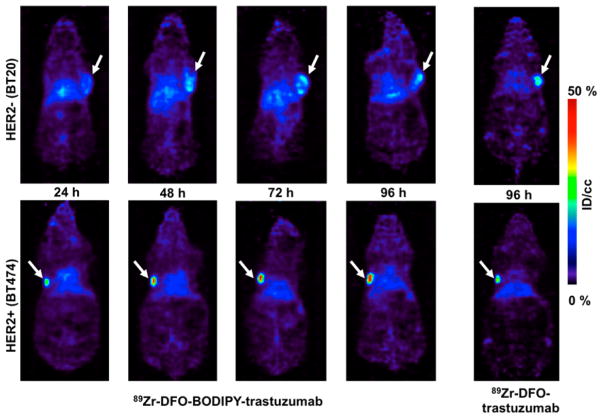
We observed consistently enhanced target specific uptake of 89Zr-DFO-BODIPY-trastuzumab, yielding high tumor conspicuity that is evident on examination of PET images (Figure 4). Biodistribution data showed that both compounds behaved similarly in mice with respect to uptake in nontarget tissues, and no significant difference was obtained with respect to uptake in HER2 negative-tumors (p > 0.5, 14.14 ± 8.23% ID/g for 89Zr-DFO-trastuzumab, 16.39 ± 9.79% ID/g for 89Zr-DFO-BODIPY-trastuzumab). In mice bearing HER2+ tumors, we found very similar off-target behavior with both conjugates (Table 2). For tumor uptake, however, there was a remarkable 4-fold higher uptake in these cohorts (p < 0.0001, 89Zr-DFO-BODIPY-trastuzumab: 237.27 ± 28.90% ID/g, 89Zr-DFO-trastuzumab: 59.39 ± 17.76% ID/g).
Figure 4.
Coronal images of mice with BT20 and BT474 xenografts obtained with 89Zr-DFO-BODIPY-trastuzumab. The images display low nonspecific uptake in the BT20 tumor (HER2-), at all imaging time points in contrast with high specific uptake in BT474 xenografts (HER2+), increasing over time. The arrow indicates the location of the tumor.
Table 2.
Biodistribution of 89Zr-DFO-BODIPY-Trastuzumab (n = 4) and 89Zr-DFO-BODIPY-Trastuzumab (n = 5) at 96 h p.i. in Nude Mice Bearing BT20 or BT474 Xenograftsa
| mice with BT20 xenografts
|
mice with BT474 xenografts
|
|||
|---|---|---|---|---|
| 89Zr-DFO-trastuzumab | 89Zr-DFO-BODIPY-trastuzumab | 89Zr-DFO-trastuzumab | 89Zr-DFO-BODIPY-trastuzumab | |
| Blood | 6.96 ± 2.91% | 8.03 ± 4.49% | 8.73 ± 1.22% | 10.08 ± 6.70% |
| Heart | 1.78 ± 0.50% | 3.20 ± 1.69% | 2.98 ± 0.38% | 3.68 ± 1.84% |
| Lung | 4.01 ± 3.41% | 4.87 ± 2.67% | 3.13 ± 1.84% | 9.13 ± 7.41% |
| Stomach | 0.76 ± 0.36% | 0.73 ± 0.46% | 0.71 ± 0.12% | 1.65 ± 0.75% |
| Liver | 6.03 ± 0.32% | 15.54 ± 4.45% | 8.69 ± 4.25% | 22.08 ± 15.36% |
| Intestine | 0.89 ± 0.32% | 2.15 ± 1.10% | 1.13 ± 0.27% | 2.70 ± 1.09% |
| Kidney | 3.40 ± 0.89% | 6.04 ± 1.14% | 3.63 ± 0.61% | 3.74 ± 1.26% |
| Bone | 3.83 ± 1.91% | 3.82 ± 1.63% | 2.85 ± 2.18% | 3.51 ± 2.40% |
| Muscle | 0.27 ± 0.09% | 0.46 ± 0.25% | 0.30 ± 0.18% | 0.32 ± 0.24% |
| Skin | 2.83 ± 1.75% | 5.39 ± 3.80% | 2.65 ± 1.70% | 5.32 ± 2.87% |
| Tumor | 14.14 ± 8.23% | 16.39 ± 9.79% | 59.39 ± 17.76% | 237.27 ± 28.90% |
Values are given in % injected dose/gram tissue.
Studies toward a better understanding of the cause of this exceptionally high probe uptake are ongoing. We hypothesize that the enhanced lipophilicity introduced by BODIPY contributes to increased retained activity over time. More specifically, it has been observed that BODIPY in addition to other dyes can stain lipophilic compartments such as the endoplasmic reticulum and golgi membranes.22 The effect of greater lipophilicity of 89Zr-DFO-BODIPY-trastuzumab is also apparent from the enhanced liver uptake when compared with liver uptake obtained for 89Zr-DFO-trastuzumab. The modified coupling method utilized for the incorporation of DFO does not have an effect on 89Zr release, as the average uptake in bone is not statistically different in any of the cohorts investigated.
To evaluate the potential of the probe as a way to identify targets intraoperatively through fluorescence, we also acquired ex vivo fluorescence images of selected organs and tissues: liver, bone, muscle, and tumor (HER2+ and HER2- tumor) and compared them with ex vivo PET images of the same samples. We found that even after 96 h, the fluorescence of BODIPY is found almost exclusively in HER2+ tumor tissue, indicating that the fluorophore remains fully associated and functional even after extended times of circulation and presence within the tumor tissue (Figure 5). These observations are of considerable translational importance. There is renewed interest in using optical techniques for tumor resection, margin delineation, targeting biopsies, and tumor monitoring by optical means.
Figure 5.
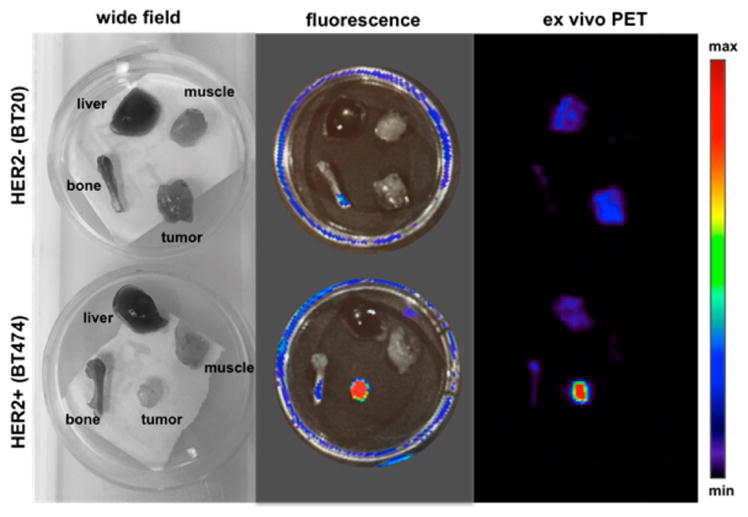
Wide field, fluorescence (465ex/520em) and ex vivo PET images acquired of muscle, liver, bone, and tumor. The enhanced uptake of the fluorescent immunoconjugate in HER2+ tumor tissue when compared with HER2- tumor tissue is evident.
CONCLUSIONS
In summary, we have developed a novel bioorthogonal fluorogenic labeling strategy for creating multimodal PET/ fluorescence mAb imaging probes. This represents the first example where a fluorogenic probe is used for reaction monitoring and quantification of a bioconjugation product. The fluorescence turn-on occurs during the conjugation reaction of biomolecule and fluorophore-chelator and provides a simple means of real time reaction monitoring as well as precise quantification of the number of conjugated chelators (DFO) by end point absorbance measurements. The resulting conjugate does not differ significantly from the conventional chelator-antibody conjugates in terms of radiolabeling properties and in vitro cell binding. Once administered to mice bearing tumor xenografts, the probe displays high target specificity as visualized by PET imaging at different time points, and robust ex vivo fluorescent imaging capabilities. We believe this broadly applicable conjugation strategy will find application with the use of near-infrared fluorophores for whole body NIR imaging in addition to other mAb’s for increased target diversity.
EXPERIMENTAL PROCEDURES
Chemicals and Reagents
All reagents were purchased from Sigma-Aldrich and used without further purification unless otherwise noted.
Instrumentation
1H and 13C nuclear magnetic resonance spectra were recorded on a Bruker Ascend 400 MHz spectrometer. MALDI data was acquired on a Bruker microflex MALDI-TOF MS. Silica Gel 60 (40–63 μm) was used for flash column purification. High performance liquid chromatography-mass spectrometry analysis (HPLC-MS) was performed with a Waters instrument equipped with a Waters 2424 ELS Detector, Waters 2998 UV–vis Diode array Detector, Waters 2475 Multiwavelength Fluorescence Detector, and a Waters 3100 Mass Detector. Separations employed Waters XTerra RP C18 5 μm or Waters XSelect CSH Fluoro-Phenyl 2.5 μm column, with a water:acetonitrile solvent gradient (0.1% formic acid). Fluorescence measurements were conducted with a QuantaMaster 400 fluorimeter (PTI, New Jersey, USA), and UV–vis absorption spectra on a HORIBA Dual-FL spectrophotometer.
Synthetic Procedures. Preparation of 1
To p-cyanophenyl-BODIPY (250.0 mg, 0.71 mmol) in a microwave reaction tube under a stream of argon was added Zn(OTf)2 (130.1 mg, 0.35 mmol), MeCN (0.38 mL, 7.16 mmol), 1,4-dioxane (0.55 mL), and NH2NH2 (1.12 mL, 35.8 mmol). The vessel was sealed and allowed to stir at 40 °C for 20 h after which it was allowed to cool and the septum removed. To the reaction mixture was added NaNO2 (988.1 mg, 14.32 mmol) in 20 mL of water followed by 1 M HCl until the pH = 3. The aqueous phase was extracted three times with CH2Cl2 (100 mL). The combined organic extracts were dried with MgSO4 and concentrated using a rotary evaporator. The crude mixture was purified using flash column chromatography (methylene chloride) to give 1 (63.2 mg, 0.15 mmol, 21.2%) as a dark red solid.21
Preparation of 2
To 1 (273.1 mg, 0.65 mmol) in 5 mL of methylene chloride at 0 °C was added TMSOTf (0.35 mL, 1.96 mmol) in 1 mL of methylene chloride over 30 s. After 2 min, 3-hydroxycyclo-butanecarboxylic acid (758.2 mg, 6.53 mmol) and N,N-diisopropylethylamine (0.57 mL, 3.26 mmol) dissolved in 3 mL of methylene chloride were added over a period of 2 min and the reaction taken out of 0 °C bath and allowed to stir at room temperature for 15 min. The crude mixture was concentrated using a rotary evaporator and purified using flash column chromatography (methylene chloride:methanol, 10:0.2, Rf = 0.23) to give 2 (134.7 mg, 0.26 mmol, 40.3%). 1H NMR (400 MHz, CDCl3) δ 8.74 (m, 2H), 7.53 (d, J = 8.8 Hz, 2H), 5.99 (s, 2H), 3.55 (p, J = 8.0 Hz, 1H), 3.12 (s, 3H), 2.55 (s, 6H), 2.47 (m, 1H), 2.16 (m, 2H), 2.07 (m, 2H), 1.43 (s, 6H); 13C NMR (100 MHz, MeOD) δ 179.0, 169.3, 165.1, 157.7, 144.4, 142.3, 140.7, 134.7, 132.9, 130.8, 130.7, 129.9, 129.8, 122.9, 63.1, 36.9, 33.2, 21.3, 15.2, 15.0. ESIMS [M-H]− calcd for C27H27BFN6O3 513.22, found 513.20.
Preparation of 3
To 2 (85.0 mg, 0.165 mmol) in 5 mL of methylene chloride was added N,N′-disuccinimidyl carbonate (338.6 mg, 1.32 mmol) and pyridine (0.053 mL, 0.66 mmol). The reaction was allowed to stir at room temperature overnight after which it was concentrated using a rotary evaporator and purified using flash column chromatography (methylene chloride:methanol, 10:0.25, Rf = 0.33) to give 3 (73.4 mg, 72.8%). 1H NMR (400 MHz, CDCl3) δ 8.75 (m, 2H), 7.55 (m, 2H), 5.99 (s, 2H), 3.61 (p, J = 8.0 Hz, 1H), 3.12 (s, 3H), 2.79 (bs, 4H), 2.72 (m, 1H), 2.55 (s, 6H), 2.26 (m, 4H), 1.44 (s, 6H); 13C NMR (100 MHz, CD2Cl2) δ 170.6, 169.8, 169.3, 168.3, 164.3, 156.8, 143.2, 140.9, 140.0, 133.4, 131.9, 130.0, 129.9, 129.1, 129.0, 122.1, 62.2, 36.9, 27.6, 26.2, 26.1, 21.6, 15.2, 15.0. ESIMS [M + Na]+ calcd for C31H31BFN7NaO5 634.22, found 634.24.
Preparation of 4
A solution of deferoxamine mesylate (0.099 mmol, 64.9 mg) and triethylamine (20.5 μL, 0.15 mmol) in 0.25 mL dimethyl sulfoxide was added to 3 (15.1 mg, 0.025 mmol) in 0.1 mL of dimethyl sulfoxide. After stirring for 30 min the reaction was loaded directly on a 5 g C18 Waters Sep-Pak and purified (compound 4 eluted off with H2O:MeCN 17:7) to give 4 (12.1 mg, 46.5%). 1H NMR (400 MHz, CDCl3) δ 8.73 (m, 2H), 7.53 (m, 2H), 5.98 (s, 2H), 3.61 (m, 5H), 3.51 (m, 1H), 3.17 (m, 4H), 3.12 (s, 3H), 2.79 (m, 2H), 2.59 (m, 4H), 2.54 (s, 6H), 2.32 (m, 2H), 2.17 (m, 2H), 2.09 (m, 2H), 1.98 (m, 2H), 1.56 (bs, 20H), 1.43 (s, 6H), 1.42 (s, 3H). ESIMS [M–H]− calcd for C52H73BFN12O10 1055.57, found 1055.80.
Preparation of MALDI-TOF Samples
MALDI samples were prepared by drying a 1 μL solution of a 2:1 mixture of antibody (150 μg/mL) in saline:sinapinic acid solution (1 mg sinapinic acid in 0.1 mL of 7:3 MeCN:H2O) on a MALDI target plate.
Antibody Preparation for Labeling
Trastuzumab, lyophilized powder for intravenous injection (Genentech), was dissolved in phosphate buffered saline with 100 mM sodium bicarbonate (PBS-Bicarb, pH 8.6) at 5 mg/mL (inclusive of the additives for preservation). The antibody solution was then buffer exchanged with a 40 K Zeba Spin column (ThermoFisher,USA) that had been equilibrated in the same buffer, per the manufacturer’s protocol to remove preservatives and establish optimal pH for labeling. The absorbance of the antibody solution at 280 nm (A280) was measured by spectrophotometer (NanoDrop, Thermo Scientific) and converted to a molar concentration based on an extinction coefficient of 225 000 M−1 cm−1 for trastuzumab. Dimethylformamide was then added to a concentration 10% (v/v), and the solution was aliquoted into individual labeling reactions.
Antibody–TCO Labeling and Initial Characterization
Transcyclooctene-PEG4-NHS (ClickChemistryTools, Scotts-dale, AZ) was dissolved in dry DMF at a concentration of 10 mg/mL and added to the antibody solution in aliquots to obtain the correct labeling ratio, in moles of TCO per mole of antibody, for 2.5 and 10 equiv of TCO. For optimal labeling, antibody concentration in the final reaction should be between 2.5 and 3 mg/mL. The labeling mixture was incubated at 25 °C in a vortexing mixer for 30 min and then the reaction terminated by desalting on 40 K ZebaSpin columns that had been pre-equilibrated with PBS at pH 7.4, per the manufacturer’s protocol. The concentration of labeled antibody and adequacy of DMF removal in the desalting columns was verified by Nanodrop measurement of A280 and of A260/280 ratio. The A260/A280 ratio is <0.49 for trastuzumab in buffer. In the event that higher A260/A280 ratios were observed, reflecting traces of DMF, the material was passed over an additional desalting column and reassessed. Labeled antibody solutions in PBS were stored at 4 °C.
Preparation of DFO-BODIPY-Trastuzumab
Trastuzu-mab-TCO solutions in PBS were prepared for labeling by addition of 10% DMF (v/v) to ensure solubility of the Tz-BODIPY-DFO conjugate 4. A 10 mM stock solution of 4 in DMF was prepared and added to the trastuzumab-TCO to reach a total molar ratio of 20 equiv of 4 per trastuzumab. The reaction was allowed to proceed at room temperature for 30 min and then desalted by successive passage over two 40 K ZebaSpin columns, to ensure complete removal of any free dye molecules. The concentration of labeled DFO-BODIPY-trastuzumab and the degree of labeling were assessed by spectrophotometry per standard methodology, using an A280/ A500 correction factor of 0.15 (unpublished data) to account for the contribution of the dye to the observed A280. The use of 0.15 as the correction factor reflects the ratio at the time point at which antibody labeling was assessed.
Real-Time Monitoring of Tz-BODIPY-DFO Click Labeling
A stock solution 4 in DMSO was diluted into 480 μL of PBS to yield a final concentration of 12 μM, and then added to a microvolume quartz cuvette in a QuantaMaster 400 fluorimeter (PTI, New Jersey, USA). The sample was excited at 490 nm and the emission monitored at 510 nm in a continuous time series. To this solution was added 20 μL of a 13.7 μM stock of trastuzumab-TCO in PBS, for a net 25-fold dilution into PBS, and a final 20-fold excess of 4 relative to the antibody, demonstrating the feasibility of reaction monitoring by this method at even a high degree of labeling. Addition of the antibody produced an immediate rise in the fluorescence signal, after which the reaction was monitored to completion (no further fluorescence increase).
Radiolabeling and Purification of DFO-BODIPY-tras-tuzumab
89Zr(oxalate) was received from Washington University at an average specific activity of (15 mCi/mL). For a typical radiolabeling procedure, an aliquot of 100 μL was removed from the stock solution and transferred into a separate vial. The pH of the solution was adjusted with 1 M Na2CO3 (105 μL) to 7.4–7.6. The aliquot was mixed with 0.1 μg ligand DFO-trastuzumab or DFO-BODIPY-trastuzumab (conjugate A, in 100 μL solution) and reacted under slow mixing for 1 h. The reaction was monitored using radioTLC (solid phase: Sigma-Aldrich, Silica gel on TLC Aluminum foils, 10 × 70 mm; mobile phase; 50 mM EDTA, pH 7). Under these conditions, 89 Zr(oxalate) migrates with the solvent front, while chelated 89Zr remains at the origin. Complex solutions for in vivo administration were purified by size exclusion chromatography. The labeled product was characterized via radio-TLC and gel electrophoresis.
Cell Binding of Trastuzumab Conjugates
Cell uptake experiments were performed in HER2+ (BT474), and HER2-(BT20) cells, in which 250 μL of 106 cells/mL were seeded in 24-well plates. Cells were allowed to adhere overnight at 37 °C in a 5% CO2 atmosphere. The media was removed and replaced with 125 μL of fresh complete media and 125 μL of 50 ng/mL of 89Zr-DFO-BODIPY-trastuzumab or 89Zr-DFO-trastuzumab, saving aliquots in test tubes as a standard. The plates were incubated at 4 °C for 2 h, gently rocking. The cells were washed three times with PBS, trypsinized, and transferred to test tubes. Radioactivity associated with cells was counted in a gamma counter. The percentage of bound radioactivity was calculated as the ratio of bound to the total radioactivity added per well multiplied by 100.
In Vivo, Ex Vivo, and Biodistribution (Xenograft Model)
All animal experiments were conducted according to the guidelines of the Institutional Animal Care and Use Committee (IACUC). In vivo PET imaging and biodistribution studies were conducted in nude mice (Charles River Laboratories, MA). Mice were inoculated with 100 μL of 106 cells (BT-474 or BT-20) suspended in 1:1 saline and matrigel with no artificial stimuli. Tumors were allowed to grow for 3–4 weeks until tumors were palpable. Tumor sizes ranged from (52 ± 10) mm3 (BT474 cells) and (290 ± 50) mm3 (BT20 cells). Mice were injected via tail-vein with 100 μL of 10–20 μCi of 89Zr-DFO-BODIPY-trastuzumab or 89Zr-DFO-trastuzumab (specific activity 1.5–2.0 mCi/mg mAb) in saline. Micro-PET/CT imaging experiments were conducted on a Sofie Biosciences G4 PET scanner (Culver City, CA, USA), 10 min static microPET images were acquired under general anesthesia (isoflurane/O2) at 24, 48, 72, and 96 h post injection. Mice were sacrificed and organs were harvested, weighed, and assayed in the gamma counter for biodistribution studies. Radioactivity associated with each organ was expressed as percentage of injected dose per gram of organ (% ID/g). Biodistribution data were assessed by unpaired tests using GraphPad Prism (version 6.02 for Windows GraphPad Software, San Diego, CA, USA) in order to determine any significant differences (p < 0.05). For ex vivo fluorescence imaging, an IVIS Spectrum imaging system was used to record the images (exposure time, 120 s; bin = 8, f = 1, FOV = D). Selected organs and tissue samples were placed in culture dishes (60 mm diameter), and samples were excited at 465 nm, with fluorescence emission monitored at 520 nm.
Supplementary Material
Acknowledgments
We are grateful to Dr. Ralph Mazitschek for many helpful discussions, Nicholas Rotile for assistance with PET imaging, Shadi Esfahani and Umar Mahmood for assistance with the HER2+ cell line and Brijesh Bhayana for MALDI-TOF acquisition. The authors acknowledge funding by NIH RO1EB010011, RO1EB009062, 2P50A086355, and K99HL125728.
Footnotes
Notes
The authors declare no competing financial interest.
The Supporting Information is available free of charge on the ACS Publications website at DOI: 10.1021/acs.bioconj-chem.5b00630.
NMR and MALDI spectroscopy (PDF)
References
- 1.Rosenberg SA, Yang JC, Restifo NP. Cancer immunotherapy: moving beyond current vaccines. Nat Med. 2004;10:909–915. doi: 10.1038/nm1100. [DOI] [PMC free article] [PubMed] [Google Scholar]
- 2.Leavy O. Immunotherapy: A triple blow for cancer. Nat Rev Cancer. 2015;15:258–259. doi: 10.1038/nrc3946. [DOI] [PubMed] [Google Scholar]
- 3.Wu AM. Antibodies and antimatter: the resurgence of immuno-PET. J Nucl Med. 2008;50:2–5. doi: 10.2967/jnumed.108.056887. [DOI] [PubMed] [Google Scholar]
- 4.Van Dongen GA, Visser GW, Lub-de Hooge MN, De Vries EG, Perk LR. Immuno-PET: a navigator in monoclonal antibody development and applications. Oncologist. 2007;12:1379–1389. doi: 10.1634/theoncologist.12-12-1379. [DOI] [PubMed] [Google Scholar]
- 5.Pandit-Taskar N, O’Donoghue JA, Durack JC, Lyashchenko SK, Cheal SM, Beylergil V, Lefkowitz RA, Carrasquillo JA, Martinez DF, Fung AM, Solomon SB, GM, Heller G, Loda M, Nanus DM, Tagawa ST, Feldman JL, Osborne JR, Lewis JS, Reuter VE, Weber WA, Bander NH, Scher HI, Larson SM, Morris MJ. A Phase I/II Study for Analytic Validation of 89Zr-J591 ImmunoPET as a Molecular Imaging Agent for Metastatic Prostate Cancer. Clin Cancer Res. 2015;21:5277. doi: 10.1158/1078-0432.CCR-15-0552. [DOI] [PMC free article] [PubMed] [Google Scholar]
- 6.Alfuraih A, Alzimami K, Ma AK, Alghamdi A, Al Jammaz I. Effective dose to immuno-PET patients due to metastable impurities in cyclotron produced zirconium-89. Radiat Phys Chem. 2014;104:145–149. [Google Scholar]
- 7.Zeglis BM, Lewis JS. The Bioconjugation and Radiosynthesis of 89Zr-DFO-labeled Antibodies. J Visualized Exp. 2015:e52521–e52521. doi: 10.3791/52521. [DOI] [PMC free article] [PubMed] [Google Scholar]
- 8.Ikotun OF, Marquez BV, Huang C, Masuko K, Daiji M, Masuko T, McConathy J, Lapi SE. Imaging the L-type amino acid transporter-1 (LAT1) with Zr-89 immunoPET. PLoS One. 2013;8:e77476. doi: 10.1371/journal.pone.0077476. [DOI] [PMC free article] [PubMed] [Google Scholar]
- 9.Deri MA, Zeglis BM, Francesconi LC, Lewis JS. PET imaging with 89 Zr: from radiochemistry to the clinic. Nucl Med Biol. 2013;40:3–14. doi: 10.1016/j.nucmedbio.2012.08.004. [DOI] [PMC free article] [PubMed] [Google Scholar]
- 10.Zeglis BM, Lewis JS. A practical guide to the construction of radiometallated bioconjugates for positron emission tomography. Dalton Trans. 2011;40:6168–6195. doi: 10.1039/c0dt01595d. [DOI] [PMC free article] [PubMed] [Google Scholar]
- 11.Marquez BV, Ikotun OF, Zheleznyak A, Wright B, Hari-Raj A, Pierce RA, Lapi SE. Evaluation of 89Zr-pertuzumab in Breast Cancer Xenografts. Mol Pharmaceutics. 2014;11:3988–3995. doi: 10.1021/mp500323d. [DOI] [PMC free article] [PubMed] [Google Scholar]
- 12.Holland JP, Divilov V, Bander NH, Smith-Jones PM, Larson SM, Lewis JS. 89Zr-DFO-J591 for immunoPET of prostate-specific membrane antigen expression in vivo. J Nucl Med. 2010;51:1293–1300. doi: 10.2967/jnumed.110.076174. [DOI] [PMC free article] [PubMed] [Google Scholar]
- 13.Holland JP, Caldas-Lopes E, Divilov V, Longo VA, Taldone T, Zatorska D, Chiosis G, Lewis JS. Measuring the pharmacodynamic effects of a novel Hsp90 inhibitor on HER2/neu expression in mice using 89 Zr-DFO-trastuzumab. PLoS One. 2010;5:e8859. doi: 10.1371/journal.pone.0008859. [DOI] [PMC free article] [PubMed] [Google Scholar]
- 14.Pandey SK, Gryshuk AL, Sajjad M, Zheng X, Chen Y, Abouzeid MM, Morgan J, Charamisinau I, Nabi HA, Oseroff A. Multimodality agents for tumor imaging (PET, fluorescence) and photodynamic therapy. A possible “see and treat” approach. J Med Chem. 2005;48:6286–6295. doi: 10.1021/jm050427m. [DOI] [PubMed] [Google Scholar]
- 15.Lhenry D, Larrouy M, Bernhard C, Goncalves V, Raguin O, Provent P, Moreau M, Collin B, Oudot A, Vrigneaud JM, et al. BODIPY: A Highly Versatile Platform for the Design of Bimodal Imaging Probes. Chem - Eur J. 2015;21:13091–13099. doi: 10.1002/chem.201501676. [DOI] [PubMed] [Google Scholar]
- 16.Brand C, Abdel-Atti D, Zhang Y, Carlin S, Clardy SM, Keliher EJ, Weber WA, Lewis JS, Reiner T. In vivo imaging of GLP-1R with a targeted bimodal PET/fluorescence imaging agent. Bioconjugate Chem. 2014;25:1323–1330. doi: 10.1021/bc500178d. [DOI] [PMC free article] [PubMed] [Google Scholar]
- 17.Zeglis BM, Davis CB, Abdel-Atti D, Carlin SD, Chen A, Aggeler R, Agnew BJ, Lewis JS. Chemoenzymatic Strategy for the Synthesis of Site-Specifically Labeled Immunoconjugates for Multimodal PET and Optical Imaging. Bioconjugate Chem. 2014;25:2123–2128. doi: 10.1021/bc500499h. [DOI] [PMC free article] [PubMed] [Google Scholar]
- 18.Bernhard C, Goze C, Rousselin Y, Denat F. First bodipy–DOTA derivatives as probes for bimodal imaging. Chem Commun. 2009;46:8267–8269. doi: 10.1039/c0cc02749a. [DOI] [PubMed] [Google Scholar]
- 19.Hendricks JA, Keliher EJ, Wan D, Hilderbrand SA, Weissleder R, Mazitschek R. Synthesis of [18F] BODIPY: bifunctional reporter for hybrid optical/positron emission tomography imaging. Angew Chem, Int Ed. 2012;51:4603–4606. doi: 10.1002/anie.201107957. [DOI] [PMC free article] [PubMed] [Google Scholar]
- 20.Courtis AM, Santos SA, Guan Y, Hendricks JA, Ghosh B, Szantai-Kis DM, Reis SA, Shah JV, Mazitschek R. Monoalkoxy BODIPYs - A Fluorophore Class for Bioimaging. Bioconjugate Chem. 2014;25:1043–1051. doi: 10.1021/bc400575w. [DOI] [PMC free article] [PubMed] [Google Scholar]
- 21.Carlson JC, Meimetis LG, Hilderbrand SA, Weissleder R. BODIPY–Tetrazine Derivatives as Superbright Bioorthogonal Turn-on Probes. Angew Chem, Int Ed. 2013;52:6917–6920. doi: 10.1002/anie.201301100. [DOI] [PMC free article] [PubMed] [Google Scholar]
- 22.Cunningham CW, Mukhopadhyay A, Lushington GH, Blagg BS, Prisinzano TE, Krise JP. Uptake, distribution and diffusivity of reactive fluorophores in cells: implications toward target identification. Mol Pharmaceutics. 2010;7:1301–1310. doi: 10.1021/mp100089k. [DOI] [PMC free article] [PubMed] [Google Scholar]
Associated Data
This section collects any data citations, data availability statements, or supplementary materials included in this article.


