

Abstract
Background
Abnormality in the concentration and functioning of gamma-aminobutyric acid (γ-aminobutyric acid, GABA) in the brain is not only an important hypothetical link to the cause of schizophrenia but it may also be correlated with the cognitive decline and negative symptoms of schizophrenia. Studies utilizing high field magnetic resonance spectroscopy (MRS) report abnormal density of GABA in the ventromedial prefrontal cortex (vmPFC) of patients with chronic schizophrenia, but these results may be confounded by study participants’ prior use of antipsychotic medications.
Aim
Compare the density of GABA in the vmPFC of patients with first-episode psychosis to that in healthy controls and assess the relationship of GABA density in the vmPFC to the severity of psychotic symptoms.
Methods
Single-voxel 1H-MRS was used to assess the concentration of GABA and other metabolites in the vmPFC of 22 patients with first-episode psychosis (10 with schizophrenia and 12 with schizophreniform disorder) and 23 healthy controls. Thirteen of the 22 patients were drug-naïve and 9 had used antipsychotic medication for less than 3 days. The Positive and Negative Syndrome Scale (PANSS) was used to evaluate the severity of psychotic symptoms in the patient group.
Results
The mean (sd) GABA density in the vmPFC was significantly higher in patients than in controls (2.28 [0.54] v. 1.93 [0.32] mM, t=2.62, p=0.012). The densities of other metabolites – including N-acetylaspartic acid (NAA), glutamic acid (GLU), and glutamine (GLN) – were not significantly different between patients and controls. Among the patients, GABA density in the vmPFC was not significantly correlated with PANSS total score or with any of the three PANSS subscale scores for positive symptoms, negative symptoms, and general psychopathology. GABA concentration was not associated with the duration of illness, but it was significantly correlated with patient age (r=0.47, p=0.026).
Conclusion
Elevation of GABA density in the vmPFC of patients with first-episode psychosis confirms that this abnormality is independent of medication use. The failure to find a correlation of GABA density in the vmPFC with the severity of psychotic symptoms needs to be confirmed in larger studies, but it suggests that there are several intervening steps between brain pathology and clinical symptoms.
Keywords: first-episode psychosis, first-episode schizophrenia, drug-naïve, magnetic resonance spectroscopy, gamma-aminobutyric acid, ventromedial prefrontal cortex, China
Abstract
背景
大脑中γ-氨基丁酸(γ-aminobutyric acid,GABA)的浓度和功能异常不仅是精神分裂症的一个重要病因学假说,而且也可能与认知功能下降和精神分裂症阴性症状相关。运用高场强磁共振波谱分析(magnetic resonance spectroscopy,MRS)的研究发现慢性精神分裂症患者额叶腹内侧(ventromedialprefrontal cortex,vmPFC)的GABA异常浓度,但患者既往使用抗精神病药物可能会对这些结果产生混杂。
目的
比较首发精神病患者和健康对照组vmPFC中的GABA浓度,并评估vmPFC中GABA浓度与精神病性症状严重程度之间的关系。
方法
共纳入22例首发精神病患者(10例精神分裂症患者和12例精神分裂样障碍患者)和23名健康对照者,应用单体素1H-MRS来检测vmPFC中的GABA和其它代谢产物的浓度。22例患者中13例患者没有用过药物,9例患者使用抗精神病药物少于3天。采用阳性和阴性症状量表(the Positive andNegative Syndrome Scale,PANSS)评估患者组的精神病症状严重程度。
结果
患者组vmPFC的GABA浓度的均值(SD)显著高于对照组(2.28 [0.54] v.1.93 [0.32] mM,t=2.62,p=0.012)。其它代谢产物的浓度——包括N-乙酰天冬氨酸(N-acetylaspartic acid,NAA)、谷氨酸(glutamicacid,GLU)和谷氨酰胺(glutamine,GLN),在患者组和对照组之间没有显著差异。患者vmPFC中的GABA浓度与PANSS总分或三个PANSS分量表(阳性症状、阴性症状、一般精神病理)中的任何一个评分之间没有显著相关性。GABA浓度与病程之间无相关性,但与患者年龄显著相关(r=0.47,p=0.026)。
结论
首发精神病患者vmPFC中的GABA浓度升高证实了该异常情况与药物使用是相互独立的。我们需要更大规模的研究来证实vmPFC中的GABA浓度与精神病症状严重程度之间不存在相关性,但这也提示脑部病理变化与临床症状之间存在若干个中间环节。
中文全文
本文全文中文版从2016年4月25日起在http://dx.doi.org/10.11919/j.issn.1002-0829.215130可供免费阅览下载
1. Introduction
Schizophrenia is a common, severe mental illness with high rates of disability and relapse, but, despite decades of work, the etiology of the condition remains largely unknown.[1] Magnetic resonance spectroscopy (MRS) is a relatively new technology that makes it possible to investigate both the etiology and pathological development of mental illnesses by examining the densities of metabolites in the brain, and, thus, provides means to assess the structural and functional integrity of neurons within the brain.[2] One such metabolite is gamma-aminobutyric acid (γ-aminobutyric acid, GABA), an inhibitory neurotransmitter that may play important roles in both the etiology and treatment of schizophrenia.[3] High-field strong (3.0 T) magnetic resonance imaging (MRI) has been used to assess the density of GABA in several cerebral areas in patients with schizophrenia, including the dorsolateral prefrontal cortex, ventromedial prefrontal cortex, cingulate cortex, basal ganglia, and thalamus. The results of these studies[4,5] support the hypothesis that there is an abnormal density and functioning of GABA in specific cerebral areas in patients with schizophrenia and, additionally, that abnormal density of GABA is correlated with the use of antipsychotic medication by patients with schizophrenia.[4,5] Recent studies[6] have focused on the role of abnormal GABA density in the ventromedial prefrontal cortex (vmPFC), an important location in the brain for the production of neurotransmitters that acts as the center of advanced cognitive functions involving the integration of information about perception and emotion and that is closely related to the functions of the limbic system. One study found that abnormalities of the vmPFC may cause thought disorder and abnormal cognitive functioning.[7] Previous studies about GABA concentration in the vmPFC have primarily considered individuals with chronic schizophrenia, so these results may be confounded by prior drug treatment and other factors. To help clarify the relationship of GABA concentration in the vmPFC to schizophrenia, the present study investigates whether or not the density of GABA in the vmPFC of patients with first-episode psychosis (including schizophrenia and schizophreniform disorder) is abnormal and, secondly, whether or not GABA density in the vmPFC is correlated with the severity of clinical symptoms in first-episode psychosis.
2. Methods
2.1. Participants
The enrollment of all participants is shown in Figure 1. Participants in the first-episode psychosis group were inpatients or outpatients who sought treatment at the Shanghai Mental Health Center from March 2014 to December 2015. In total 32 patients with first-episode psychosis were interviewed and 22 of them (7 outpatients and 15 inpatients) were enrolled. Inclusion criteria were as follows: (a) aged 18-40 years; (b) met the diagnostic criteria of schizophrenia according to The Diagnostic and Statistical Manual of Mental Disorders, Fifth Edition (DSM-5)[8] or met criteria of schizophreniform disorder (with at least 1 month of active psychotic symptoms) at enrollment and subsequently met the criteria for schizophrenia (i.e., total duration of illness of at least 6 months); (c) had either never received antipsychotic medication or had received anti-psychotic medication for no more than 2 days; (d) was right-handed; (e) did not have a serious physical illness, mental retardation, or a history of substance abuse; (f) had never received electroconvulsive therapy; (g) was not pregnant or lactating; (h) was not too ill to complete the magnetic resonance imaging (MRI); (i) did not have structural abnormalities of cerebral regions based on MRI results; and (j) both the patient and guardian provided written informed consent.
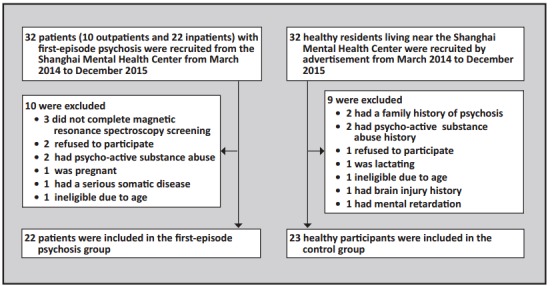
Figure 1. Enrollment in the study
The 22 first-episode psychosis patients included 10 with schizophrenia and 12 with schizophreniform disorder at the time of enrollment. The mean (sd) total duration of illness among the 22 individuals in the patient group was 18.8 (27.7) months and the range was 1-92 months. The mean duration of untreated psychosis prior to the MRI examination (i.e., time since onset of hallucinations, delusions, thought disorder, or grossly bizarre behavior) was 9.5 (14.7) months and the range was 1-54 months. All 7 outpatients and 6 of the 15 inpatients included in the analysis were drug-naïve before the MRI examination; the remaining 9 inpatients had taken antipsychotic medication for no more than 2 days prior to the MRI examination.
During the same time period, 32 healthy residents living near the Shanghai Mental Health Center were recruited by advertisements and evaluated by one of two attending psychiatrists using the Mini International Neuropsychiatric Interview[9] (MINI 6.0). Twenty-three met the inclusion criteria for the control group: (a) aged 18-40 years; (b) no mental illness based on the MINI; (c) no family history of mental illness; (d) completed at least nine years of education; (e) did not have a serious physical illness, mental retardation, a history of substance abuse, or a history of brain injury; (e) was not pregnant or lactating; (f) did not have structural abnormalities of cerebral regions based on MRI results; and (g) provided written informed consent.
2.2. Assessment
The diagnoses of participants in the patient group were confirmed by two senior attending psychiatrists, and the magnitude of their psychotic symptoms were assessed prior to starting medications and prior to the MRI examination using the Positive and Negative Syndrome Scale (PANSS).[10]
For both patients and controls the 1H-magnetic resonance spectroscopy (1H-MRS) data were acquired at the Shanghai Mental Health Center using a 3.0-Tesla superconducing Magnetic Resonance Imaging (MRI) scanner (produced by Siemens in Germany). For the MRI scan, all participants were required to lie down and not move with their heads held stationary by a foam pad. After the MRI scan, the ventromedial prefrontal cortex was selected as the region of interest (ROI) (size: 30 mm × 30 mm × 30 mm); researchers carefully avoided the influence of the frontal bone and the cerebrospinal fluid in the corpus callosum and the anterior horn of the lateral ventricle (as shown in Figure 2). The MRS scanning sequence parameters were as follows: the MEshcher-GArwood Point RESolved Spectroscopy sequence (MEGA-PRESS)[11] was used to integrate multiple single-voxel elements with repetition time (TR)=1500 ms, echo time (TE)=69 ms, editing frequency=1.9 ppm, Delta frequency=-1.7 ppm, editing bandwidth=45 Hz, and the number of signal averages (NSA)=128. The MRI was calibrated and shimmed manually before scanning to make full width at half maximum (FWHM) less than 15 Hz, and we used chemical shift imaging stimulated by a radio-frequency pulse (RF pulse) to attenuate the fluid signal and make the water suppression rate (WS rate) over 98%. The whole process of scanning lasted 6.5 min.
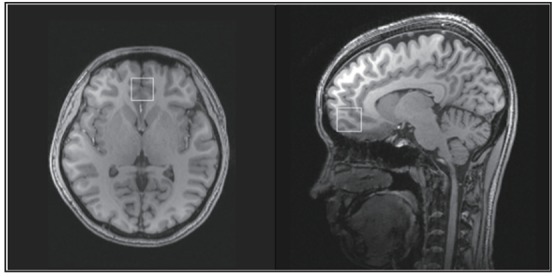
Figure 2. Location of the ventromedial prefrontal cortex in the magnetic resonance spectroscopy scan
2.3. Data analysis
1H-MRS spectral data analysis was completed by the Shanghai Mental Health Center and the College of Biomedical Engineering at Shanghai Jiao Tong University. LCModel Software[12] was used to calculate the peak value and area under the peak of the spectral lines for GABA, N-acetylaspartate (NAA), glutamate (GLU), and glutamine (GLN). The absolute concentration of GABA and the other metabolites was then computed based on these values.
Statistical analyses used the SPSS 17.0 software package. Comparisons between the patient and control groups used Chi-square tests for categorical data and independent t-tests for continuous variables. With the exception of the duration of active psychotic symptoms, continuous measures in patients (PANSS scores, age, etc.) were all normally distributed, so the association between patient variables and metabolite concentrations were assessed using Pearson correlation coefficients; the association with duration of illness was assessed using Spearman correlation coefficients. All tests were two-tailed and the level of statistical significance was set at a p-value of 0.05.
This study was approved by the ethics committee of the Shanghai Mental Health Center
3. Results
As shown in Table 1, there were no significant differences in the age, gender distribution, or level of education between the patient group and the control group.
Table 1. Comparison of the demographic characteristics and the density of brain metabolites in the ventromedial prefrontal cortex of 22 individuals with first-episode psychosis and 23 healthy controls
| characteristic | first-episode psychosis group |
control group | statistic | p-value |
| mean (sd) age | 26.1 (5.8) | 25.5 (4.4) | t=0.40 | 0.690 |
| female, n (%) | 13 (59.1%) | 13 (56.5%) | X2 =0.03 | 0.862 |
| mean (sd) years of education | 13.7 (2.4) | 13.9 (2.2) | t=-0.21 | 0.327 |
| mean (sd) concentration of γ-aminobutyric acid (GABA), mM | 2.28 (0.54) | 1.93 (0.32) | t=2.62 | 0.012 |
| mean (sd) concentration of N-acetylaspartic acid (NAA), mM | 4.22 (0.80) | 4.45 (0.81) | t=-0.99 | 0.329 |
| mean (sd) concentration of glutamic acid (GLU), mM | 2.78 (1.40) | 2.29 (1.06) | t=1.30 | 0.200 |
| mean (sd) concentration of glutamine (GLN), mM | 4.07 (2.60) | 3.71 (1.36) | t=0.59 | 0.444 |
The mean (sd) density of GABA in the vmPFC of patients was significantly greater than the corresponding value in control subjects (2.28 [0.54] v. 1.93 [0.32] mM, respectively; t=2.62, p=0.012), but the mean densities of the three other metabolites assessed - N-acetylaspartic acid (NAA), glutamic acid (GLU), and glutamine (GLN) - were not significantly different between the groups.
In the control group, mean GABA density was not significantly different by gender (2.02 [0.16] mM in men v. 2.05 [0.19] mM in women; t=-0.52, p=0.611) and it was not significantly associated with age (r=-0.05, p=0.822) or duration of education (r=0.04, p=0.870). In the patient group, mean GABA density was also unrelated to gender (2.46 [1.12] mM in men v. 2.35 [0.54] mM in women; t=0.31, p=0.757) and to duration of education (r=0.27, p=0.464), but it was significantly associated with age (r=0.47, p=0.026).
In the patient group, the mean (sd) total PANSS score at the time of enrollment was 69.2 (15.4), and the mean scores of the positive symptoms, negative symptoms, and general psychopathology subscales were 19.5 (4.4), 15.6 (5.7), and 34.1 (8.4), respectively. None of these clinical measures were significantly correlated with the concentration of GABA in the patients’ vmPFC: the Pearson correlation coefficient of GABA density with PANSS total score was 0.13 (p=0.559), and the corresponding correlation coefficients for the positive symptoms, negative symptoms, and general psychopathology subscales were 0.21 (p=0.361), -0.14 (p=0.538), and 0.21 (p=0.357), respectively. Moreover, GABA concentration in the vmPFC was not significantly associated with the total duration of illness at the time of the MRI examination (rs=-0.09, p=0.693) or with the duration of untreated psychosis (rs=0.16, p=0.490).
4. Discussion
4.1. Main findings
There were two main findings in the present study: 1) GABA density in the vmPFC of patients with first-episode psychosis was significantly higher than the GABA density in the wmPFC of healthy controls; and 2) GABA density in the vmPFC of patients with first-episode psychosis shows a positive correlation with age but no significant correlation with the duration of the illness or with the severity of psychotic symptoms.
4.2. Limitations
Several limitations need to be considered. (a) The sample included two groups of patients with first-episode psychosis, those with a total duration of illness of at least 6 months who met the criteria for schizophrenia at the time of entry, and those with at least 1 month of active psychosis who met diagnostic criteria of schizophreniform psychosis at the time of enrollment (i.e., a total duration of illness of under 6 months) and subsequently met full criteria of schizophrenia. This diagnostic heterogeneity may have decreased the power of the study to identify important differences. (b) For clinical reasons it was necessary to treat some of the first-episode patients in the study with antipsychotic medications for one or two days prior to the MRI examination, so the sample was not entirely ‘drug-naïve’; however, it is unlikely that this brief treatment period would have resulted in immediate changes in GABA concentration in the vmPFC, so the sample is a reasonable approximation of a drug-naïve sample. (c) The sample size was quite small, so failure to identify significant correlationships between GABA concentration in the vmPFC and demographic or clinical variables in patients with schizophrenia may have been due to low power (that is, Type II errors). (d) This is a cross-sectional study so we were unable to assess any potential changes in GABA density in the vmPFC before and after the use of antipsychotic medication. Larger studies that follow first-episode patients as they start treatment with antipsychotic medications are needed to help clarify the role of GABA in the etiology and developmental trajectory of schizophrenia.
4.3. Importance
Gamma-aminobutyric acid (γ-aminobutyric acid, GABA) is a neurotransmitter that can inhibit discharge of pyramidal neurons in the cerebral cortex, and, thus, potentially plays an important role in the coordination of cortical functioning. Abnormal metabolism of GABA and glutamate may be influential in triggering episodes of schizophrenia.[13,14] Early studies in rats found that a dopamine receptor antagonist could elevate the density of GABA in the vmPFC[15] and that the dopamine receptor D2 could lower GABA density in the vmPFC.[16] However, a study by Tayoshi and colleagues[17] did not find abnormal GABA density in the brains of patients with chronic schizophrenia.
The present study assessed GABA in the vmPFC of patients with first-episode psychosis who had not received a course of antipsychotic medication (though some of the patients had received one or two days of medication), so the potential influence of antipsychotic medication and of chronic illness on GABA concentration was minimized. Our finding of a significantly higher concentration of GABA in the vmPFC of individuals with first-episode psychosis compared to that in healthy controls is consistent with the findings of two other studies in first-episode patients.[18,19] Taken together, these findings suggest that measures of structural and functional abnormalities of GABA neurons in the vmPFC could be used as one of the biomarkers of schizophrenia.
One previous study in first-episode schizophrenia by Kegeles and colleagues[19] reported significant relationships between GABA density in the vmPFC and the severity of psychotic symptoms. Our study found no such relationship; the difference may because our sample size was relatively small (increasing the risk of Type II errors) or because the duration of illness in our study was much shorter than that in the study by Kegeles and colleagues (mean of 19 months versus a mean of 7 years). Another unexpected finding in our study was the significant correlation between GABA density in the vmPFC with the age of patients (but not controls); further studies with larger samples are needed to confirm this finding.
Biography

Dr. Zhilei Yang obtained a bachelor’s degree from Wannan Medical College in 2007. He is currently a master’s student in the Division of Psychosis at the Shanghai Mental Health Center, Shanghai Jiao Tong University School of Medicine. He has been working at the Shanghai Jiading District Mental Health Center since 2009 where he is a chief physician. His main research interest is brain imaging of schizophrenia.
Funding Statement
This study was supported by the Shanghai Municipal Severe Mental Illness Key Laboratory Programme (14-K03), the Shanghai Municipal Health System Important Disease Cooperative Research Programme (2014ZYJB0002), the Shanghai Municipal Commission of Health and Family Planning Key Programme (20134006), the Shanghai Municipal Hospital Appropriate Technology Programme (SHDC12014214), the Programme of the National Natural Science Foundation of China (81371479), a research grant from the Shanghai Mental Health Center (2012-YJ-06), and a grant from the Shanghai Municipal Mental Illness Clinical Medicine Center (2014).
Footnotes
Conflict of interest statement: The authors declare no conflict of interest related to this manuscript.
Informed consent: Every patient and patient’s guardian signed a consent form at the beginning of the study.
Ethics approval: The ethics committee of the Shanghai Mental Health Center approved the study (approval number: 2013- 03R).
Authors’ contributions: DL participated in the design and data collection for the study and drafted the first version of the manuscript. ZY, TC, ZS, LM, and YW enrolled and clinically evaluated study subjects. YZ, YL, ZY, and JZ performed and analyzed the neuroimaging examinations. YX and KJ carried out the clinical diagnosis and critically reviewed the manuscript. All authors read and approved the final manuscript.
References
- 1.Andreasen NC. Positive vs. negative schizophrenia: a critical evaluation. Schizophr Bull. 1985; 11(3): 380–389. doi: 10.1093/schbul/11.3.380. [DOI] [PubMed] [Google Scholar]
- 2.Yang ZL, Liu DT. [Research progress of magnetic resonance spectroscopy in schizophrenia]. Jing Shen Yi Xue Za Zhi. 2015; 28(5): 393–396. doi: 10.3969/j.issn.2095-9346.2015.05.024. Chinese. [DOI] [Google Scholar]
- 3.Benes FM, Berretta S. GABAergic interneurons: implications for understanding schizophrenia and bipolar disorder. Neuropsychopharmacol. 2001; 25(1): 1–27. doi: 10.1016/S0893-133X(01)00225-1. [DOI] [PubMed] [Google Scholar]
- 4.Rowland LM, Kontson K, West J, Edden RA, Zhu H, Wijtenburg SA, et al. In vivo measurements of glutamate, GABA and NAAG in schizophrenia. Schizophr Bull. 2013; 39(5): 1096–1104. doi: 10.1093/schbul/sbs092. [DOI] [PMC free article] [PubMed] [Google Scholar]
- 5.Goto N, Yoshimura R, Moriya J, Kakeda S, Ueda N, Ikenouchi-Sugita A. Reduction of brain gamma-aminobutyric acid (GABA) concentrations in early-stage schizophrenia patients: 3T Proton MRS study. Schizophr Res. 2009; 112(1-3): 192–193. doi: 10.1016/j.schres.2009.04.026. [DOI] [PubMed] [Google Scholar]
- 6.Taylor SF, Tso IF. GABA abnormalities in schizophrenia: a methodological review of in vivo studies. Schizophr Res. 2015; 167(1-3): 84–90. doi: 10.1016/j.schres.2014.10.011. [DOI] [PMC free article] [PubMed] [Google Scholar]
- 7.Mason MF, Norton MI, Van Horn JD, Wegner DM, Grafton ST, Macrae CN. Wandering minds: the default network and stimulus-independent thought. Science. 2007; 315(5810): 393–395. doi: 10.1126/science.1131295. [DOI] [PMC free article] [PubMed] [Google Scholar]
- 8.American Psychiatric Association. Diagnostic and Statistical Manual of Mental Disorders, 5th ed. Washington: American : Psychiatric Association; 2013. [Google Scholar]
- 9.Sheehan DV, Lecrubier Y, Sheehan KH, Amorim P, Janavs J, Weiller E, et al. The Mini-International Neuropsychiatric Interview (M.I.N.I.): the development and validation of a structured diagnostic psychiatric interview for DSM-IV and ICD-10. J Clin Psychiatry. 1998; 59(Suppl 20): 22–23. [PubMed] [Google Scholar]
- 10.Kay SR, Fiszbein A, Opler LA. The Positive and Negative Syndrome Scale (PANSS) for schizophrenia. Schizophr Bull. 1987; 13(2): 261. doi: 10.1093/schbul/13.2.261. [DOI] [PubMed] [Google Scholar]
- 11.Waddell KW, Avison MJ, Joers JM, Gore JC. A practical guide to robust detection of GABA in human brain by J-difference spectroscopy at 3 T using a standard volume coil. Magn Reson Imaging. 2007; 25(7): 1032. doi: 10.1016/j.mri.2006.11.026. [DOI] [PMC free article] [PubMed] [Google Scholar]
- 12.Provencher SW. Estimation of metabolite concentrations from localized in vivo proton NMR spectra. Magnet Reson Med. 1993; 30(6): 672–679. doi: 10.1002/mrm.1910300604. [DOI] [PubMed] [Google Scholar]
- 13.Lisman JE, Coyle JT, Green RW, Javitt DC, Benes FM, Heckers S, et al. Circuit-based framework for understanding neurotransmitter and risk gene interactions in schizophrenia. Trends Neurosci. 2008; 31(5): 234–242. doi: 10.1016/j.tins.2008.02.005. [DOI] [PMC free article] [PubMed] [Google Scholar]
- 14.Lewis DA, Moghaddam B. Cognitive dysfunction in schizophrenia: convergence of gamma-aminobutyric acid and glutamate alterations. Arch Neurol. 2006; 63(10): 1372–1376. doi: 10.1001/archneur.63.10.1372. [DOI] [PubMed] [Google Scholar]
- 15.Grobin AC, Deutch AY. Dopaminergic regulation of extracellular gamma-aminobutyric acid levels in the prefrontal cortex of the rat. J Pharmacol Exp Ther. 1998; 285(1): 350–357. [PubMed] [Google Scholar]
- 16.Bourdelais AJ, Deutch AY. The effects of haloperidol and clozapine on extracellular GABA levels in the prefrontal cortex of the rat: an in vivo microdialysis study. Cereb Cortes. 1994; 4(1): 69–77. doi: 10.1093/cercor/4.1.69. [DOI] [PubMed] [Google Scholar]
- 17.Tayoshi S, Nakataki M, Sumitani S, Taniguchi K, ShibuyaTayoshi S, Numata S, et al. GABA concentration in schizophrenia patients and the effects of antipsychotic medication: a proton magnetic resonance spectroscopy study. Schizophr Res. 2010; 117(1): 83–91. doi: 10.1016/j.schres.2009.11.011. [DOI] [PubMed] [Google Scholar]
- 18.Choe BY, Kim KT, Suh TS, Lee P, Paik IH, Bahk YW. 1H magnetic resonance spectroscopy characterization of neuronal dysfunction in drug-naïve, chronic schizophrenia. Acad Radiol. 1994; 1(3): 211–216. doi: 10.1016/s1076-6332(05)80716-0. [DOI] [PubMed] [Google Scholar]
- 19.Kegeles LS, Mao XL, Stanford AD, Girgis R, Ojeil N, Xu XY, et al. Elevated prefrontal cortex (gamma) – aminobutyric acid and glutamate – glutamine levels in schizophrenia measured in vivo with proton magnetic resonance spectroscopy. Arch Gen Psychiatry. 2012; 69(5): 449–459. doi: 10.1001/archgenpsychiatry.2011.1519. [DOI] [PubMed] [Google Scholar]