

Summary
Forced expression of reprogramming factors can convert somatic cells into induced pluripotent stem cells (iPSCs). Here we studied genome topology dynamics during reprogramming of different somatic cell types with highly distinct genome conformations. We find large-scale topologically associated domain (TAD) repositioning and alterations of tissue-restricted genomic neighborhoods and chromatin loops, effectively erasing the somatic-cell-specific genome structures while establishing an embryonic stem-cell-like 3D genome. Yet, early passage iPSCs carry topological hallmarks that enable recognition of their cell of origin. These hallmarks are not remnants of somatic chromosome topologies. Instead, the distinguishing topological features are acquired during reprogramming, as we also find for cell-of-origin-dependent gene expression patterns.
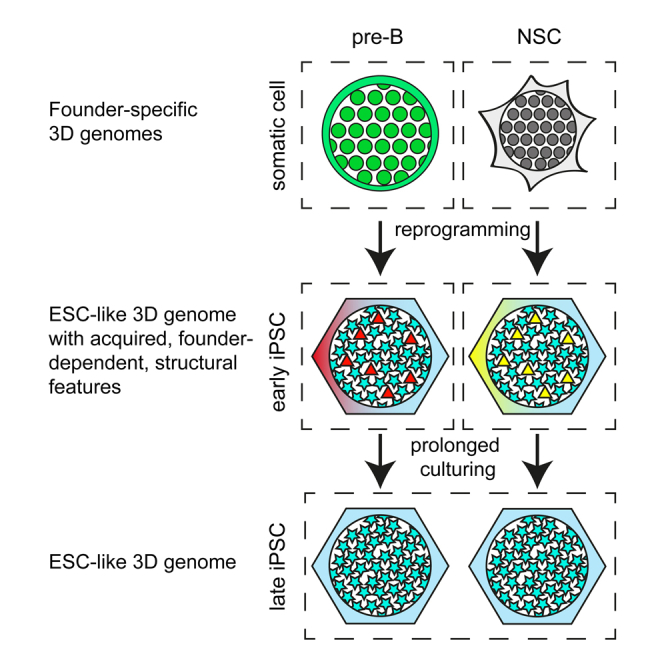
Graphical Abstract
Highlights
-
•
The 3D genome topology of four somatic cell types varies greatly and differs from ESCs
-
•
The 3D genomes of iPSCs from different founders and of ESCs are overall highly similar
-
•
Early-passage iPSCs show subtle but reproducible founder-dependent 3D differences
-
•
The distinctive topology features of iPSCs are acquired during reprogramming
Krijger et al. report that the reprogramming of four somatic cell types with highly distinct 3D genomes results in pluripotent cells with largely identical, ESC-like, genome conformations carrying founder-dependent topological hallmarks. The latter are not remnants of somatic chromosome topologies but are acquired during reprogramming in a cell-of-origin-dependent manner.
Introduction
Somatic cells can be reprogrammed into induced pluripotent stem cells (iPSCs) by overexpression of the transcription factors OCT4, SOX2, KLF4, and MYC (OSKM) (Takahashi and Yamanaka, 2006). Regardless of tissue origin, IPSCs possess full developmental potential in vitro, form teratomas in vivo, and are even capable of generating “all-iPSC mice” after injection into tetraploid blastocysts (Zhao et al., 2009). Their ability to contribute to all tissues makes iPSCs attractive for disease modeling and for regenerative medicine. Recently, it was reported that the differentiation propensity of iPSCs reflects the tissue of origin, such that neural-derived iPSCs more readily differentiate into neurons, and blood-cell-derived iPSCs are biased toward the hematopoietic lineage (Bar-Nur et al., 2011, Kim et al., 2010, Nishino et al., 2011, Polo et al., 2010). This tissue of origin memory has been shown to be associated with differences in epigenetic features. Residual DNA methylation marks were found at promoters in early iPSCs, presumably stably silencing genes that act in specifying lineages other than the donor cell type (Kim et al., 2010). Early passage iPSCs obtained from different cell types were also found to have distinct gene expression profiles. Some of the distinguishing genes appeared to show residual cell-of-origin-specific transcription, which was interpreted to reflect memory of the transcriptional status in founder cells (Polo et al., 2010). The founder-dependent transcription and DNA methylation profiles were lost upon prolonged passaging of the iPSCs or after treatment with chromatin-modifying drugs (Kim et al., 2010, Polo et al., 2010).
Different cell types also show distinct 3D chromatin structures (Dixon et al., 2015, Rao et al., 2014), and genome topology is increasingly appreciated as an important contributor to genome functioning. Chromosomes can be subdivided into topologically associated domains (TADs), structural units within which sequences preferentially contact each other (Dixon et al., 2012, Nora et al., 2012, Sexton et al., 2012). TADs serve to physically restrain interactions of enhancers with their target gene promoters (Nora et al., 2012). TAD organization is relatively stable during development, but contacts within TADs can dynamically change between cell types (Phillips-Cremins et al., 2013). While some enhancer-promoter contacts seem tissue invariant, others are specifically established during differentiation, contributing to tissue-specific transcription programs (de Laat and Duboule, 2013, Rao et al., 2014). To what degree this is also true for higher levels of structural chromatin organization is not fully understood yet, but some TADs switch between genomic neighborhoods, or compartments, in a cell-type-dependent manner (Dixon et al., 2015, Rao et al., 2014). The genome of embryonic stem cells (ESCs), for example, uniquely brings together distal chromosomal regions that are densely packed with pluripotency factors, which creates a configuration proposed to contribute to maintenance of pluripotency (de Wit et al., 2013). Furthermore, it has been shown that the pluripotency genes Nanog and Oct4 make specific long-range interactions in ESC and iPSCs, which are lost during differentiation (Apostolou et al., 2013, Denholtz et al., 2013, Wei et al., 2013). However, little is known to what extent the overall 3D genome of somatic cells and their iPS derivatives differ, how stable such differences are, and how similar the 3D configurations of iPSC and ESC genomes are.
Here we show that somatic cell reprogramming is accompanied by massive changes in genome topology, which, irrespective of the cell type of origin, converge on the 3D structure of the pluripotent genome. Despite this, distinct topological features separate early passage iPSCs according to their cell type of origin, and these differences seem to be acquired during reprogramming in a founder-cell-dependent manner.
Results
To study how reprogramming of somatic cells affects nuclear organization, we used reprogrammable, OSKM-inducible, mice (Carey et al., 2010). We generated three independent iPS cell lines each from four different founder cell types, i.e., pre-B cells, bone-marrow-derived macrophages (MΦ), neural stem cells (NSCs), and mouse embryonic fibroblasts (MEFs) (Figure 1A). iPSCs were established after picking of doxy-independent colonies at day 20 of reprogramming (15 days of reprogramming in the presence of doxy + 5 days without doxy) and were expanded for an additional 3 passages or 20 passages to obtain early (p3) and late (p20) passage iPS lines, respectively. Both p3 and p20 passage iPSC lines showed characteristic ESC-like morphology, expressed markers of pluripotency, as shown by immunofluorescence and fluorescence-activated cell sorting (FACS), and could be maintained in a transgene-independent manner (Figures 1B, 2A, and S1A). Furthermore, p3 iPSCs derived from each cell type gave rise to chimeras upon blastocyst injection (Figure 1C). Importantly, embryoid bodies (EBs) obtained from the various p3 iPSC lines showed a differentiation bias toward the cell type of origin (Figure S1B). EBs derived from pre-B-iPSCs and MΦ-iPSCs showed higher expression of the hematopoietic-associated genes Cd45, Cd41, Itgam (Mac-1), and Hoxb4, while the neuronal-associated genes Nestin and Pax6 were more highly expressed in EBs derived from NSC-iPSCs. In contrast, the endoderm associated gene Sox7 showed no such a bias (Figure S1C). The blood and neural origin bias was lost in p20 iPSCs (Figure S1D). These findings confirm the tissue-of-origin memory of early passage iPSCs described previously (Bar-Nur et al., 2011, Kim et al., 2010, Polo et al., 2010).
Figure 1.

Generation of p3 and p20 iPSCs from Somatic Cells Isolated from Reprogrammable Mice
(A) Schematic representation of the generation and analysis of p3 and p20 iPSCs from pre-B cells, neural stem cells (NSCs), macrophages (MΦ), and mouse embryonic fibroblasts (MEFs) isolated from reprogrammable, OSKM-inducible, Oct4-GFP reporter mice. P3 iPS lines show ESC characteristics. See also Figure S1.
(B) P3 iPSCs derived from pre-B cells, NSC, MΦ and MEF show characteristic ESC-like morphology and express GFP from the Oct4-GFP reporter and NANOG and SSEA-1 proteins.
(C) Chimeras generated by blastocyst injection of p3 iPSCs.
Figure 2.

Cell of Origin Influences Gene Expression in p3 iPSCs
(A) Heatmap showing the expression of pluripotency genes in founder cells and p3 iPSCs.
(B) Correlation matrix (Spearman’s ρ) of expression data of founder cells, p3 iPSCs, p20 iPSCs, and E14 ESC (n = 2 for all).
(C) Correlation matrix (Spearman’s ρ) of H3K27ac ChIP-seq of pro-B, MΦ, MEFs, NSCs, and p3 iPSCs.
(D) Heatmap representing H3K27ac enrichment in pro-B, MΦ, MEFs, NSCs, and p3 iPSC. The coverage within 3-kb upstream and downstream of the summit of each H3K27ac peak was calculated and shown for the indicated cell types.
(E) Heatmap representing H3K27ac enrichment in pro-B, MΦ, MEFs, NSCs, and p3 iPSCs (similar to D). Genomic regions are the combined ChIP-seq peaks identified in p3 iPSCs.
(F) Unsupervised hierarchical clustering of the transcription profiles of p3 iPSCs.
(G) k-means clustering of 1,717 differentially expressed genes between the p3 iPSCs. Relative expression change of each differentially expressed gene (as compared with their median expression level across all experiments) is indicated for the founder cells, p3 iPSC and p20 iPSC (n = 2, for every cell type). Clusters and expression difference range (color gradient) are shown.
See also Figure S2.
To systematically compare the transcriptomes of the four founder cell types and of their iPSC derivatives, we performed genome-wide expression analysis. Pre-Bs, NSCs, MΦs, and MEFs had highly divergent transcription profiles yet were very similar between biological duplicates (Figure 2B). We identified 13,880 unique genes that were differentially expressed (at an FDR of 0.01) by the four cell types. Reprogramming of the four somatic cells resulted in loss of tissue-specific expression programs and yielded transcriptomes that highly correlated between all iPS lines and strongly corresponded to an ESC-like expression pattern (Figures 2A and 2B). Similarly, active enhancer profiles, as defined by histone H3 lysine 27 acetylation (H3K27ac) were also very different between founder cells (Creyghton et al., 2010, Lane et al., 2014, Yue et al., 2014) (Figure 2D) but became highly similar after reprogramming in all iPSCs (Figures 2C and 2E), with cell-of-origin-specific sites having very little residual enhancer marks (Figure 2D).
Although expression profiles in both p3 and p20 iPSCs were highly correlated, unsupervised hierarchical clustering of the transcription profiles revealed that p3 passage iPSCs derived from the same cell of origin clustered together (Figure 2F). Indeed, 1717 unique genes were differentially expressed (FDR of 0.05) between p3 iPSCs derived from different founders. This indicated that the cell type of origin left a mark on transcription in fully reprogrammed p3 passage iPSCs. In contrast, p20 iPSCs showed clearly reduced gene expression clustering (Figure S2A) and only two genes with reproducibly founder-dependent differential expression (FDR of 0.05). This is consistent with previous reports demonstrating that iPSCs transiently retain cell-type-of-origin differences in gene expression (Kim et al., 2010, Polo et al., 2010). To further understand transcriptional differences and similarities between p3 passage iPSCs derived from different cell types, we performed k-means clustering and identified seven clusters of genes in p3 iPSCs (Figure 2G). To determine whether their differential expression echoed previously established transcription patterns in the cells of origin, we calculated the correlation in expression on a gene-by-gene basis between founders and iPSCs. For p3 iPSCs the expression of genes in most clusters showed little correlation with that of the founders, with the exception of cluster 2 (Figures 2G and S2B) (p < 0.001, Wilcoxon rank sum test). In agreement, Gene Ontology analysis using Webgestalt (Zhang et al., 2005) only showed a clear enrichment of functional categories for cluster 2, namely for genes involved in the immune system and collagen (Figure S2C). Consistent with this annotation, genes in this cluster are highly expressed in MΦ-p3 iPSCs and in MEF-p3 iPSCs but not in NSC-derived iPSCs. Vice versa, when we clustered genes according to tissue-specific expression patterns in the founders, we also found no indications for systematic memory of cell-type-specific expression programs in the corresponding p3 and p20 iPSCs (Figure S2D). Furthermore, when we selected tissue-specific genes based on their >4-fold higher expression in one of the founding somatic cell lines compared the other three, we found that none of the genes maintained this difference in transcriptional output in the corresponding iPSCs. Only when we lowered the threshold for differential expression among iPSCs to 1.4-fold, a small number of genes (22) were reproducibly scored across all lineages (16 for MΦ, 5 for pre-B, 1 for MEF, and 0 for NSC) as having a founder-specific expression profile. Collectively, this showed that overall cell-type-specific expression programs were efficiently erased and replaced by ESC-like transcription programs during reprogramming. In addition, reproducible cell-type-of-origin-specific gene expression patterns exist in p3 iPSCs, although only for one gene cluster this is related to a founder-specific gene expression program. The remaining founder-dependent gene expression patterns in p3 iPSCs appear reproducibly acquired during reprogramming, possibly as a consequence of cell-type-specific reprogramming events.
Reprogramming Is Accompanied by Massive Chromosome Topology Changes
To investigate how nuclear organization changes during reprogramming, we used a frequently cutting restriction enzyme (DpnII) to generate genome-wide Hi-C contact maps for each of the four founder cell types and their respective p3 and p20 iPSC derivatives. We prepared Hi-C data from two to three independent clones (with the exception of the NSC founder, from which only one Hi-C library was created), which we combined for each cell type, resulting in Hi-C maps based on 39-72M valid reads (Table S1).
We first compared the overall chromosome organization of the different cell types by partitioning the genome into regions of 300kb and plotting all interactions between these regions as a heatmap and a correlation heatmap (Figure 3A; Table S2). As expected, most interactions occurred in cis and at close distance, although many long-range contacts beyond the level of TADs can be observed. Closer inspection of the heatmaps revealed clear differences in genome folding between the different somatic cell types. Reprogramming erased many of these tissue-specific configurations and created a 3D genome that was highly similar between all iPS lines. Previous Hi-C studies have shown that chromosomal regions can be segregated into two main nuclear compartments (Lieberman-Aiden et al., 2009). Regions within the same compartment preferentially interacted with each other and were highly enriched for, respectively, active (compartment A) or inactive chromatin (compartment B) (Lieberman-Aiden et al., 2009). We found that the distribution of genomic regions between these compartments differed strongly between the somatic lines (Figures 3A–3C), with 28% of the genome located in a different compartment in at least one of the founders. This percentage is not very different from the 36% of the genome that was found to change compartments during in vitro differentiation (Dixon et al., 2015). Genes tissue specifically residing in the A compartment showed increased expression levels in the corresponding cell type, while those tissue specifically located in the B compartment showed reduced transcriptional output as compared with that in the other tissues (Figure S3). An example of such a gene (Ly6d) with tissue-specific activity and corresponding nuclear location in pre-B cells is shown in Figure 3D.
Figure 3.

Reprogramming Is Accompanied by Massive Chromosome Topology Changes
(A) Normalized Hi-C contact frequency heatmap (top) and correlation heatmap (bottom) at 300-kb resolution for chr13.
(B) The first eigenvector of the Hi-C correlation matrix is plotted along the linear sequence of chr13 and used as the A (orange) and B (blue) compartment segmentation. Grey bars indicate regions located in differential compartments in one of the cell lines.
(C) Scatterplot of the eigenvector for all 300-kb regions in the genome comparing the founders (blue), the p3 iPSC (red), and the p3 iPSC compared with E14 ESC (black).
(D) Expression and A/B compartment location of the pre-B-specific Ly6d gene. Box indicates chromosomal position of Ly6d. See also Figure S3.
(E) Expression and A/B compartment location of the Sox2 gene. Box indicates chromosomal position of Sox2.
(F) Distribution of gene expression change for genes that switched from the B to A compartment (orange), from the A to the B (blue) or that did not switch compartments (gray). Genes that relocated from the B compartment to the A compartment during reprogramming showed an increase in expression compared with genes that did not switch compartments, while genes that switched from the A to the B compartment showed reduced expression in iPSCs.
For every cell type of origin, reprogramming efficiently erased the tissue-specific division of genomic regions over the A and B compartments and induced a compartment structure that is very similar to what is found in ESCs (Figures 3A–3C). Already in p3 passage iPSCs, 99.9% of the genome resided in identical compartments, which increased to 99.95% in p20 iPSCs. For example, Sox2 was found to be expressed and located in the active compartment in NSCs, but inactive and located in the B compartment in the other somatic cell types. Reprogramming induced the expression of endogenous Sox2 and relocated the gene to the active compartment in iPSCs derived from pre-B, MΦ, and MEF (Figure 3E). Genes that switched compartments during reprogramming changed their expression levels more often than genes that did not switch compartments (Figure 3F), with genes relocating from B to A showing an overall increase in expression, and vice versa, genes switching from A to B showing an overall reduction in expression in iPSCs. A similar, albeit more subtle, correlation between expression changes and compartment switching was observed before during in vitro differentiation (Dixon et al., 2015).
These data demonstrate that somatic founder cells generally structure their chromosomes very differently, but reprogramming induces these differences to disappear and genomes to adopt an ESC-like higher order structure (Figure 3C). Thus, independently of the somatic founder cell type, reprogramming into iPSCs leads to a convergence of the 3D genomes to an ESC-like topology.
Reprogramming Establishes Topological Hallmarks of the Pluripotent Genome
The pluripotent genome was previously found to have some unique topological features (de Wit et al., 2013, Denholtz et al., 2013). One such hallmark is the preferential long-range contacts between regions with high-density binding sites of the pluripotency factors NANOG, OCT4, and SOX2 (de Wit et al., 2013). To understand whether reprogramming reshapes the genome to establish this ESC-specific configuration, we performed paired-end spatial chromatin analysis (PE-SCAn), an algorithm combining ChIP-seq data with Hi-C data (de Wit et al., 2013). PE-SCAn applied to founder cells showed, as expected, no spatial clustering of NANOG-, OCT4-, and SOX2-rich regions. P3 passage iPSCs, however, did show strong preferential clustering of these regions (Figures 4A and 4B). This indicates that during reprogramming chromosomes are refolded such that clusters of binding sites of pluripotency factors contact each other in nuclear space. We found that 3D configurations specific for somatic cells were simultaneously lost during reprogramming. For example, regions dense in binding sites of PU.1, an essential factor for the development of immune cells, showed preferential contacts in pre-B cells but not in the other somatic cell types or in p3 iPSCs, including the pre-B-cell-derived lines (Figure 4A). Another interesting example is SOX2, which is expressed both in NSCs and iPSCs but binds to a completely different repertoire of sites in the two cell types (Lodato et al., 2013). PE-SCAn analysis revealed that the NSC-specific SOX2-associated regions exclusively clustered in NSCs, whereas the ES-specific SOX2-bound regions only did so in iPSCs (Figure 4B). Altogether, the results demonstrate that reprogramming reshapes the genome to erase somatic cell-type-specific topological features and establishes a conformation unique to the pluripotent cell genome.
Figure 4.

Reprogramming Establishes Topological Hallmarks of the Pluripotent Genome
(A) PE-SCAn analysis plots in which long-range intrachromosomal Hi-C contacts (>5 Mb) in pre-B and corresponding p3 iPSC are aligned to ChIP-seq binding site clusters (more than five sites in 50 kb) of PU.1 in B cells (top) and OCT4 in ESCs (bottom).
(B) Same as (A), but using Hi-C data from NSC and corresponding p3 iPSC and SOX2 binding site clusters in NPCs (top) and ESCs (bottom).
(C) Schematic explaining the domain score.
(D) Correlation matrix (Spearman’s ρ) of the domain score for pre-B (n = 2), MΦ (n = 2), MEFs (n = 3), NSCs (n = 1) and p3 and p20 iPSCs derived from pre-B (n = 3), MΦ (n = 3), MEFs (n = 3), and NSCs (n = 3).
See also Figure S4.
Reprogramming Alters Domain Organization
Our data so far established that the relative positioning of chromosomal regions is strongly reorganized during reprogramming, raising the question whether this is also true for more local topological features such as TADs. To assess how domain organization is affected by reprogramming, we annotated TADs in the Hi-C map from p3 passage iPSCs (Table S3, with a size range of 20.4 kb to 7.6 Mb, median size 526 kb) and compared chromatin interactions in these domains between all cell types.
Recently various reports introduced a domain score, a measure for the degree of connectivity within a TAD (Chandra et al., 2015, Dixon et al., 2015). For each TAD we calculated this domain score as the fraction of intradomain contacts over its total number of cis contacts (Figure 4C). As seen before (Dixon et al., 2015), genes in domains with a high domain score showed higher expression than genes in domains with a lower score (Figure S4A). A high domain score therefore does not reflect compaction, but rather compartmentalization of the domain. In agreement, lamina-associated domains (LADs), which have been linked with compacted chromatin (Peric-Hupkes et al., 2010), overlapped mostly with TADs that had a low domain score (Figure S4B).
Comparing the domain score between the different Hi-C maps revealed a strong correlation between biological replicates, but not between different somatic cell types (Figure 4D). Tissue-specific genes often resided in TADs with an above average, cell-type-specific, domain score (Figure S4C). Reprogramming of the four cell types resulted in highly correlated domain scores across all iPSCs and similar to the scores measured in ESCs (Figure 4D). Thus, also at the intra-TAD level reprogramming was accompanied by large-scale topological changes, resulting in domains that overall are fairly uniformly organized between all iPSC lines.
Chromatin Looping Changes at Tissue-Specific Genes
Although our datasets are relatively sparse compared with published multibillion read datasets (Rao et al., 2014), we could clearly see chromatin loops at multiple sites in the genome (exemplified for two genes in Figure 5A). To identify chromatin loops in a systematic manner, we developed an algorithm that deals with relatively sparse data (see Supplemental Experimental Procedures). We combined all the p3 iPSC line data into a dataset that contained over 220 million unique contacts. Based on these data, we identified 5,168 chromatin loops, 97% of which were found within a TAD (Table S4). The median loop size was 249 kb; 5% spanned less than 99 kb, and 5% spanned more than 590 kb. Intersecting these loops with CTCF binding sites observed by ChIP-seq in the iPSCs (see below) revealed that 67% of the chromatin loops were formed between pairs of CTCF sites. Consistent with previous reports (Rao et al., 2014), the participating CTCF sites were found overwhelmingly oriented in a convergent manner (Figure S5A). Analysis of the Hi-C datasets of the founder tissues revealed 2,741, 2,666, 846, 536 loops for pre-B cells, NSCs, MEFs, and MΦ, respectively (Table S4), which is in line with the number of informative read pairs sequenced per library.
Figure 5.

Chromatin Looping Changes at Tissue-Specific Genes
(A) Hi-C interaction heatmap showing chromatin loops in pre-B cells (upper triangle) and NSC (lower triangle) at the Pla2g7 (left) and Ski (right) locus. Tissue-invariant loops are indicated with a red arrowhead. Color scale indicates normalized Hi-C score (see Experimental Procedures). White scale indicates 100 kb.
(B) Meta-loop analysis of all loops identified in p3 iPSCs. Hi-C data from all p3 iPSCs combined (upper triangle) are compared with Hi-C data from E14 ESC and pre-B cells (lower triangle). Loops are scaled to have the same size. In addition to the loop itself also 50% of the genome upstream of the loop and 50% of the genome downstream of the loop are shown. See also Figure S5.
(C) Absolute gene expression for genes located in pre-B-cell-specific loops.
(D) Meta-loop analysis of pre-B-specific loops.
(E) Hi-C interaction heatmap at the Ikaros, Ctgf, Anks1b, and F7 loci.
(F) Meta-loop analysis of iPSC-specific loops.
(G) Hi-C interaction heatmap for pre-B cells (upper triangle) and pre-B p3 iPSC (lower triangle) at the Sox2, Prdm14, Nanog, Fgf4, and Sox1 loci. Arrowheads at the Sox2 and Nanog loci correspond to previously identified loops in ESC and iPSC using 3C and 5C (Apostolou et al., 2013, Kagey et al., 2010, Phillips-Cremins et al., 2013).
To study the structural dynamics during reprogramming at the level of chromatin loops, we developed a Hi-C meta-loop analysis (Figure S5B). In this analysis, we aligned one of our Hi-C datasets on the loop calling data from another Hi-C dataset, scaled the data between the beginning and end of each loop, and projected all contact maps on top of each other. The resulting plots visualize whether loops scored in one tissue are overall conserved in other tissues. When we performed a meta-loop analysis of the p3 iPS loops in E14 ESC Hi-C data, we found a strong enrichment of contacts at the site of the loops (Figure 5B), showing that most loops called in iPSCs were conserved in ESCs. When we intersected the same iPS loops with Hi-C data from the founder tissues, we also found enrichment of contacts at the site of the loops (shown for pre-B cells in Figure 5B). Thus, the majority of chromatin loops scored in iPSCs is tissue invariable.
We then defined founder-specific loops as those being present in a given cell type but absent in all other somatic cell types. We could identify tissue-specific loops in pre-B, NSC, and iPSCs (346, 27, and 246, respectively). Genes associated with pre-B cell-specific loops were expressed significantly higher in pre-B cells than in the other cells (p < 0.0001, for all comparisons, Wilcoxon rank sum test; Figures 5C and S5C), supporting the idea that lineage-restricted chromatin loops contribute to tissue-specific transcriptional activity (Rao et al., 2014). We next asked whether such somatic cell-type-specific loops are retained in the corresponding iPSCs. Figure 5D shows that in general this was not the case. When we took the pre-B cell-specific chromatin loops, the meta-loop plot of pre-B cell derived iPSCs no longer showed preferential contacts between the loop anchors: in fact, the plot looked identical to that of another iPS line or of NSCs (Figure 5D). In all tissues, however, the intervening sequences appeared to form contact domains even in the absence of an encompassing chromatin loop. The expression bias seen in somatic cells (Figure 5C) disappeared with the loss of tissue-specific loops during reprogramming. Thus, the genes involved in pre-B-cell-specific chromatin loops, which are more highly expressed in pre-B cells than in other somatic cells, showed no residual increased expression in pre-B-derived iPSCs as compared with other iPSCs (Figure S5D). In addition, when inspecting individual gene loci, we could clearly see the disappearance of tissue-specific chromatin loops. For example, Ikaros, Ctgf, Anks1b, and F7 loci all contained strong chromatin loops in pre-B, MEF, NSC, and MΦ, respectively, of which most disappeared during reprogramming (Figure 5E). While the Hi-C metaloop analysis showed that the majority of founder-specific chromatin loops dissolve during reprogramming, it still remained possible that rare but possibly important tissue-specific loops are transmitted to their iPSC derivatives. To investigate this in more detail, we visually inspected the 346 pre-B-specific loops in the Hi-C datasets of pre-B cells and its reprogrammed derivatives. Also, upon visual inspection, the great majority (326) of these loops was found to dissolve upon reprogramming (for example, see Figure 5E). Twenty pre-B cell loops also showed an (often weak) looping signal in the pre-B derived p3 iPSCs, but 17 of these also had a looping signal in one or more of the unrelated iPSCs (for examples, see Figure S5E). The three pre-B-cell-specific loops that were transmitted to and exclusively detectable in pre-B-derived iPSCs located near Mcl1, Ccdc69, and Amph genes not known to be important for B cell identity. We therefore find no evidence for looping memory and conclude that tissue-specific chromatin loops near cell identity genes effectively dissolve during reprogramming.
Next, we analyzed the iPSC-specific loops in more detail. Intersections with other Hi-C data showed that these loops were also present in ESCs but absent in all founder Hi-C datasets (Figure 5F). This confirmed that they were formed de novo during reprogramming and were specific for pluripotent cells. When we checked the individual loci involved, we noticed that they often contained pluripotency genes, including Sox2, Prdm14, Nanog, Fgf4, and Sox1 (Figure 5G). Thus, while many chromatin loops, particularly those between domain boundaries, were conserved between ESCs, iPSCs and somatic cells types, there were also tissue-specific chromatin loops that contributed to cell-specific expression programs. During reprogramming, most somatic cell-specific loops were lost while new specific regulatory contacts, often involving pluripotency genes, were established.
We considered the possibility that not all important pluripotent loops are properly established during reprogramming. Our Hi-C datasets were of insufficient resolution to conclusively analyze this, but to get an impression, we focused on 207 loci previously established to contain super-enhancers in ESCs (Whyte et al., 2013), reasoning that the topologies of these loci are likely important for pluripotency. We could appreciate chromatin loops at 84 of these loci in ESCs, 37 of which were not appreciable in our pre-B Hi-C dataset. All but two of these loops were also detectable in the iPSC Hi-C data (for examples, see Figures S5F and S5G). The exceptions included the genes Tsc22d1 and, interestingly, Sall4, a known key pluripotency gene, where ES-specific loops were less appreciable in iPSCs. Sall4 expression was nevertheless induced in all iPSCs (Figure 2A), making it difficult to judge the functional significance of these differential DNA contacts. We conclude that reprogramming is accompanied by efficient loop formation at nearly all analyzed key pluripotent regulatory sequences, demonstrating that it robustly reshapes the chromatin not only at the TAD but also at the sub-TAD level to adopt a pluripotent conformation.
Acquisition of a Cell-of-Origin-Dependent 3D Genome during Reprogramming
To further search for a possible topological memory during reprogramming, we asked whether structural domains exist which keep a tissue-restricted positioning in either the A or B compartment during reprogramming. As shown before, nearly all domains adopted the same nuclear environment in p3 passage iPSCs irrespective of their cell of origin (Figure 3). Only three domains in pre-B cells and none in the other founder lines were found to maintain a cell-of-origin-specific location during reprogramming. The fact that only in pre-B cells a few domains memorized their founder-specific location during reprogramming suggests that topological memory during reprogramming, if it exists, is not detectable at this level of genome organization.
We then looked at the domain score; as explained before, this gives a measure for intra-TAD connectivity. Unsupervised hierarchical clustering based on the domain score revealed that, with three exceptions, all p3 iPSC lines clustered based on their cell of origin (Figure 6A). Intriguingly, the three exceptions (one Mϕ, one MEF, and one NSC-derived iPSC line) were the only three lines showing aneuploidy, carrying an extra copy of a chromosome (Figure S6A). Such genomic instability during reprogramming has been reported before (Weissbein et al., 2014). To identify the domains with a cell-of-origin-specific topology, we carried out k-means clustering on domain scores from p3 iPSCs lines with a normal karyotype. Figure 6B shows clusters of domains grouped according to conserved differences in domain score across the four types of p3 iPSCs. Unexpectedly, the same domain clusters in the founders showed uncorrelated scores within and between tissues, indicating that the cell-of-origin-dependent domain structures are not reflective of residual founder-specific structures and therefore not a consequence of 3D memory. To further understand, this we again performed k-means clustering but now based on the domain scores measured in the founder lines (Figure 6C). Seven distinct clusters of domains with unique founder-dependent structures could be delineated, but their tissue-restricted architectural features were not appreciable in either p3 or p20 iPSCs and were therefore efficiently erased during reprogramming. Indeed, there was no significant overlap between the founder and p3 iPSC defining domains (p = 0.3, hypergeometric test). Collectively, this shows that the 3D genome of iPSCs carries features that allow linking the cells to their cell of origin. These topological features, however, are not remnants of founder-specific 3D structures and therefore do not reflect “memory.” Rather, we propose that these distinguishing topological domain features are acquired during reprogramming in a reproducible and cell-of-origin-dependent manner.
Figure 6.

Cell-of-Origin-Specific 3D Genome Features in p3 iPSCs
(A) Unsupervised hierarchical clustering of the domain scores of p3 iPSCs.
(B) k-means clustering of TADs with differential domain scores between the p3 iPSCs. The relative domain score of each differential TAD is indicated.
(C) k-means clustering of TADs with differential domain scores between the founders. The relative domain score of each differential TAD is indicated.
(D) Absolute expression in the founders and in p3 iPSCs, of genes located in the clusters of TADs with differential domain scores at the p3 iPSC stage (see Figure 6B).
(E) Heatmap representing differential CTCF peaks in MEF p3 iPSCs, showing their presence in all founders, p3 iPSCs, and p20 iPSCs.
See also Figure S6.
Exploring the Cell-of-Origin-Dependent Topological Features
To explore the origin of founder-dependent domain structures, we first investigated whether they are associated with distinct expression patterns in p3 iPSCs. For this, we intersected the clusters of structural domains with the clusters of genes that showed cell-of-origin-dependent expression patterns in p3 iPSCs. No correlation was observed (data not shown), not even when considering all expressed genes in these domains and asking whether the domains showed any distinguishable transcriptional output in p3 iPSCs (Figure 6D). Thus, there seems no (causal) relationship between domains having a cell-of-origin-specific topology in p3 iPSCs and the expression of genes contained within these domains.
One could speculate that the erasure of founder-specific transcription programs is accompanied by tissue-restricted deposition of epigenetic marks at the corresponding genes, which, if maintained during reprogramming, causes cell-of-origin-specific structural features in p3 iPSCs. To investigate this, we performed an identical analysis as above, but now intersecting the Hi-C data from p3 iPSCs with founder-specific transcriptome data. Two iPSC clusters with cell-of-origin-specific domain scores were significantly enriched for genes with a founder-specific expression signature. Also, for some clusters, the overall transcriptional output differed specifically in the corresponding founder cells (Figure 6D).
Finally, we asked whether CTCF, a key chromatin architectural protein, could be involved in the establishment of specific structural features during reprogramming. For this, we performed CTCF ChIP-seq experiments, using a total of eight p3 and eight p20 iPSC lines, i.e., in duplicate for all founder tissues (Figure S6B). Already at p3, 50091 CTCF binding sites were shared between all eight iPSC lines. Reproducible, cell-of-origin-dependent differential CTCF binding sites were also observed, but these were relatively rare (327 for pre-B, 136 for NSC, 143 for MΦ, and 116 for MEF iPSCs) and showed low ChIP-seq scores (Figure S6C). Most of the differential cell-of-origin CTCF binding sites in p3 iPSCs were still conserved in the corresponding p20 iPSCs (Figure 6F). However, they were not detectable as CTCF bound sites in the corresponding founder cells, as judged from published ChIP-seq data. Thus, as also concluded for founder-associated expression patterns and domain structures, the founder-associated CTCF binding events observed in p3 iPSCs seem to have been acquired during reprogramming, rather than representing memory. Moreover, they were not enriched in any of the p3 passage structural domain clusters, implying that the cell-of-origin-specific 3D genome features are not related to rare and weak differential, cell-of-origin-associated, CTCF-binding events.
Discussion
Our results demonstrate that somatic cell genomes have highly distinct 3D structures that after cell reprogramming into iPSCs converge into an ESC-like topology. We find that reprogramming induces (1) large-scale switching of TADs between the A and B compartments, (2) the disassembly of inter-TAD contacts mediated by founder-specific transcription factors and the construction of new contacts mediated by pluripotency factors, and (3) the disruption of founder-specific chromatin loops and de novo establishment of pluripotent chromatin loops. Interestingly, despite these massive structural reorganizations that reproducibly induce nearly identical, ESC-like, 3D genomes across all different iPS cell lines, p3 passage iPSCs derived from different somatic cell types can still be distinguished based on specific genome topology features (Figure 7). The cells can also be distinguished based on their expression signatures (Figure 2F), as reported before (Polo et al., 2010). In addition to the cell-of-origin-specific topological features and expression patterns in iPSCs, we observe founder cell-associated CTCF-binding events. However, differing from previous studies, our systematic analyses suggest that in general the cell-of-origin-specific expression patterns in iPSC lines do not reflect residual expression patterns inherited from the respective founders. Similarly, the cell-of-origin-specific topological features that we observe in iPSCs are not architectural features of the founder genomes that survived topological reorganization during reprogramming. The same is true for the cell-of-origin-dependent CTCF binding events that we observe in iPSCs; we find no evidence that they were already occupied by CTCF in the somatic founder cells. Instead, in all instances, these patterns seem to be acquired during reprogramming in a reproducible and cell-of-origin-specific manner. The finding that expression of most cell-type-specific genes can no longer be detected in iPSCs may reflect the fact that efficient erasure of somatic-cell-specific transcription programs is a prerequisite for the establishment of a pluripotent cell population (Buganim et al., 2013). Similarly, our data suggest that iPSCs can only tolerate architectural fluctuations and changes in CTCF binding events that do not challenge, via their impact on gene expression, the establishment, and maintenance of the pluripotent state. As such, we propose they represent innocuous side effects of reprogramming.
Figure 7.

Graphical Summary of the Data
Somatic cell reprogramming is accompanied by massive changes in the somatic-cell-specific 3D genome and expression program, which, irrespective of the cell type of origin, induces convergence to an ESC-like 3D genome and expression program. Despite this, distinct topological features and differential gene expression separate p3 iPSCs according to their cell type of origin and those seem acquired during reprogramming in a cell type of origin dependent manner. These early iPSC distinct features are lost upon continued passaging.
The observation that iPSCs derived from different somatic cell types have distinct transcriptional and genome topology features seems best explained by assuming that different somatic cell types follow distinct reprogramming trajectories. Consistent with this idea, single-cell expression analyses during reprogramming of MEFs into iPSCs identified the transient expression of a unique set of surface markers absent in both fibroblasts and iPS cells, revealing transitions through distinct intermediate stages (Lujan et al., 2015, O’Malley et al., 2013). Furthermore, MEFs may follow different paths, depending on the reprogramming method used (Zunder et al., 2015). While little is known about the reprogramming paths in cell types other than fibroblasts, the reactivation sequence of pluripotency genes during reprogramming has been shown to differ between MEFs and pre-B cells (Buganim et al., 2012, Di Stefano et al., 2014, O’Malley et al., 2013), supporting the idea that different cell types may exhibit distinct reprogramming trajectories. Future research is necessary to uncover the molecular basis of the correlation between the distinct reprogramming trajectories, tissue-specific gene expression signatures, and genome topologies in the different cell-of-origin-derived iPSCs.
It has been reported that low passage iPSCs harbor residual DNA methylation signatures characteristic of their somatic tissue of origin, and these have been suggested to explain the cells’ biases in differentiation potential (Kim et al., 2010). Whether differential methylation is also linked to the distinct topological features that we have observed in p3 iPSCs remains to be investigated. However, given the effective replacement of a founder-specific 3D genome by a pluripotent 3D genome during reprogramming, plus the fact that the distinctive structural features are subtle and not reflective of architectural hallmarks of the founder genome, we consider it unlikely that the cell-of-origin-specific differentiation bias seen in early iPSCs is a consequence of specific topological features.
Experimental Procedures
Additional information and details regarding this work may be found in the Supplemental Experimental Procedures.
Reprogramming
Pre-B cells, MEFs, MΦ, and NSCs were isolated from a “reprogrammable mouse” line containing a doxycycline-inducible OSKM cassette, the reverse tetracycline transactivator (rtTA) (Carey et al., 2010), and an Oct4-GFP reporter transgene (Boiani et al., 2002), as described (Di Stefano et al., 2014). Reprogramming experiments with pre-B cells were performed as previously described (Di Stefano et al., 2014); with MEFs, macrophages and NSCs were conducted by plating 100,000 cells per well on gelatinized plates seeded with irradiated MEFs, using ESC medium supplemented with 2 μg/ml of doxycycline. For the isolation of iPSC lines, doxycycline was washed out after 15 days of reprogramming, and colonies with ESC-like morphology were picked at 20 days before further passaging. iPSC lines were expanded for an additional 9 days (three passages) to obtain P3 iPS cell lines or for 20 passages to obtain P20 iPS cell lines. Detailed information on cell culture and characterization of the iPSCs is provided in the Supplemental Experimental Procedures.
ChIP-Seq
ChIP experiments were performed as described previously (van Oevelen et al., 2008) using an antibody against H3K27ac (ab4729, Abcam) and CTCF (Millipore, 07-729). Detailed information is provided in the Supplemental Experimental Procedures.
Hi-C
Pre-B cells, MEFs, NSCs, iPSCs, and E14 ESCs were cross-linked and further processed as DpnII 3C template, as previously described (Splinter et al., 2012). Libraries for paired-end sequencing were generated from sonicated, ∼500- to 800-bp size-selected, 3C templates using the TruSeq DNA LT Sample Prep Kit (Illumina). Detailed information on Hi-C template generation and Hi-C data analysis is provided in the Supplemental Experimental Procedures. Hi-C eigenvalues, Domain segmentation in iPSC p3, and a list with genomic coordinates of all the called chromatin loops can be found in the Tables S2, S3, and S4, respectively.
Author Contributions
P.H.L.K., B.D.S., E.d.W., W.d.L., and T.G. conceived the study, participated in its design, and drafted the manuscript. P.H.L.K. performed the Hi-C experiments and analyzed the data. B.D.S. performed the cell culture and animal and molecular biology experiments and analyzed the data. E.d.W. computationally analyzed the data. F.L. performed cell culture experiments. C.v.O. performed the ChIP experiments.
Acknowledgments
This work was supported by an NWO/CW TOP grant (714.012.002), an NWO VICI grant 724.012.003, a NanoNextNL grant, and a European Research Council Starting Grant (209700, “4C”) to W.d.L.; a Ministerio de Educacion y Ciencia, SAF.2012-37167, Fundacio La Marató TV3 120410, AGAUR SGR 1136, and European Research Council Synergy Grant (“4D-Genome) to T.G.; and an ERC Stg (637587, “HAP-PHEN”) to E.d.W.
Published: March 10, 2016
Footnotes
This is an open access article under the CC BY-NC-ND license (http://creativecommons.org/licenses/by-nc-nd/4.0/).
Supplemental Information includes Supplemental Experimental Procedures, six figures, and five tables and can be found with this article online at http://dx.doi.org/10.1016/j.stem.2016.01.007.
Contributor Information
Wouter de Laat, Email: w.delaat@hubrecht.eu.
Thomas Graf, Email: thomas.graf@crg.eu.
Accession Numbers
The accession number for the expression and sequencing data reported in this paper is GEO: GSE76481.
Supplemental Information
References
- Apostolou E., Ferrari F., Walsh R.M., Bar-Nur O., Stadtfeld M., Cheloufi S., Stuart H.T., Polo J.M., Ohsumi T.K., Borowsky M.L. Genome-wide chromatin interactions of the Nanog locus in pluripotency, differentiation, and reprogramming. Cell Stem Cell. 2013;12:699–712. doi: 10.1016/j.stem.2013.04.013. [DOI] [PMC free article] [PubMed] [Google Scholar]
- Bar-Nur O., Russ H.A., Efrat S., Benvenisty N. Epigenetic memory and preferential lineage-specific differentiation in induced pluripotent stem cells derived from human pancreatic islet beta cells. Cell Stem Cell. 2011;9:17–23. doi: 10.1016/j.stem.2011.06.007. [DOI] [PubMed] [Google Scholar]
- Boiani M., Eckardt S., Schöler H.R., McLaughlin K.J. Oct4 distribution and level in mouse clones: consequences for pluripotency. Genes Dev. 2002;16:1209–1219. doi: 10.1101/gad.966002. [DOI] [PMC free article] [PubMed] [Google Scholar]
- Buganim Y., Faddah D.A., Cheng A.W., Itskovich E., Markoulaki S., Ganz K., Klemm S.L., van Oudenaarden A., Jaenisch R. Single-cell expression analyses during cellular reprogramming reveal an early stochastic and a late hierarchic phase. Cell. 2012;150:1209–1222. doi: 10.1016/j.cell.2012.08.023. [DOI] [PMC free article] [PubMed] [Google Scholar]
- Buganim Y., Faddah D.A., Jaenisch R. Mechanisms and models of somatic cell reprogramming. Nat. Rev. Genet. 2013;14:427–439. doi: 10.1038/nrg3473. [DOI] [PMC free article] [PubMed] [Google Scholar]
- Carey B.W., Markoulaki S., Beard C., Hanna J., Jaenisch R. Single-gene transgenic mouse strains for reprogramming adult somatic cells. Nat. Methods. 2010;7:56–59. doi: 10.1038/nmeth.1410. [DOI] [PMC free article] [PubMed] [Google Scholar]
- Chandra T., Ewels P.A., Schoenfelder S., Furlan-Magaril M., Wingett S.W., Kirschner K., Thuret J.Y., Andrews S., Fraser P., Reik W. Global reorganization of the nuclear landscape in senescent cells. Cell Rep. 2015;10:471–483. doi: 10.1016/j.celrep.2014.12.055. [DOI] [PMC free article] [PubMed] [Google Scholar]
- Creyghton M.P., Cheng A.W., Welstead G.G., Kooistra T., Carey B.W., Steine E.J., Hanna J., Lodato M.A., Frampton G.M., Sharp P.A. Histone H3K27ac separates active from poised enhancers and predicts developmental state. Proc. Natl. Acad. Sci. USA. 2010;107:21931–21936. doi: 10.1073/pnas.1016071107. [DOI] [PMC free article] [PubMed] [Google Scholar]
- de Laat W., Duboule D. Topology of mammalian developmental enhancers and their regulatory landscapes. Nature. 2013;502:499–506. doi: 10.1038/nature12753. [DOI] [PubMed] [Google Scholar]
- de Wit E., Bouwman B.A., Zhu Y., Klous P., Splinter E., Verstegen M.J., Krijger P.H., Festuccia N., Nora E.P., Welling M. The pluripotent genome in three dimensions is shaped around pluripotency factors. Nature. 2013;501:227–231. doi: 10.1038/nature12420. [DOI] [PubMed] [Google Scholar]
- Denholtz M., Bonora G., Chronis C., Splinter E., de Laat W., Ernst J., Pellegrini M., Plath K. Long-range chromatin contacts in embryonic stem cells reveal a role for pluripotency factors and polycomb proteins in genome organization. Cell Stem Cell. 2013;13:602–616. doi: 10.1016/j.stem.2013.08.013. [DOI] [PMC free article] [PubMed] [Google Scholar]
- Di Stefano B., Sardina J.L., van Oevelen C., Collombet S., Kallin E.M., Vicent G.P., Lu J., Thieffry D., Beato M., Graf T. C/EBPα poises B cells for rapid reprogramming into induced pluripotent stem cells. Nature. 2014;506:235–239. doi: 10.1038/nature12885. [DOI] [PubMed] [Google Scholar]
- Dixon J.R., Selvaraj S., Yue F., Kim A., Li Y., Shen Y., Hu M., Liu J.S., Ren B. Topological domains in mammalian genomes identified by analysis of chromatin interactions. Nature. 2012;485:376–380. doi: 10.1038/nature11082. [DOI] [PMC free article] [PubMed] [Google Scholar]
- Dixon J.R., Jung I., Selvaraj S., Shen Y., Antosiewicz-Bourget J.E., Lee A.Y., Ye Z., Kim A., Rajagopal N., Xie W. Chromatin architecture reorganization during stem cell differentiation. Nature. 2015;518:331–336. doi: 10.1038/nature14222. [DOI] [PMC free article] [PubMed] [Google Scholar]
- Kagey M.H., Newman J.J., Bilodeau S., Zhan Y., Orlando D.A., van Berkum N.L., Ebmeier C.C., Goossens J., Rahl P.B., Levine S.S. Mediator and cohesin connect gene expression and chromatin architecture. Nature. 2010;467:430–435. doi: 10.1038/nature09380. [DOI] [PMC free article] [PubMed] [Google Scholar]
- Kim K., Doi A., Wen B., Ng K., Zhao R., Cahan P., Kim J., Aryee M.J., Ji H., Ehrlich L.I. Epigenetic memory in induced pluripotent stem cells. Nature. 2010;467:285–290. doi: 10.1038/nature09342. [DOI] [PMC free article] [PubMed] [Google Scholar]
- Lane A.A., Chapuy B., Lin C.Y., Tivey T., Li H., Townsend E.C., van Bodegom D., Day T.A., Wu S.C., Liu H. Triplication of a 21q22 region contributes to B cell transformation through HMGN1 overexpression and loss of histone H3 Lys27 trimethylation. Nat. Genet. 2014;46:618–623. doi: 10.1038/ng.2949. [DOI] [PMC free article] [PubMed] [Google Scholar]
- Lieberman-Aiden E., van Berkum N.L., Williams L., Imakaev M., Ragoczy T., Telling A., Amit I., Lajoie B.R., Sabo P.J., Dorschner M.O. Comprehensive mapping of long-range interactions reveals folding principles of the human genome. Science. 2009;326:289–293. doi: 10.1126/science.1181369. [DOI] [PMC free article] [PubMed] [Google Scholar]
- Lodato M.A., Ng C.W., Wamstad J.A., Cheng A.W., Thai K.K., Fraenkel E., Jaenisch R., Boyer L.A. SOX2 co-occupies distal enhancer elements with distinct POU factors in ESCs and NPCs to specify cell state. PLoS Genet. 2013;9:e1003288. doi: 10.1371/journal.pgen.1003288. [DOI] [PMC free article] [PubMed] [Google Scholar]
- Lujan E., Zunder E.R., Ng Y.H., Goronzy I.N., Nolan G.P., Wernig M. Early reprogramming regulators identified by prospective isolation and mass cytometry. Nature. 2015;521:352–356. doi: 10.1038/nature14274. [DOI] [PMC free article] [PubMed] [Google Scholar]
- Nishino K., Toyoda M., Yamazaki-Inoue M., Fukawatase Y., Chikazawa E., Sakaguchi H., Akutsu H., Umezawa A. DNA methylation dynamics in human induced pluripotent stem cells over time. PLoS Genet. 2011;7:e1002085. doi: 10.1371/journal.pgen.1002085. [DOI] [PMC free article] [PubMed] [Google Scholar]
- Nora E.P., Lajoie B.R., Schulz E.G., Giorgetti L., Okamoto I., Servant N., Piolot T., van Berkum N.L., Meisig J., Sedat J. Spatial partitioning of the regulatory landscape of the X-inactivation centre. Nature. 2012;485:381–385. doi: 10.1038/nature11049. [DOI] [PMC free article] [PubMed] [Google Scholar]
- O’Malley J., Skylaki S., Iwabuchi K.A., Chantzoura E., Ruetz T., Johnsson A., Tomlinson S.R., Linnarsson S., Kaji K. High-resolution analysis with novel cell-surface markers identifies routes to iPS cells. Nature. 2013;499:88–91. doi: 10.1038/nature12243. [DOI] [PMC free article] [PubMed] [Google Scholar]
- Peric-Hupkes D., Meuleman W., Pagie L., Bruggeman S.W., Solovei I., Brugman W., Gräf S., Flicek P., Kerkhoven R.M., van Lohuizen M. Molecular maps of the reorganization of genome-nuclear lamina interactions during differentiation. Mol. Cell. 2010;38:603–613. doi: 10.1016/j.molcel.2010.03.016. [DOI] [PMC free article] [PubMed] [Google Scholar]
- Phillips-Cremins J.E., Sauria M.E., Sanyal A., Gerasimova T.I., Lajoie B.R., Bell J.S., Ong C.T., Hookway T.A., Guo C., Sun Y. Architectural protein subclasses shape 3D organization of genomes during lineage commitment. Cell. 2013;153:1281–1295. doi: 10.1016/j.cell.2013.04.053. [DOI] [PMC free article] [PubMed] [Google Scholar]
- Polo J.M., Liu S., Figueroa M.E., Kulalert W., Eminli S., Tan K.Y., Apostolou E., Stadtfeld M., Li Y., Shioda T. Cell type of origin influences the molecular and functional properties of mouse induced pluripotent stem cells. Nat. Biotechnol. 2010;28:848–855. doi: 10.1038/nbt.1667. [DOI] [PMC free article] [PubMed] [Google Scholar]
- Rao S.S., Huntley M.H., Durand N.C., Stamenova E.K., Bochkov I.D., Robinson J.T., Sanborn A.L., Machol I., Omer A.D., Lander E.S., Aiden E.L. A 3D map of the human genome at kilobase resolution reveals principles of chromatin looping. Cell. 2014;159:1665–1680. doi: 10.1016/j.cell.2014.11.021. [DOI] [PMC free article] [PubMed] [Google Scholar]
- Sexton T., Yaffe E., Kenigsberg E., Bantignies F., Leblanc B., Hoichman M., Parrinello H., Tanay A., Cavalli G. Three-dimensional folding and functional organization principles of the Drosophila genome. Cell. 2012;148:458–472. doi: 10.1016/j.cell.2012.01.010. [DOI] [PubMed] [Google Scholar]
- Splinter E., de Wit E., van de Werken H.J., Klous P., de Laat W. Determining long-range chromatin interactions for selected genomic sites using 4C-seq technology: from fixation to computation. Methods. 2012;58:221–230. doi: 10.1016/j.ymeth.2012.04.009. [DOI] [PubMed] [Google Scholar]
- Takahashi K., Yamanaka S. Induction of pluripotent stem cells from mouse embryonic and adult fibroblast cultures by defined factors. Cell. 2006;126:663–676. doi: 10.1016/j.cell.2006.07.024. [DOI] [PubMed] [Google Scholar]
- van Oevelen C., Wang J., Asp P., Yan Q., Kaelin W.G., Jr., Kluger Y., Dynlacht B.D. A role for mammalian Sin3 in permanent gene silencing. Mol. Cell. 2008;32:359–370. doi: 10.1016/j.molcel.2008.10.015. [DOI] [PMC free article] [PubMed] [Google Scholar]
- Wei Z., Gao F., Kim S., Yang H., Lyu J., An W., Wang K., Lu W. Klf4 organizes long-range chromosomal interactions with the oct4 locus in reprogramming and pluripotency. Cell Stem Cell. 2013;13:36–47. doi: 10.1016/j.stem.2013.05.010. [DOI] [PubMed] [Google Scholar]
- Weissbein U., Benvenisty N., Ben-David U. Quality control: Genome maintenance in pluripotent stem cells. J. Cell Biol. 2014;204:153–163. doi: 10.1083/jcb.201310135. [DOI] [PMC free article] [PubMed] [Google Scholar]
- Whyte W.A., Orlando D.A., Hnisz D., Abraham B.J., Lin C.Y., Kagey M.H., Rahl P.B., Lee T.I., Young R.A. Master transcription factors and mediator establish super-enhancers at key cell identity genes. Cell. 2013;153:307–319. doi: 10.1016/j.cell.2013.03.035. [DOI] [PMC free article] [PubMed] [Google Scholar]
- Yue F., Cheng Y., Breschi A., Vierstra J., Wu W., Ryba T., Sandstrom R., Ma Z., Davis C., Pope B.D., Mouse ENCODE Consortium A comparative encyclopedia of DNA elements in the mouse genome. Nature. 2014;515:355–364. doi: 10.1038/nature13992. [DOI] [PMC free article] [PubMed] [Google Scholar]
- Zhang B., Kirov S., Snoddy J. WebGestalt: an integrated system for exploring gene sets in various biological contexts. Nucleic Acids Res. 2005;33:W741–W748. doi: 10.1093/nar/gki475. [DOI] [PMC free article] [PubMed] [Google Scholar]
- Zhao X.Y., Li W., Lv Z., Liu L., Tong M., Hai T., Hao J., Guo C.L., Ma Q.W., Wang L. iPS cells produce viable mice through tetraploid complementation. Nature. 2009;461:86–90. doi: 10.1038/nature08267. [DOI] [PubMed] [Google Scholar]
- Zunder E.R., Lujan E., Goltsev Y., Wernig M., Nolan G.P. A continuous molecular roadmap to iPSC reprogramming through progression analysis of single-cell mass cytometry. Cell Stem Cell. 2015;16:323–337. doi: 10.1016/j.stem.2015.01.015. [DOI] [PMC free article] [PubMed] [Google Scholar]
Associated Data
This section collects any data citations, data availability statements, or supplementary materials included in this article.