

Abstract
Telomere length (TL) is a potential biomarker of aging and age-related disease risk. We recently published a novel Luminex-based method for high-throughput, low-cost TL measurement. Here we describe a blinded comparison of the Luminex method to Southern blot, the most precise TL measurement method. Luminex and Southern blot measurements for the same 50 DNA samples were taken in two independent laboratories; each sample was measured twice, several months apart. The inter-assay CV for Luminex ranged from 5.5 to 9.1 (depending on CV estimation method), and Southern blot CV from 1.0 to 1.7. Both measures were inversely associated with age. The correlation between the repeated measurements was 0.66 for Luminex and 0.97 for Southern blot. The correlation between Southern blot and Luminex was 0.65 in round 1 and 0.75 in round 2, and the relationship showed no evidence of non-linearity. Our results demonstrate that the Luminex assay is a valid and reproducible method for high-throughput TL measurement. The Luminex assay involves no DNA amplification, which may make Luminex an attractive alternative to PCR-based TL measurement.
Keywords: Telomere length, aging, validation, Luminex, Southern blot, qPCR
Introduction
Telomeres play a critical role in both carcinogenesis and human aging, and many investigators have hypothesized that telomere length (TL) in peripheral blood cells is a risk factor for cancer [1] and other age-related diseases [2]. In most epidemiological studies, TL is measured as the average telomere length/content in a DNA sample.
There are several methods for measuring TL [3]. Southern blot analysis of terminal restriction fragments is viewed as the gold standard method for average TL. It is highly reproducible and can be interpreted in base pair units [4], but it requires ~3 µg of DNA, is somewhat labor-intensive, and is not a high-throughput method. Quantitative PCR (qPCR) is commonly used to assess telomere content in large studies. It is inexpensive, high throughput, and requires ~50 ng of DNA [5]; although it is less precise than the Southern blot [6]. There are several additional methods available, but none feasible for high-throughput analyses of DNA samples, including flow cytometry plus fluorescence in situ hybridization (FISH) [7] which requires viable cells and is labor intensive, and single TL analysis [STELA]) [8] which is not feasible for all chromosomes and not yet scalable to large studies.
We recently published a novel method for TL measurement: a probe-based non-PCR assay using QuantiGene chemistry on a Luminex platform [9]. For this method, a small amount of DNA (~50 ng) is hybridized to probes specific to the telomere repeat sequence and probes specific to a reference gene in a single well. Then telomere and reference gene signals are amplified using branched DNA technology and detected using Luminex technology. In order to assess the validity and the reliability of this assay, we have conducted a blinded comparison of the Luminex and Southern blot methods for TL measurement.
Materials and methods
The Luminex and Southern blot assays were performed in two different laboratories using aliquots from the same set of 50 DNA samples. The Luminex assay was performed in the Ahsan Lab, and Southern blot was performed in the Aviv Lab. Leukocyte samples were collected between 2004-2008 from white donors (ages 41-70, 50% female). DNA extraction was conducted in the Hunt lab.
As described previously [6], 50 DNA samples with randomly-assigned identifiers were sent to the Aviv Lab for Southern blot analysis in 2009, and the resulting TL measures were sent to Hunt in 2010. Upon receiving these results, a second aliquot of the same 50 samples with new identifiers was sent to the Aviv Lab for a second measurement. In 2013, these same 50 samples were sent to the Ahsan Lab in an identical fashion: Luminex-based TL measures were obtained and reported to Hunt, followed by a second round Luminex measurement on the same 50 samples. In this way, both labs performed the measurements in a blinded fashion. The Southern blot analyses for these 50 samples were described previously by Aviv et al. [6].
The protocol for the Luminex assay has recently been described in detail [9], so here we only provide an overview. The abundance of both the telomere sequence and a reference gene (ALK) are measured for a DNA sample in a single well on a Luminex platform using Affymetric-Panomics QuantiGene Plex chemistry. Control DNA is included as a standard (400, 200, 100, 50, 25, 12.5, and 6.25 ng per well) in triplicate. The standard curves using the mean fluorescent intensity consistently show a linear range for both the reference gene and the telomere sequence [9]. For each sample, relative TL is expressed as Telomere Intensity Index (TII), which is calculated as follows. First, we make the telomere probe intensity correction for quantity of input DNA (measured using the probe intensity for the reference gene and the standard curve). Then, the mathematically corrected intensity of the sample is divided by that of a reference DNA sample that is run in each plate and is multiplied by 100. This normalization accounts for plate-to-plate variation. The TII of a sample represents the telomere probe intensity of that sample relative to the intensity from the same amount of the reference DNA sample. We have previously described an alternative approach for expressing TL, the “telomere quantity index” (TQI), and the TQI produces very similar results to those reported here [9].
The primary statistical analyses were conducted by Hunt, not the two data-generating groups. Several types of CVs were calculated for both Luminex and Southern blot using the duplicate measurements. First, a CV for each pair of measures was calculated as the standard deviation divided by the mean and expressed as a percentage. We report the geometric and arithmetic means of these 50 pair-wise CVs, as well as the median. Second, we also calculated an overall CV as the pooled standard deviation of the duplicate measures (x1 and x2) divided by the overall mean of all the measurements.
cv = 100 × √(∑(x1 - x2)2⁄2n)/(∑(x1 - x2)⁄2n)
Linear regression was used to estimate the pairwise correlation/association between TL measures and to estimate the association with age. A quadratic term was included in the linear models to determine if the relationship between the two assays showed evidence of nonlinearity.
Results
In the first round of samples sent to the Ahsan Lab, all 50 were successfully assayed. In the second shipment, three samples failed due to technical reasons resulting in low intensity (e.g., sub-optimal concentration and/or DNA fragmentation), so only 47 measurements were sent to Dr. Hunt for statistical analyses.
The CVs for Southern blot were 1.0 (geometric mean), 1.4 (arithmetic mean), 1.3 (median), and 1.7 (overall/pooled CV). The CVs for the Luminex assay were 5.4 (geometric mean), 7.6 (arithmetic mean), 7.1 (median), and 9.1 (overall/pooled CV), similar to those we reported previously [9] (Supplementary Table 1). Figure 1 shows the duplicate measures for both Luminex and Southern blot, with the Southern blot showing a stronger inter-assay correlation (r=0.965) than Luminex (r=0.657). These results demonstrate the higher precision of Southern blot compared to Luminex.
Figure 1.
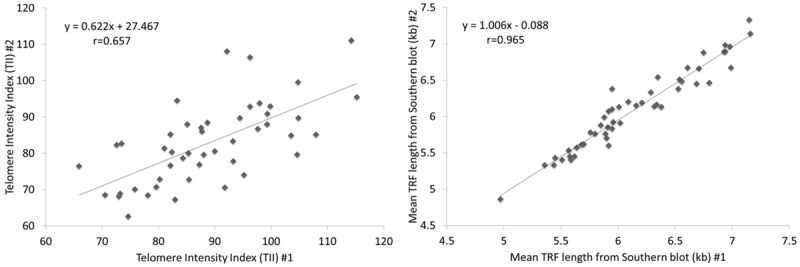
Scatterplot and linear regression results for replicate samples run for the Luminex assay (left) and Southern blot (right).
To assess the relationship between the Southern blot and Luminex assays, we conducted all four pairwise comparisons based on the duplicate measurements (Figure 2). The correlation (r) between the two measures ranged from 0.645 (P=4×10⁻⁷) to 0.752 (P=10-9). The correlation (r) between the means of the duplicate measures was 0.784 (P=7×10-11). Introducing a quadratic term into the regression did not improve the fit (P>0.05).
Figure 2.
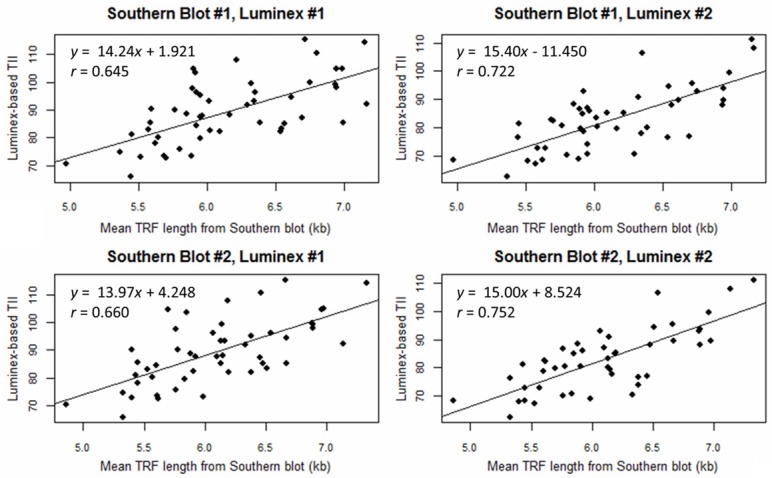
Scatterplots and linear regression results for the association between the telomere measures generated using the Luminex assay and Southern blot.
TL was inversely associated with age for both measures (Figure 3), using the mean of the duplicate measures. Age accounted for 14% and 29% of the variation in TL for Luminex and Southern blot, respectively.
Figure 3.
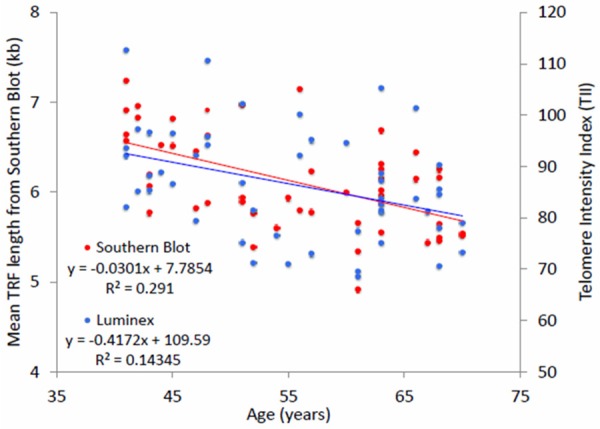
Scatterplot and linear regression results for the association between age and telomere length measures using the Luminex assay and Southern blot.
Discussion
We have described the first blinded, impartial comparison of a new Luminex method and the “gold standard” Southern blot method for TL measurement. We observe a linear relationship between these two measures, indicating that Luminex is a valid and reproducible method for TL measurement.
We observed stronger correlations between repeated measurements, smaller inter-assay CVs, and a stronger association with age for Southern blot compared to Luminex, indicating that Southern blot has superior precision and less measurement error. Thus, the Luminex method would generate attenuated association estimates for TL as compared to Southern blot [10] (Supplementary Material). However, Southern blot is not error-free; it measures both the telomeric and subtelomeric regions (which can inflate the measured values [11]) and may be affected by genetic variation that alters restriction enzyme binding sites [5]. Furthermore, a recent study across two laboratories reported per-sample intra-batch CVs ranging from 0.2% to 4.6% and inter-batch CVs ranging from 1.7% to 15.3% [11]. Thus, we cannot assess the true accuracies and biases of the Luminex method as we do not have a perfect gold standard measure as a comparator.
There are several advantages of the Luminex method compared to Southern blot. The Luminex method is a low-cost, low-input, high-throughput approach, and thus more amenable to studies with large sample sizes. It requires only ~50 ng of DNA (compared to ~3 ug for Southern blot), and 64 samples can be run on a 96 well plate. In addition, the Luminex assay does not measure sub-telomeric regions, only the telomere repeat sequence.
Real-time qPCR is the conventional TL assay for large studies. The repeatability of qPCR varies substantially among prior studies, with CVs of <7% [6,12], 7%-11% [13], ~15% [14] and even >25% being reported [15]. A recent study across six labs reported substantial heterogeneity in per-sample intra-batch CVs (0%-31%) and inter-batch CVs (0.2%-28%) [11]. A prior study of the 50 samples used in this work reported an inter-assay CV of 6.5% for qPCR and a correlation (r) with Southern blot of 0.85 [6]; however, these qPCR experiments involved more control and reference samples than are typically used in epidemiological studies, TL was measured twice for each sample (both based on triplicate measures), and samples were re-run when pairwise CV >7%. These quality controls steps are not typically feasible in large studies, and thus, the quality of these previously reported qPCR measures [6] are not likely to be representative of TL measures used in epidemiology. However, as reported in our previous paper, the Luminex assay correlated well with the qPCR method when both assays were run in the Ahsan lab (r of 0.7-0.8) [9].
A critical advantage of the Luminex assay is that it involves no DNA amplification. Thus, the assay is not subject to “amplification bias”, in which amplification efficiencies can vary by plate, position [16], or characteristics of the sample (e.g., purity, integrity), introducing measurement error. In addition, the Luminex CVs suggest that triplicates or quadruplicate measures are not required, as is often done for qPCR for both the reference gene and the telomere sequence (although this issue should be investigated by independent laboratories). Furthermore, we find no evidence of a non-linear relationship between the Luminex and Southern blot assays, as was recently reported for qPCR [6].
There are several considerations to keep in mind when interpreting our results. First, the Luminex assay was run in a fashion identical to how the assay would be run in a large-scale study. In other words, each sample was run in a single well, and each plate included the same number of control and reference samples that would be included in any high-throughput Luminex experiment. Second, our first and second round of Luminex assays were run several months apart on different plates, and thus our reported CVs are truly inter-assay/inter-batch CVs. Third, the Southern blot measures reported here (described previously [6]) were taken several years prior to the Luminex measurement. While DNA is stable when stored appropriately, any changes in the characteristics of the DNA that occurred over time could contribute to differences observed between the Luminex and Southern blot measures.
Additional research is needed to characterize the reproducibility of the Luminex assay across laboratories, as we are the only lab using the Luminex assay at this time. Larger studies are needed to assess potential effects of plate position and batch-to-batch variation. Additional research is needed to assess the effects of pre-analytic factors and conditions on TL measurement including blood collection, storage factors, and DNA extraction methods.
In summary, we have reported a blinded, impartial comparison between a Luminex assay for telomere content and the Southern blot method for average TL. Our results indicate that the Luminex assay is a valid and reproducible me-thod for measuring telomere content for DNA samples and represents a low-cost, low-input, and high-throughput method for TL measurement that can be implemented in epidemiological studies of cancer and other age-related diseases.
Acknowledgements
This work was supported by the National Institutes of Health [R01 ES020506 and U01 HG007601 to B.L.P.].
Disclosure of conflict of interest
None.
Supporting Information
References
- 1.Wentzensen IM, Mirabello L, Pfeiffer RM, Savage SA. The association of telomere length and cancer: a meta-analysis. Cancer Epidemiol Biomarkers Prev. 2011;20:1238–1250. doi: 10.1158/1055-9965.EPI-11-0005. [DOI] [PMC free article] [PubMed] [Google Scholar]
- 2.Sanders JL, Newman AB. Telomere Length in Epidemiology: A Biomarker of Aging, Age-Related Disease, Both, or Neither? Epidemiol Rev. 2013;35:112–31. doi: 10.1093/epirev/mxs008. [DOI] [PMC free article] [PubMed] [Google Scholar]
- 3.Aubert G, Hills M, Lansdorp PM. Telomere length measurement-caveats and a critical assessment of the available technologies and tools. Mutat Res. 2012;730:59–67. doi: 10.1016/j.mrfmmm.2011.04.003. [DOI] [PMC free article] [PubMed] [Google Scholar]
- 4.Kimura M, Stone RC, Hunt SC, Skurnick J, Lu X, Cao X, Harley CB, Aviv A. Measurement of telomere length by the Southern blot analysis of terminal restriction fragment lengths. Nat Protoc. 2010;5:1596–1607. doi: 10.1038/nprot.2010.124. [DOI] [PubMed] [Google Scholar]
- 5.Cawthon RM. Telomere measurement by quantitative PCR. Nucleic Acids Res. 2002;30:e47. doi: 10.1093/nar/30.10.e47. [DOI] [PMC free article] [PubMed] [Google Scholar]
- 6.Aviv A, Hunt SC, Lin J, Cao X, Kimura M, Blackburn E. Impartial comparative analysis of measurement of leukocyte telomere length/DNA content by Southern blots and qPCR. Nucleic Acids Res. 2011;39:e134. doi: 10.1093/nar/gkr634. [DOI] [PMC free article] [PubMed] [Google Scholar]
- 7.Vera E, Blasco MA. Beyond average: potential for measurement of short telomeres. Aging (Albany NY) 2012;4:379–392. doi: 10.18632/aging.100462. [DOI] [PMC free article] [PubMed] [Google Scholar]
- 8.Baird DM, Rowson J, Wynford-Thomas D, Kipling D. Extensive allelic variation and ultrashort telomeres in senescent human cells. Nat Genet. 2003;33:203–207. doi: 10.1038/ng1084. [DOI] [PubMed] [Google Scholar]
- 9.Kibriya MG, Jasmine F, Roy S, Ahsan H, Pierce B. Measurement of telomere length: a new assay using QuantiGene chemistry on a Luminex platform. Cancer Epidemiol Biomarkers Prev. 2014;23:2667–2672. doi: 10.1158/1055-9965.EPI-14-0610. [DOI] [PMC free article] [PubMed] [Google Scholar]
- 10.Hutcheon JA, Chiolero A, Hanley JA. Random measurement error and regression dilution bias. BMJ. 2010;340:c2289. doi: 10.1136/bmj.c2289. [DOI] [PubMed] [Google Scholar]
- 11.Martin-Ruiz CM, Baird D, Roger L, Boukamp P, Krunic D, Cawthon R, Dokter MM, van der Harst P, Bekaert S, de Meyer T, Roos G, Svenson U, Codd V, Samani NJ, McGlynn L, Shiels PG, Pooley KA, Dunning AM, Cooper R, Wong A, Kingston A, von Zglinicki T. Reproducibility of telomere length assessment: an international collaborative study. Int J Epidemiol. 2015;44:1673–83. doi: 10.1093/ije/dyu191. [DOI] [PMC free article] [PubMed] [Google Scholar]
- 12.Ehrlenbach S, Willeit P, Kiechl S, Willeit J, Reindl M, Schanda K, Kronenberg F, Brandstatter A. Influences on the reduction of relative telomere length over 10 years in the population-based Bruneck Study: introduction of a well-controlled high-throughput assay. Int J Epidemiol. 2009;38:1725–1734. doi: 10.1093/ije/dyp273. [DOI] [PubMed] [Google Scholar]
- 13.Seow WJ, Cawthon RM, Purdue MP, Hu W, Gao YT, Huang WY, Weinstein SJ, Ji BT, Virtamo J, Hosgood HD 3rd, Bassig BA, Shu XO, Cai Q, Xiang YB, Min S, Chow WH, Berndt SI, Kim C, Lim U, Albanes D, Caporaso NE, Chanock S, Zheng W, Rothman N, Lan Q. Telomere length in white blood cell DNA and lung cancer: a pooled analysis of three prospective cohorts. Cancer Res. 2014;74:4090–4098. doi: 10.1158/0008-5472.CAN-14-0459. [DOI] [PMC free article] [PubMed] [Google Scholar]
- 14.De Vivo I, Prescott J, Wong JY, Kraft P, Hankinson SE, Hunter DJ. A prospective study of relative telomere length and postmenopausal breast cancer risk. Cancer Epidemiol Biomarkers Prev. 2009;18:1152–1156. doi: 10.1158/1055-9965.EPI-08-0998. [DOI] [PMC free article] [PubMed] [Google Scholar]
- 15.Shen J, Terry MB, Gurvich I, Liao Y, Senie RT, Santella RM. Short telomere length and breast cancer risk: a study in sister sets. Cancer Res. 2007;67:5538–5544. doi: 10.1158/0008-5472.CAN-06-3490. [DOI] [PubMed] [Google Scholar]
- 16.Eisenberg DT, Kuzawa CW, Hayes MG. Improving qPCR telomere length assays: Controlling for well position effects increases statistical power. Am J Hum Biol. 2015;27:570–5. doi: 10.1002/ajhb.22690. [DOI] [PMC free article] [PubMed] [Google Scholar]
Associated Data
This section collects any data citations, data availability statements, or supplementary materials included in this article.