

Abstract
Alterations in mitochondrial function, as observed in neurodegenerative diseases, lead to disrupted energy metabolism and production of damaging reactive oxygen species. Here, we demonstrate that mitochondrial dysfunction also disrupts the structure and function of lysosomes, the main degradation and recycling organelle. Specifically, inhibition of mitochondrial function, following deletion of the mitochondrial protein AIF, OPA1, or PINK1, as well as chemical inhibition of the electron transport chain, impaired lysosomal activity and caused the appearance of large lysosomal vacuoles. Importantly, our results show that lysosomal impairment is dependent on reactive oxygen species. Given that alterations in both mitochondrial function and lysosomal activity are key features of neurodegenerative diseases, this work provides important insights into the etiology of neurodegenerative diseases.
Keywords: lysosome, mitochondria, neurodegenerative disease, Parkin, reactive oxygen species (ROS)
Introduction
A prominent feature of neurodegenerative diseases, including Parkinson disease (PD)3 and Alzheimer disease, is the accumulation of undigested protein aggregates (1, 2). Although the underlying mechanisms are complex, several cellular alterations can cause aggregate accumulation, including impaired quality control pathways and the generation of reactive oxygen species (ROS) as a consequence of mitochondrial damage (1, 3).
In healthy cells, protein aggregates and damaged cellular components are delivered to lysosomes to be degraded through a process termed autophagy (1, 2, 4, 5). As such, autophagy plays an important neuroprotective role. Nevertheless, the defects in degradation pathways observed in neurodegenerative diseases extend well beyond alterations in autophagy. Specifically, disruption of lysosomal function has been linked to neuronal loss in several neurodegenerative diseases. For example, mutations in the lysosomal ATPase ATP13A2 cause PD, whereas lysosomal dysfunction in Gaucher disease leads to Parkinsonism and the appearance of Lewy bodies (6, 7). In addition, the α-synuclein-containing Lewy bodies found in PD are positive for lysosomal markers, suggesting that they represent lysosomes that failed to degrade their content (8). In fact, lysosomal alterations are a common feature of PD (8–11). Nevertheless, the pathological consequences of a loss of lysosomal function extend well beyond PD, because a wide variety of mutations that impair lysosomes and cause the accumulation of intracellular material (lysosomal storage diseases) show features of neurodegeneration (12).
A second key metabolic pathway required for neuronal survival is mitochondrial activity. In fact, mitochondrial dysfunction is a common feature of neurodegenerative diseases. For example, decreased activity of complex I of the electron transport chain (ETC) is present in a number of PD cases (13, 14), whereas amyloid β, Tau tangles, and Htt aggregates all cause mitochondrial dysfunction (15–17). In addition, several genes mutated in PD (including PINK1, Parkin, and DJ-1) affect mitochondrial function and turnover (18–21), whereas deregulation of mitochondrial dynamics causes progressive neuronal loss in humans (22–24). At the cellular level, these alterations in mitochondrial structure and function lead to ROS-dependent cellular damage and decreased ATP production, all of which contribute to neuronal loss (3, 25, 26). Importantly, mitochondrial dysfunction is often observed concomitantly with alterations in autophagic/lysosomal function in neurodegenerative diseases (reviewed in Ref. 3), suggesting a link between the two. Although this is supported by the observation that loss of mitochondrial function in yeast impairs starvation-induced autophagy (27), the extent and physiological importance of this interaction remain unclear.
Here, we demonstrate that loss of mitochondrial function impairs lysosomes both in cells in culture and within the brain. Mitochondrial dysfunction induced by genetic ablation of mitochondrial proteins or chemical inhibition of the electron transport chain impaired lysosomal activity and caused the appearance of large lysosomal vacuoles. These were not the consequence of changes in mitochondrial dynamics but were mediated by a ROS-dependent mechanism. Altogether, these results indicate that mitochondria are required to maintain lysosomal function, providing a direct link between these two important aspects of neurodegenerative diseases.
Experimental Procedures
Cell culture reagents were obtained from Wisent. Other chemicals were purchased from Sigma-Aldrich, except where indicated.
Animals
All experiments were approved by the Université du Québec à Trois-Rivières Animal Care Ethics Committee, adhering to the Guidelines of the Canadian Council on Animal Care. As described previously (28), the forebrain-specific AIF KO mice was generated by crossing floxed AIF mice (29) with CamKIIα-Cre mice (30). To minimize phenotypic variations due to the mixed background, the mice were kept on this FVBN/C57Bl/6 background for at least 6 generations before generating the experimental animals. In addition, littermates were used as controls for all experiments. Animals were genotyped according to standard protocols with previously published primers for AIF and Cre (28).
Tissue Processing and Immunohistochemistry
Mice were euthanized with a lethal injection of sodium pentobarbital. For immunohistochemistry, mice were perfused with 1× PBS followed by fresh cold 4% paraformaldehyde. Brains were then removed, post-fixed overnight in 4% paraformaldehyde, cryoprotected in 20% sucrose in 1× PBS, and frozen. Sections were collected as 14-μm coronal cryosections on Superfrost Plus® slides (Fisher). For Western blot analysis, brains were removed, and cortices dissected and flash-frozen in liquid nitrogen.
Brain sections were analyzed by immunohistochemistry using AlexaFluor and Cy3 secondary antibodies (Jackson ImmunoResearch Laboratories, Inc.). Images were taken using Zeiss 510 meta and Leica confocal microscopes. Aggregates were autofluorescent when imaged using the 543-nm laser line and where imaged as such. All quantification was done blind on at least 4 sections/brain. Diameter measurements and colocalization studies were quantified using ImageJ.
Cell Culture
WT, PINK1 KO (gift from Dr. David Park, University of Ottawa), and OPA1 KO MEFs (gift from Dr. Luca Scorrano, University of Padua) were cultured in Dulbecco's modified Eagle's medium (DMEM) supplemented with 10% fetal bovine serum. OPA1 KO MEFs reconstituted with GFP, WT OPA1, or OPA1(Q297V) were generated as described (31). Primary cortical neuron cultures were done as described (32). Neurons were treated at day 4. Where indicated, cells were treated for 4 h with oligomycin (10 μm), antimycin A (50 μm), rotenone (5 μm), sodium azide (150 μm), DDC (50 μm) in the absence or the presence of the antioxidant N-acetylcysteine (NAC) (10 mm), ubiquinone (Q10) (Cayman; 25 μg/ml), or MitoQ (Focus Biomolecules; 100 μm). Nicotinamide (NAM) treatments (10 mm) were for 2 days. For H2O2 production, cells were incubated with 50 milliunits/ml glucose oxidase for 1 h. Lysosomal activity was inhibited by incubating cells in the presence of 200 nm bafilomycin for 1 h. Where indicated, cells were incubated for 1 h with Magic Red-RR (Immunochemistry Technologies), according to the manufacturer's instructions. For the dextran experiments, MEFs were incubated 2 h in the presence of 500 μg/ml Mr 10,000 Texas Red-conjugated dextran (Life Technologies, Inc.). Cells were then washed and chased for 30 min or 4 h with normal medium before fixing. In neurons, dextran was added at the time of treatment and cells were fixed immediately after treatment. For immunofluorescence, cells were grown directly on glass coverslips, treated as indicated, washed in PBS, and fixed for 10 min with 4% paraformaldehyde. NAD/NADH ratios were measured using a fluorescent NAD detection kit (Abcam).
Live Cell Confocal Imaging
MEF cells were first transfected with RFP-LAMP1 construction from Addgene (plasmid 1817) and then incubated with 1 μm Lysosensor Green DND-189 (Life Technologies) for 15 min at 37 °C. The cells were then washed three times in PBS and maintained in DMEM without phenol before imaging.
Flow Cytometry
To measure ROS, MEFs were incubated with 5 μm MitoSOXTM Red mitochondrial superoxide indicator (Life Technologies) for 20 min at 37 °C, after which fluorescence was measured at a wavelength of 610 nm using a Cytomics FC 500 system (Beckman Coulter). Lysosomal acidity was measured using Lysosensor Green DND-189. Cells were incubated with 1 μm Lysosensor for 30 min at 37 °C, and the fluorescence was measured at 525 nm. To measure the mitochondrial membrane potential, MEFs were incubated with 50 nm tetramethylrhodamine (Life Technologies) for 30 min at 37 °C, and fluorescence was measured at 610 nm. For each experiment, a total of 10,000 events were counted.
Electron Microscopy
Cell pellets were fixed in 0.4 m sodium cacodylate buffer and 8% glutaraldehyde (10 ml of buffer, 10 ml of glutaraldehyde, and 20 ml of H2O) at room temperature for 1 h. The pellets were then shipped to Mount Sinai Hospital for processing. Images were acquired using an EMS 208S electron microscope (Philips).
Antibodies and Immunoblots
The following antibodies were used: mouse anti-actin (Sigma-Aldrich); goat anti-Oct6, rabbit anti-SOD1, rat anti-LAMP1, goat anti-AIF, rabbit anti-TOM20, and rabbit anti-cathepsin B (Santa Cruz Biotechnology, Inc.); mouse anti-NDUFA9, mouse anti-Core2, and rabbit anti LAMP2, (Invitrogen); rabbit anti-Rab5, rabbit anti-Rab7, and rabbit anti-Rab11 (Cell Signaling Technologies); mouse anti-NeuN (Chemicon); mouse anti-mtHSP70 (ABR Bioreagents); and mouse anti-OPA1 (BD Biosciences).
Tissue was lysed in 10 mm Tris-HCl, pH 7.9, 150 mm NaCl, 1 mm EDTA, 1% Triton X-100 supplemented with protease inhibitor mixture (Sigma-Aldrich) and phosphatase inhibitors and Triton-insoluble material pelleted at 15,000 × g for 5 min. For immunoblot analysis, proteins were subjected to SDS-PAGE, transferred to nitrocellulose membranes, and blotted with the specified antibodies. Blots were incubated with horseradish peroxidase-conjugated secondary antibodies and visualized by enhanced chemiluminescence (Bio-Rad). Samples were quantified using ImageJ.
In Vitro Lysosomal Assays and ATP Measurements
To measure cathepsin B activity, 5-μg proteins were diluted in 100 μl of 100 mm HEPES, pH 6.0, 150 mm NaCl, 2 mm DTT, and 5 mm EDTA in the presence of a 5 μm concentration of the cathepsin B substrate zRR-AMC (Sigma-Aldrich). Samples were incubated for 30 min at 37 °C, after which fluorescence was measured (excitation/emission = 360/440 nm) using a Fluostar Optima (BMG Labtech). Acid phosphatase was measured using a fluorometric acid phosphatase assay kit (Abcam). 10 μg of proteins were diluted in the provided buffer in the presence of 0.5 mm substrate (4-methylumbelliferyl phosphate disodium salt) and incubated for 30 min at 25 °C. The reaction was then stopped with 20 μl of Stop solution, and fluorescence was measured (excitation/emission = 360/440 nm). Lysosomal acid lipase activity was measured as described (33) by diluting 10 μg of proteins in 100 μl of reaction buffer (100 mm sodium acetate, pH 4.0, 1% (v/v) Triton, and 0.5% (w/v) cardiolipin) in the presence of 0.345 mm 4-methylumbelliferone (Sigma-Aldrich). Samples were incubated for 1 h at 37 °C. The reaction was then stopped with 150 mm EDTA, pH 11.5, and fluorescence was measured (excitation/emission = 360/440 nm). ATP was measured in whole cells using the Cell Titer Glow kit (Promega). Cells were grown in 96-well plates, and ATP was measured in triplicate following the protocol provided. ATP levels were normalized to the total amount of proteins in replicate wells using the DC protein assay (Bio-Rad).
Statistical Analysis
Statistical differences were determined using Student's t test or one-way analysis of variance. p < 0.05 was considered statistically significant.
Results
Mitochondrial Dysfunction Causes the Appearance of Large Lysosomal Vacuoles
Deletion of the essential mitochondrial protein AIF causes mitochondrial fragmentation and loss of ETC components, resulting in impaired mitochondrial function (29, 34–36). We recently described a neuron-specific AIF knock-out mouse (AKO mouse), which shows similar mitochondrial fragmentation and loss of complex I expression (NDUFA9 subunit), providing a new model of mitochondria-dependent neurodegeneration (Fig. 1, A and B) (28). In these AKO animals, but not WT animals, large cytoplasmic vacuoles were observed in a subset of cortical neurons (Fig. 1, C and D, asterisk). Vacuoles were identified as a region within an affected neuron that excluded cytoplasmic markers, such as NeuN (Fig. 1C, asterisk) and SOD1 (Fig. 1D, asterisk). These vacuoles were present mostly in layer V cortical neurons (Oct6-positive neurons; Fig. 1, E and F), the most affected neuronal population in the AKO cortex (28). However, the vacuoles were unlikely to be due to loss of neuronal viability because affected neurons were otherwise morphologically normal (Fig. 1C, NeuN)(28) and showed no sign of nuclear condensation or fragmentation (Fig. 1G, Hoechst), and AKO animals had normal numbers of neurons in layer V (28). Similar SOD1-negative vacuoles were observed in MEFs lacking the mitochondrial inner membrane GTPase OPA1,4 a protein required for mitochondrial fusion, and to maintain cristae structure (31, 37, 38). Together, these results indicate that inhibition of mitochondrial function causes the occurrence of large intracytoplasmic vacuoles.
FIGURE 1.

Deletion of the mitochondrial protein AIF disrupts lysosomal morphology in cortical neurons. A, cortical sections of 90-day-old WT and AKO animals were stained for mitochondria (TOM20; green) and lysosomes (LAMP1; red). B, alternatively, complex I (NDUFA9) and the mitochondrial chaperone mtHSP70 were analyzed by Western blot (B). C and D, large LAMP1-positive vacuoles (red), excluding the cytosolic markers NeuN (C, green) and SOD1 (D, green) are present in the cortex of 90-day-old AKO mice. E and F, LAMP1 vacuoles are present in layer V neurons. Vacuoles were observed as a region within a neuron excluding NeuN (E, green). Laver V neurons were identified as Oct6-positive neurons (E, red). Large LAMP1-positive structures (red) can also be observed in layer V in composite images of the complete cortex reconstituted from several images taken using a ×40 objective (F; neuronal marker NeuN in green). G, the presence of LAMP1 vacuoles (LAMP1; red) does not affect nuclear morphology (Hoechst; green). The image was generated in ImageJ from a z-stack acquired using a ×63 objective. H, LAMP1 expression is not affected in the cortex of 90-day-old AKO mice. Representative images are shown for all panels, with an asterisk denoting vacuoles; scale bar, 10 μm.
To determine the nature of the membrane delimiting these vacuoles, we first co-stained them with markers of endosomes and lysosomes, the main cellular vesicular system (39). The vacuoles were negative for early endosome (Rab5) and recycling endosome (Rab11) markers4 but positive for the late endosome/lysosomal markers LAMP1 (Fig. 1, C and D), LAMP2, and Rab74 (see Fig. 3A), suggesting a late endosome/lysosomal origin (noted as lysosomes below for simplicity). Within the cortex of AKO mice, these large LAMP1-positive structures were mostly present within layer V neurons (Fig. 1F). Nevertheless, AIF deletion did not affect total LAMP1 expression (Fig. 1H), suggesting that total lysosome mass is not affected.
FIGURE 3.

LAMP1 vacuoles have endolysosomal features. A, the signal for the lysosomal marker LAMP1 (red) and the endosomal/lysosomal marker Rab7 (green) only partially colocalize within LAMP1 vacuoles in OPA1 KO MEFs. The right panels show an enlargement of the boxed section in the image on the left. B, LAMP1-positive vesicles accumulate within LAMP1 vacuoles (red) in 90-day-old AKO neurons. C, EM images of the vacuoles in OPA1 KO MEFs. D, OPA1 KO MEFs were transfected with RFP-LAMP1 (red) and incubated in the presence of the lysosomal pH-sensitive dye Lysosensor (green), and live cell images were acquired. E–G, WT and OPA1 KO MEFs were incubated for 1 h in the presence of Texas Red-conjugated dextran and chased in DMEM for the indicated times. Colocalization between dextran and LAMP1 was determined in normal lysosomes (E) and LAMP1 vacuoles (G, left). Data are expressed as the average of three experiments ± S.D. (error bars). ***, p = 2E−6. F, representative images of dextran-filled (middle) and dextran-associated (right) vacuoles. The number of dextran-filled vacuoles was also quantified in primary neurons treated for 4 h with oligomycin in the presence of dextran (G, right). Scale bar, 10 μm except for in C (left (1 μm) and right (400 nm)).
Normal lysosomes have an average diameter of 0.5–1.0 μm (39). Consistent with this, WT neuronal lysosomes had an average diameter of 0.6 μm, with the largest lysosome observed having a diameter of 2.2 μm (Fig. 2, A and B). In accordance with the presence of large LAMP1-positive vacuoles in AKO neurons, the average diameter of AKO lysosomes was increased to 1.0 μm. Of those, 3.6% had a diameter exceeding that of the largest WT lysosomes observed, with some as large as 18 μm (Fig. 2, A and B). For analysis purposes, LAMP1-positive lysosomes were then binned into three categories according to their diameter (Fig. 2A): normal lysosomes (<1.5 μm), intermediate lysosomes (1.5–3.2 μm; from 3 to 10 S.D. above average WT lysosome diameter), and LAMP1 vacuoles (>3.2 μm; 10 S.D. above the average diameter of WT lysosomes). As defined, LAMP1 vacuoles (>3.2 μm) had an average diameter of 10.7 μm (Fig. 2B), and the number of AKO layer V neurons containing a vacuole increased steadily until the death of the animals (Fig. 2, C and D; median age of death, 105 days). In addition to the vacuoles, the number of intermediate LAMP1-positive lysosomes was dramatically increased following AIF deletion (Fig. 2E). Of note, these intermediate lysosomes were observed in individual AKO neurons irrespective of the presence of a LAMP1 vacuole (Fig. 2F).
FIGURE 2.

Deletion of the mitochondrial protein AIF disrupts lysosomal size distribution in cortical neurons. A, size distribution of lysosomes in cortical neurons from 90-day-old WT and AKO animals. LAMP1-positive lysosomes were measured in 3 animals/genotype using ImageJ. B, average diameter of the entire LAMP1-positive population (blue) and LAMP1-positive vacuoles (red) measured in A. Data are expressed as the average ± S.E. (error bars). n = 506 WT lysosomes, n = 606 AKO lysosomes, and n = 15 AKO LAMP1 vacuoles, all measured from at least 3 animals/genotype. C and D, the number of neurons containing LAMP1 vacuoles increases over time in AKO mice. The number of layer V neurons containing LAMP1 vacuoles was quantified in 3 animals/genotype ± S.D. for each time point (C). AKO mice died shortly after the last time point (90 days) (D). Median age of death for males was 105 days; n = 7. E, LAMP1-positive lysosomes were binned as normal (diameter <1.5 μm), intermediate (between 1.5 and 3.2 μm), or vacuole (>3.2 μm). The number of lysosomes per bin was determined for each animal, and data are expressed as percentage of lysosomes ± S.D. (error bars) for 3 animals/genotype. (total of intermediate lysosomes and LAMP1 vacuoles). F, lysosome size was analyzed in each neuron (at least 26 neurons/animal), according to the presence or absence of a lysosomal vacuole (>3.2-μm diameter) and expressed as the number of intermediate lysosomes (between 1.5 and 3.2 μm)/neuron ± S.D., 3 animals/genotype. *, p < 0.05; **, p < 0.01; ***, p < 0.001.
The limiting membrane of LAMP1 vacuoles was heterogeneous in nature, because LAMP1 and Rab7 signals did not completely overlap around the circumference of the vacuoles in OPA1 KO MEFs (Fig. 3A). Similarly, the outer membrane of the vacuoles present in AKO neurons was uneven and contained smaller vesicular structures associated with it (Fig. 3B; see three-dimensional reconstruction on the right). To better define the nature of these structures, we visualized them by electron microscopy. Consistent with the immunofluorescence data, a subset of OPA1 KO MEFs contained large vacuoles delimited by a complex membrane structure consisting of two or more layers of overlapping membranes (Fig. 3C).
Because lysosomes and late endosomes are acidic vesicles, we also measured the pH of LAMP1 vacuoles in OPA1 KO MEFs. Cells were first transfected with an RFP-tagged version of LAMP1 (LAMP1-RFP) to identify lysosomes and then loaded with the pH-sensitive lysosomal dye Lysosensor and imaged. The membrane surrounding LAMP1 vacuoles (positive for LAMP1-RFP) was acidic as judged by Lysosensor fluorescence (Fig. 3D), supporting an endolysosomal origin for the vacuoles. However, the vacuole lumen was negative for Lysosensor (Fig. 3D), similar to what has previously been reported for the yeast vacuole (40). Nonetheless, these results raised the possibility that LAMP1 vacuoles are the consequence of the aggregation of multiple endolysosomal vesicles. To test this, we measured the capacity of LAMP1 vacuoles to incorporate endocytosed cargo, which should accumulate in their lumen only if they are actual vacuoles. OPA1 KO MEFs were thus incubated with a fluorescent dextran that is readily endocytosed and delivered to lysosomes (41), and its accumulation within lysosomes and LAMP1 vacuoles was analyzed. In both WT and OPA1 KO MEFs, half of the endocytosed dextran was already contained within normal lysosomes after a 30-min chase (Fig. 3E), indicating that loss of mitochondrial function does not lead to gross alterations in vesicular transport. More importantly, dextran accumulated in the lumen of a portion of LAMP1 vacuoles in both OPA1 KO MEFs and oligomycin-treated primary neurons (Fig. 3, F and G), consistent with the vacuolar nature of these structures.
Altogether, these results indicate that mitochondrial dysfunction causes the appearance of large cytoplasmic vacuoles with endolysosomal features. To demonstrate the importance of these changes, we then quantified lysosomal morphology in cellular models of mitochondrial dysfunction. We first measured LAMP1 vacuoles in OPA1 KO MEFs. In contrast to WT neurons in situ, where LAMP1 vacuoles were completely absent, a small number of LAMP1 vacuoles could be observed in WT MEFs under normal culture conditions (Fig. 4A). However, the number of these vacuoles dramatically increased when OPA1 was deleted (Fig. 4A). Furthermore, a similar increase in LAMP1 vacuoles was observed in WT MEFs following inhibition of the ATP synthase with oligomycin (Fig. 4A). Oligomycin treatment of OPA1 KO cells did not cause a further increase in LAMP1 vacuoles (Fig. 4A), consistent with the ATP synthase defects present in these cells (31, 37, 38). A similar increase in LAMP1 vacuoles was observed in oligomycin-treated primary neurons (Fig. 4A, right), indicating that this is a general consequence of mitochondrial dysfunction.
FIGURE 4.

Mitochondrial dysfunction impairs lysosomal activity. A and B, LAMP1 vacuoles are present in cellular models of mitochondrial dysfunction. Mitochondrial function was disrupted in MEFs and primary cortical neurons by inhibiting the ATP synthase with oligomycin. Alternatively, the mitochondrial protein OPA1 (A) or PINK1 (B) was disrupted in MEFs. The number of cells with LAMP1 vacuoles (diameter >3.0 μm) was then quantified and expressed as the average of three (OPA1 KO) or four (neurons, PINK1 MEFs) experiments ± S.D. (error bars). C, quantification of Lysosensor signal by FACS. Fluorescence was normalized to WT control (Ctrl) for three experiments ± S.D. D, lysosomal activity was measured in extracts from WT and OPA1 KO MEFs incubated in the presence of cathepsin B or acid phosphatase (AP) substrates. Fluorescence was normalized to WT MEFs and expressed as the average of three (acid phosphatase; AP) or five (cathepsin B) experiments ± S.D. Alternatively, lysosomal activity was measured in cortical extracts from 105-day-old WT and AKO (right). Data are expressed as the average of 3 animals/genotype ± S.D. E, decreased cathepsin B activity in oligomycin-treated primary neurons. Neurons were treated with oligomycin, and the cathepsin B substrate Magic Red-RR was added for the last 30 min of the treatment. Lysosomes were then stained with LAMP1, and the number of Magic Red-positive lysosomes was quantified by immunofluorescence. Data are expressed as the average of three experiments ± S.D. F and G, decreased cathepsin B expression in AKO brains. 90-day-old WT and AKO animals were stained for cathepsin B (green in G) and lysosomes (LAMP1; red in G). Quantification of 3 animals/genotype ± S.D. is shown in F. Representative images are shown; scale bar, 10 μm. H, expression level of cathepsin B in WT and OPA1 KO MEFs in the absence or in the presence of the lysosomal inhibitor bafilomycin. I, the expression of lysosomal structural proteins is not affected by the deletion of OPA1. J, cathepsin B activity was measured in extracts from WT and OPA1 KO MEFs stably expressing the indicated constructs. Data are expressed as the average of four experiments ± S.D. OPA1 and LAMP1 expression levels in the reconstituted cells are shown in K. L, extracts from WT and OPA1 KO MEFs were incubated in the presence of lysosomal acid lipase (AP) substrates, and fluorescence was measured. Data were normalized to WT MEFs and expressed as the average of five experiments ± S.D. *, p < 0.05; **, p < 0.01; ***, p < 0.001.
The PD-linked gene PINK1 functions upstream of Parkin to regulate two forms of mitochondrial quality control: mitophagy and mitochondria-derived vesicles (42, 43). As a consequence, genetic deletion of PINK1 impairs mitochondrial function (44). Consistent with this, PINK1 KO MEFs had an elevated number of LAMP1 vacuoles (Fig. 4B), further supporting a link between loss of mitochondrial function and lysosome alterations. Altogether, these results demonstrate that lysosomal alterations are a common feature of loss of mitochondrial function in disease-relevant models.
Impaired Lysosomal Activity following Mitochondrial Dysfunction
To determine whether the alterations in endolysosome structure impacted lysosomal function, we first measured lysosomal acidification in OPA1 KO MEFs by FACS. Lysosensor signal was decreased in OPA1 KO MEFs, indicative of defective lysosomal acidification (Fig. 4C). As a control, inhibition of the V-ATPase with bafilomycin impaired lysosomal acidification in WT MEFs, but did not further affect lysosomal pH in OPA1 KO MEFs (Fig. 4C). Because these results suggest that lysosomal function is impaired following mitochondrial dysfunction, we then measured lysosomal activity in cells with mitochondrial dysfunction. Consistent with the impaired lysosomal acidification observed in OPA1 KO MEFs, the activity of the lysosomal protease cathepsin B was significantly decreased in both OPA1 KO MEFs and AKO neurons (Fig. 4D). Similarly, treatment of primary neurons with oligomycin greatly reduced the number of lysosomes positive for the cathepsin B substrate Magic Red-RR (Fig. 4E). This correlated with a decrease in the number of cathepsin B-positive lysosomes in AKO neurons (Fig. 4, F and G) and a dramatic decrease in active cathepsin B levels in OPA1 KO MEFs (Fig. 4H), consistent with the short half-life of cathepsin B under neutral conditions (45). In fact, inhibition of lysosomal acidification with bafilomycin decreased the expression of active cathepsin B in WT MEFs to levels similar to those of OPA1 KO MEFs (Fig. 4H). On the other hand, the expression level of the lysosomal membrane proteins LAMP1 and LAMP2 was not altered (Fig. 4I). Importantly, the loss of cathepsin B activity was rescued by reintroducing WT OPA1 or a fusion-incompetent mutant that still rescues cristae structure (OPA1(Q297V)) in OPA1 KO MEFs (31) (Fig. 4, J and K), indicating that the loss of lysosomal activity is the consequence of the mitochondrial defects present in OPA1 KO cells.
To further demonstrate the impairment of lysosomal activity following the disruption of mitochondrial function, we measured the activity of two other lysosomal enzymes: acid phosphatase and lysosomal acid lipase. Consistent with the decrease in cathepsin B activity, acid phosphatase activity was significantly decreased in both OPA1 KO MEFs and AKO neurons (Fig. 4D). Similarly, lysosomal acid lipase activity was significantly decreased in OPA1 KO MEFs (Fig. 4L).
Impaired lysosomes should lead to the accumulation of undigested substrates within affected cells. Because defective mitochondria are removed by mitophagy, we determined whether this process was impaired in our models of mitochondrial dysfunction. We did not observe any change in the expression of mitochondrial proteins in either AIF KO brains (Fig. 1B) or OPA1 KO MEFs (Fig. 5A), even in the presence of bafilomycin to inhibit lysosomal degradation (Fig. 5A), suggesting that there is only minimal mitophagy occurring in these cells. Nonetheless, mitochondrial markers accumulated within OPA1 KO lysosomes (Fig. 5B), consistent with the decreased lysosomal activity present in these cells. Similarly, AKO mice accumulated large aggregates that are normally cleared by autophagy within their cortical neurons (Fig. 5C).
FIGURE 5.
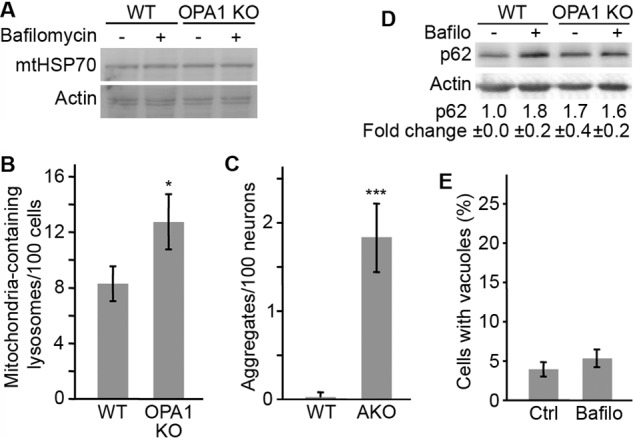
Mitochondrial dysfunction impairs the degradation of lysosomal substrates. A, levels of the mitochondrial protein mtHSP70 were analyzed in WT and OPA1 KO MEFs in the absence or the presence of bafilomycin. B, the number of mtHSP70-containing LAMP1-positive lysosomes was quantified by immunofluorescence. C, the presence of large autofluorescent aggregates was quantified in 90-day-old WT and AKO animals and expressed as the average number of aggregates/neuron ± S.D. (error bars). D, levels of the autophagy proteins p62 were quantified by Western blot in WT and OPA1 KO MEFs in the absence or the presence of bafilomycin. The results were quantified using ImageJ and expressed as an average of three independent experiments ± S.D. E, WT MEFs were treated with bafilomycin, and vacuole formation was measured as in Fig. 4A. Data are expressed as the average of three experiments ± S.D. *, p < 0.05; ***, p < 0.001.
To further demonstrate that the impaired lysosomal function caused by loss of mitochondrial activity inhibits autophagic flux, we measured p62 levels in OPA1 KO MEFs in the absence and the presence of bafilomycin. Because p62 is normally degraded within lysosomes, its levels were increased following lysosomal inhibition with bafilomycin in WT MEFs (Fig. 5D). In contrast, p62 levels were higher in OPA1 KO and were not further increased by bafilomycin treatment (Fig. 5D). Altogether, these results indicate that mitochondrial dysfunction impairs lysosomal activity. It is important to note, however, that decreased lysosomal activity is not sufficient to cause LAMP1 vacuoles, because bafilomycin treatment failed to cause vacuole accumulation (Fig. 5E).
Mitochondrial Reactive Oxygen Species Regulate Lysosome Structure in Response to Mitochondrial Dysfunction
To address the mechanism through which loss of mitochondrial function impairs endosomes/lysosomes, we first determined whether specific electron transport chain components were involved. Chemical inhibition of individual ETC complexes caused the formation of LAMP1 vacuoles irrespective of the complex that was inhibited (Fig. 6A). This indicates that vacuole formation is a general consequence of the loss of mitochondrial function and is not specific to a particular ETC complex. We then addressed the role of ATP production in LAMP1 vacuole formation. Total ATP levels were not affected by OPA1 deletion or Oligomycin treatment in MEFs (Fig. 6B), suggesting that LAMP1 vacuoles are not the consequence of decreased ATP levels. However, it remained possible that mitochondrial ATP production rather than total ATP levels regulates the formation of LAMP1 vacuoles. To test this possibility, we incubated primary neurons for 4 h in the absence of glucose, which dramatically reduces ATP levels in neurons (Fig. 6C). Under these conditions, we observed a small but significant increase in the number of LAMP1 vacuoles (Fig. 6C, right), suggesting that mitochondrial ATP production could play a role in LAMP1 vacuole formation. However, given the small effect of decreased ATP production, other mechanisms are probably involved.
FIGURE 6.

LAMP1 vacuole formation depends on the loss of mitochondrial function but not total ATP levels. A, WT MEFs were treated with the complex I inhibitor rotenone (Rot), the complex III inhibitor antimycin A (Anti A), or the complex IV inhibitor sodium azide (Azide), and LAMP1 vacuoles were quantified in the absence or the presence of the antioxidant MitoQ or NAC. OPA1 KO MEFs were included as a positive control. Data are expressed as the average of four experiments ± S.D. (error bars). B, ATP levels are not altered in OPA1 KO MEFs or WT MEFs treated with 10 μm oligomycin. ATP levels were normalized to WT (right) or control (left) levels and expressed as the average of three experiments ± S.D. C, primary neurons were incubated in glucose-free media for 4 h, after which ATP levels and LAMP1 vacuole content were measured. Data are expressed as the average of four experiments ± S.D. D and E, ROS levels were measured using MitoSOX following ETC inhibition (D; compounds as in A) or in OPA1 KO MEFs stably expressing the indicated constructs (E). Data are expressed as the average of four experiments ± S.D. F, OPA1 KO lysosomal morphology is rescued by reintroducing WT OPA1 or the fusion-defective mutant OPA1(Q297V). Data are expressed as the average of three experiments ± S.D. Expression of the OPA1 constructs is shown in Fig. 4K. *, p < 0.05; ***, p < 0.001.
A second important consequence of disrupted mitochondrial function is increased ROS generation. Consistent with this, chemical inhibition of ETC complexes increased ROS production in WT MEFs, as measured by the increase in fluorescence of the ROS indicator MitoSOX (Fig. 6D). Similarly, ROS levels were significantly elevated in OPA1 KO MEFs, and this was rescued by the reintroduction of WT OPA1 or OPA1(Q297V) (Fig. 6E), concomitant with rescue of lysosomal structure (Fig. 6F) and function (Fig. 4J).
Because these results suggested that ROS could be involved in LAMP1 vacuole formation, we manipulated ROS in cells with disrupted mitochondrial function. Consistent with a role of ROS in vacuole formation, the antioxidants NAC and Q10 significantly reduced MitoSOX fluorescence (Fig. 7, A and B) and prevented the appearance of LAMP1 vacuoles in OPA1 KO MEFs (Fig. 7, C and D) and in WT MEFs treated with ETC inhibitors (Fig. 6A). Similarly, MitoQ, a mitochondria-targeted Q10 derivative (46), prevented vacuole formation (Figs. 6A and 7E), consistent with its ability to decrease ROS levels in WT and OPA1 KO MEFs (Fig. 7B).
FIGURE 7.

Quenching ROS rescues lysosomal defects following mitochondrial dysfunction. A and B, the increased ROS levels present in OPA1 KO MEFs are reduced by the antioxidants NAC (A), Q10, and the mitochondria-targeted form of Q10 (MitoQ) (B). Data are expressed as the average of four experiments ± S.D. (error bars) (n = 3 for NAC). C–E, antioxidants prevent LAMP1 vacuole formation. Vacuoles were quantified as in Fig. 4A, and the data are expressed as the average of three experiments ± S.D. (n = 4 for NAC). F–H, ROS were measured in myxothiazol-treated WT and OPA1 KO MEFs using MitoSOX (F). LAMP1 vacuole formation was then quantified in WT and OPA1 KO MEFs (G) as well as in GFP-Parkin-expressing U2OS cells in the absence or the presence of the antioxidants MitoQ and NAC (H). Data are expressed as the average of four experiments (MEFs) and three experiments (U2OS) ± S.D. *, p < 0.05; **, p < 0.01; ***, p < 0.001.
To further define the role of ROS in LAMP1 vacuole formation, we compared lysosome structure and function in cells treated with the complex III inhibitor antimycin A (which causes matrix and intermembrane space ROS production; Fig. 6A) or myxothiazol (which induces no detectable increase in superoxide production as detected with MitoSOX; Fig. 7G) (47). Strikingly, both inhibitors triggered the formation of LAMP1 vacuoles in WT MEFs (Figs. 6A and 7G) and in U2OS cells (Fig. 7H). However, consistent with superoxide production, only vacuoles caused by antimycin were prevented by antioxidants (Fig. 7H). Although these results are consistent with superoxide not directly causing LAMP1 vacuole formation, myxothiazol has previously been shown to induce H2O2 production under some circumstances (48, 49), suggesting that other forms of ROS could nonetheless play a role.
Exogenous H2O2 Promotes LAMP1 Vacuole Formation
The fact that myxothiazol can stimulate H2O2 production led us to test whether oxidative stress can directly affect lysosomes. To test this, we increased cellular ROS using two distinct approaches. First, we increased cytoplasmic ROS by inhibiting superoxide dismutase 1 (SOD1). SOD1 is localized in the cytosol and mitochondrial intermembrane space, where it detoxifies superoxide radicals by transforming them in H2O2, which is then degraded (47). Incubation of WT MEFs with the SOD1 inhibitor DDC increased ROS to a level similar to that of control OPA1 KO MEFs (Fig. 8A). However, this increase in ROS did not cause a significant accumulation of LAMP1 vacuoles in WT MEFs or affect the number of LAMP1 vacuoles in OPA1 KO MEFs (Fig. 8B).
FIGURE 8.

Vacuole formation requires mitochondrial damage downstream of ROS. A and B, WT and OPA1 KO MEFs were treated with the SOD1 inhibitor DDC, and ROS levels were measured with MitoSOX. LAMP1 vacuoles were then measured and expressed as the average of three experiments ± S.D. (error bars). C, WT MEFs were treated for 1 h with glucose oxidase (GO). Vacuoles were then quantified and expressed as the average of three experiments ± S.D. D and E, U2OS cells stably expressing GFP-Parkin were treated as indicated, fixed, and stained for the mitochondrial markers mtHSP70 (green) and TOM20 (red) as well as GFP-Parkin (blue). GFP-Parkin MDV and mtHSP70-positive TOM20-negative MDV were quantified. At least 70 cells were quantified within three independent experiments, and the data are expressed as the number of MDVs/cell ± S.E. (error bars). Alternatively, the number of LAMP1 vacuoles containing Parkin-positive MDVs was quantified and expressed as the average of four experiments ± S.D. F, representative images are shown in D. Scale bar, 2 μm. F and G, U2OS cells stably expressing GFP-Parkin were treated with the complex III inhibitor antimycin A or the ATP synthase inhibitor oligomycin. Recruitment of GFP-Parkin (blue in G (top)) to LAMP1 vacuoles (red in G (top)) and TOM20-positive mitochondria (green in G (top)) was then analyzed by immunofluorescence. The number of vacuoles containing Parkin-positive MDVs was quantified in F and expressed as the average of four experiments ± S.D. H and I, oligomycin causes LAMP1 vacuole formation despite minimal Parkin-positive MDV production. H, GFP-Parkin-positive MDVs were quantified from a minimum of 100 cells within three independent experiments and expressed as the number of MDVs/cell ± S.D. Alternatively, LAMP1 vacuoles were quantified and expressed as the average of three independent experiments ± S.D. I, *, p < 0.05; **, p < 0.01; ***, p < 0.001.
Importantly, SOD1 inhibition increases superoxide at the expense of its product, H2O2. Because H2O2 diffuses more easily than superoxide and has previously been shown to enter lysosomes and damage them through Fenton-like reactions (50), it is possible that it is H2O2 that is responsible for vacuole formation. To test this, we incubated WT MEFs with glucose oxidase, which produces H2O2 in the presence of glucose. A 1-h incubation with glucose oxidase caused a small but significant increase in LAMP1 vacuoles in WT MEFs (Fig. 8C), suggesting that H2O2 can directly target lysosomes to induce vacuole formation.
Mitochondria-derived Vesicles Are Not Required for LAMP1 Vacuole Formation
ROS, including H2O2, causes mitochondrial damage that is removed through the formation of MDVs, small vesicles that deliver damaged mitochondrial components to lysosomes for degradation (41, 42). Consistent with this, antimycin A treatment of U2OS cells expressing GFP-Parkin causes the formation of Parkin-positive MDVs as well as of MDV positive for a matrix marker (mtHSP70) but negative for outer membrane marker TOM20 (Fig. 8, D and E). Importantly, myxothiazol treatment also caused an increase in mtHSP70 and Parkin-positive MDVs (Fig. 8, D and E), indicating that myxothiazol causes mitochondrial damage despite not generating detectable superoxide production. Of note, whereas GFP-Parkin-positive MDVs could sometimes be found inside LAMP1 vacuoles following antimycin A treatment, the delimiting membrane of the vacuoles was negative for Parkin (Fig. 8, F and G). Similarly, oligomycin treatment only caused minimal redistribution of GFP-Parkin (Fig. 8, G and H), which mostly remained cytosolic (Fig. 8G), but triggered the formation of LAMP1 vacuoles to a similar extent as antimycin A (Fig. 8I). Together with the increase in LAMP1 vacuole observed in PINK1 KO MEFs, where both mitophagy and MDV pathways are inhibited (20, 42), these results indicate that Parkin-positive MDVs are not required for LAMP1 vacuole formation.
Lysosomal Activity Is Rescued by Antioxidants in OPA1 KO MEFs
Our results indicate that oxidative stress plays an important role in the generation of LAMP1 vacuoles. To determine whether the loss of lysosomal activity was also ROS-dependent, we measured lysosomal function in the presence of ROS scavengers. Incubation of OPA1 KO MEFs with NAC or Q10, which prevented the appearance of LAMP1 vacuoles (Fig. 7, C and D), also partially rescued lysosomal pH and activity (Fig. 9, A–D). However, inhibition of matrix ROS with MitoQ, which abrogated LAMP1 vacuoles (Fig. 7E), failed to rescue lysosomal pH or activity (Fig. 9, B and E), suggesting that LAMP1 vacuoles and lysosomal activity are regulated in a distinct manner. This is consistent with the observation that antimycin A, but not myxothiazol, inhibits cathepsin B activity. (Fig. 9F).
FIGURE 9.

Antioxidants rescue lysosomal function following the loss of mitochondrial function. A and B, WT and OPA1 KO MEFs were incubated in the presence of NAC (A) or Q10 or MitoQ (B), and lysosomal pH was measured using Lysosensor. Data are expressed as the average of three experiments (NAC) or four experiments (Q10 and MitoQ) ± S.D. (error bars). C–E, WT and OPA1 KO MEFs were incubated in the presence of NAC (C), Q10 (D), or MitoQ (E). In vitro cathepsin B activity was then measured and expressed as the average of five (NAC), four (Q10, antimycin A), or three (MitoQ) experiments ± S.D. F, cells were treated with the ROS-generating complex III inhibitor antimycin A (Anti A) or myxothiazol (Myxo), which inhibits complex III without generating ROS. In vitro cathepsin B activity was then measured and expressed as the average of four experiments ± S.D. G and H, NAM rescues NAD/NADH ratio but not lysosomal activity in OPA1 KO MEFs. NAD/NADH ratio and cathepsin B activity were measured in WT and OPA1 KO MEFs following a 2-day treatment with NAM. Results are expressed as the average of three experiments ± S.D. *, p < 0.05; **, p < 0.01; ***, p < 0.001.
It was recently suggested that loss of mitochondrial function in T cells decreases lysosomal activity as a consequence of decreased NAD/NADH ratio (51). Because antioxidants did not completely rescue lysosomal activity in OPA1 KO cells, we determined whether NAD levels could play a role in maintaining lysosomal activity in these cells. Consistent with the ETC defects present in OPA1 KO MEFs, their NAD/NADH ratio was decreased (Fig. 9G). We thus tested whether the NAD precursor NAM could rescue lysosomal activity in OPA1 KO cells. Although NAM increased the NAD/NADH ratio in OPA1 KO cells, it did not rescue cathepsin B activity (Fig. 9H). This indicates that increasing NAD levels is not sufficient to recue lysosomal function. Altogether, our results indicate that mitochondrial dysfunction impairs lysosomal structure and function in a manner that is ROS-dependent.
Discussion
A complex relationship exists between aggregate-prone proteins, mitochondrial dysfunction, and cellular degradation pathways within the context of neurodegenerative diseases. In some cases, mutations in aggregate-prone proteins (α-synuclein in PD, huntingtin in Huntington disease) cause their accumulation and are directly linked to neuronal loss (1, 2). However, in most circumstances, aggregate accumulation is secondary to other neuronal defects that are not fully defined but are associated with impaired degradation pathways, mitochondrial dysfunction, and oxidative stress (1–3, 25). We show here that loss of mitochondrial activity disrupts lysosomal structure and function, leading to aggregate accumulation. Our results thus provide a direct link between mitochondrial dysfunction and alterations in protein degradation pathways.
We used several different models of mitochondrial dysfunction (AIF KO neurons, PINK1 KO MEFs, OPA1 KO MEFs, and ETC inhibition in MEFs and primary neurons) to define the role of mitochondria in the maintenance of lysosomes. Disruption of mitochondrial function inhibited lysosomal activity and triggered the accumulation of large vacuoles positive for lysosomal markers in every model examined, demonstrating that mitochondria are required to maintain proper lysosomal function.
Loss of mitochondrial function is associated with mitochondrial fragmentation, decreased mitochondrial ATP, and increased ROS production (3, 26, 47), each potentially affecting lysosomes. However, the fact that fusion-incompetent OPA1(Q297V) (31) rescued lysosomal function in OPA1 KO MEFs indicates that mitochondrial fusion is not involved in this process. On the other hand, lysosomal function was rescued by antioxidants, suggesting that oxidative stress plays an important role in the lysosomal phenotype arising as a consequence of mitochondrial dysfunction. This is further supported by our observation that exogenous glucose oxidase-generated H2O2 promotes the formation of LAMP1 vacuoles. Nevertheless, because neurons incubated in glucose-free media show decreased ATP levers and increased LAMP1 vacuoles, we cannot exclude the possibility that changes in mitochondrial ATP levels (but not total ATP) also contribute to the lysosomal phenotype. In fact, it is likely that metabolic imbalance regulates lysosomes in parallel to oxidative stress. Indeed, the NAD precursor NAM rescued the lysosomal defects present in TFAM−/− T lymphocytes (51). However, we could not replicate this rescue in OPA1 KO MEFs. Because OPA1 interacts with several of the transporters required to shuttle metabolites across the mitochondrial inner membrane (31), other metabolites could be involved. Still, the accumulation of aggregates within AKO neurons with defective lysosomes highlights the crucial relationship between mitochondrial dysfunction, ROS, and impaired lysosomes.
Mitochondrial dysfunction is a key feature of neurodegenerative diseases, including PD, Alzheimer disease, and Huntington disease (reviewed in Refs. 3, 52, and 53). One way in which mitochondrial function is affected in neurodegenerative diseases is through the accumulation and aggregation of disease-causing aggregate-prone proteins, such as α-synuclein (PD) or huntingtin (Huntington disease). Mutant forms of these proteins have been shown to impair mitochondria, in part through direct targeting of these organelles (16, 54, 55). Similarly, impaired autophagy/lysosomes cause the accumulation of defective mitochondria in several models of neurodegenerative diseases (6, 56, 57). Of note, this impaired autophagic clearance often occurs as the consequence of dysfunctional lysosomes (10, 57, 58), and mutations in lysosomal proteins lead to neurodegeneration (6, 7, 12). For example, mutations in lysosomal hydrolases lead to the accumulation of intracellular material and neurodegeneration (12), a group of diseases collectively referred to as lysosomal storage diseases.
On the other hand, although impaired lysosomal activity clearly leads to neurodegeneration, mitochondrial dysfunction and downstream oxidative stress also play a major role. In fact, mitochondrial dysfunction caused by mutations in mitochondrial proteins is the primary trigger of neuronal loss in several examples of neurodegeneration (59). In addition, mutations in the mitochondrial quality control proteins PINK1 and Parkin cause the accumulation of defective mitochondria, leading to PD in humans (60–62). Although these mutations account for only a small subset of PD patients, sporadic cases of PD also generally show alterations in mitochondrial function, usually decreased complex I activity (25, 52). This possibly occurs through aging-related loss of mitochondrial fitness or exposure to complex I toxins, such as rotenone (25), all of which increase ROS-mediated damage and accumulation of protein aggregates (13, 14, 63–65).
ROS play complex roles in cellular physiology and pathology, including neurodegenerative diseases. For example, ROS-mediated neuronal damage has been observed in PD, Alzheimer disease, and ALS (3, 52). Consistent with the deleterious effects of oxidative stress, a large surge in ROS causes rapid cell death that can be associated with lysosomal membrane permeabilization. For example, neuronal death caused by the parkinsonian toxin MPP+ is associated with lysosomal depletion (10), possibly as a result of Fenton-like reactions involving hydrogen peroxide within lysosomes (50). In contrast, the lysosomal impairment that we observed in our models of mitochondrial dysfunction was not associated with a loss of structural proteins, such as LAMP1. This suggests that milder oxidative stress impairs lysosomes through mechanisms that are distinct from acute ROS exposure. Because oxidative damage and neuronal death accumulate over many years in human patients (25, 66, 67), this could be highly relevant to the long term changes occurring in neurons affected by neurodegenerative diseases. In that context, it is noteworthy that AIF KO neurons, which show increased oxidative damage (68), had decreased lysosomal activity and accumulation of LAMP1 vacuoles over time but had limited neuronal death at 3 months (28) and normal LAMP1 levels. This contrasts with the acute oxidative stress caused in mice by MPTP injections, which lead to rapid neuronal loss and loss of lysosomal content (10).
Altogether, our results indicate that loss of mitochondrial function impairs lysosomes. Because alterations in mitochondrial function and lysosomal activity are key features of neurodegenerative diseases, our work provides important insights into our understanding of the etiology of neurodegenerative diseases.
Author Contributions
J. D. L., A. P. N., and M. Germain designed research; J. D. L., G. G., M. T., K. T., N. B., A. P. N., M. Grondin, and M. Germain performed research; J. D. L., M. T., J. M., and M. Germain analyzed data; M. Germain wrote the paper.
Acknowledgments
We thank Linda Jiu for tissue preparation, Ujval Anilkumar and Jason MacLaurin for help with neuronal cultures, Agnes Lejeune for EM imaging, and Valerie Gervais for help with the MDV experiments. We also thank Ruth Slack, David Patten, and Mireille Khacho for insightful comments on the manuscript.
This work was supported by a grant from the Natural Sciences and Engineering Research Council of Canada. The authors declare that they have no conflicts of interest with the contents of this article.
J. Demers-Lamarche and M. Germain, unpublished observations.
- PD
- Parkinson disease
- AKO
- AIF knockout
- ETC
- electron transport chain
- NAM
- nicotinamide
- MDV
- mitochondria-derived vesicle
- MEF
- mouse embryonic fibroblast
- NAC
- N-acetylcysteine
- ROS
- reactive oxygen species
- AIF
- apoptosis-inducing factor
- Q10
- ubiquinone
- SOD
- superoxide dismutase
- mtHSP70
- mitochondrial HSP70
- DDC
- diethyldithiocarbamate.
References
- 1. Ben-Gedalya T., and Cohen E. (2012) Quality control compartments coming of age. Traffic 13, 635–642 [DOI] [PubMed] [Google Scholar]
- 2. Tai H. C., and Schuman E. M. (2008) Ubiquitin, the proteasome and protein degradation in neuronal function and dysfunction. Nat. Rev. Neurosci. 9, 826–838 [DOI] [PubMed] [Google Scholar]
- 3. Patten D. A., Germain M., Kelly M. A., and Slack R. S. (2010) Reactive oxygen species: stuck in the middle of neurodegeneration. J. Alzheimers Dis. 20, S357–S367 [DOI] [PubMed] [Google Scholar]
- 4. Boya P., Reggiori F., and Codogno P. (2013) Emerging regulation and functions of autophagy. Nat. Cell Biol. 15, 713–720 [DOI] [PMC free article] [PubMed] [Google Scholar]
- 5. Mizushima N., and Komatsu M. (2011) Autophagy: renovation of cells and tissues. Cell 147, 728–741 [DOI] [PubMed] [Google Scholar]
- 6. Osellame L. D., Rahim A. A., Hargreaves I. P., Gegg M. E., Richard-Londt A., Brandner S., Waddington S. N., Schapira A. H., and Duchen M. R. (2013) Mitochondria and quality control defects in a mouse model of Gaucher disease: links to Parkinson's disease. Cell Metab. 17, 941–953 [DOI] [PMC free article] [PubMed] [Google Scholar]
- 7. Schultheis P. J., Fleming S. M., Clippinger A. K., Lewis J., Tsunemi T., Giasson B., Dickson D. W., Mazzulli J. R., Bardgett M. E., Haik K. L., Ekhator O., Chava A. K., Howard J., Gannon M., Hoffman E., et al. (2013) Atp13a2-deficient mice exhibit neuronal ceroid lipofuscinosis, limited α-synuclein accumulation and age-dependent sensorimotor deficits. Hum. Mol. Genet. 22, 2067–2082 [DOI] [PMC free article] [PubMed] [Google Scholar]
- 8. Chu Y., Dodiya H., Aebischer P., Olanow C. W., and Kordower J. H. (2009) Alterations in lysosomal and proteasomal markers in Parkinson's disease: relationship to α-synuclein inclusions. Neurobiol. Dis. 35, 385–398 [DOI] [PubMed] [Google Scholar]
- 9. Arduíno D. M., Esteves A. R., Cortes L., Silva D. F., Patel B., Grazina M., Swerdlow R. H., Oliveira C. R., and Cardoso S. M. (2012) Mitochondrial metabolism in Parkinson's disease impairs quality control autophagy by hampering microtubule-dependent traffic. Hum. Mol. Genet. 21, 4680–4702 [DOI] [PMC free article] [PubMed] [Google Scholar]
- 10. Dehay B., Bové J., Rodríguez-Muela N., Perier C., Recasens A., Boya P., and Vila M. (2010) Pathogenic lysosomal depletion in Parkinson's disease. J. Neurosci. 30, 12535–12544 [DOI] [PMC free article] [PubMed] [Google Scholar]
- 11. Tanik S. A., Schultheiss C. E., Volpicelli-Daley L. A., Brunden K. R., and Lee V. M. (2013) Lewy body-like α-synuclein aggregates resist degradation and impair macroautophagy. J. Biol. Chem. 288, 15194–15210 [DOI] [PMC free article] [PubMed] [Google Scholar]
- 12. Cox T. M., and Cachón-González M. B. (2012) The cellular pathology of lysosomal diseases. J. Pathol. 226, 241–254 [DOI] [PubMed] [Google Scholar]
- 13. Keeney P. M., Xie J., Capaldi R. A., and Bennett J. P. Jr. (2006) Parkinson's disease brain mitochondrial complex I has oxidatively damaged subunits and is functionally impaired and misassembled. J. Neurosci. 26, 5256–5264 [DOI] [PMC free article] [PubMed] [Google Scholar]
- 14. Parker W. D. Jr., Parks J. K., and Swerdlow R. H. (2008) Complex I deficiency in Parkinson's disease frontal cortex. Brain Res. 1189, 215–218 [DOI] [PMC free article] [PubMed] [Google Scholar]
- 15. Kopeikina K. J., Carlson G. A., Pitstick R., Ludvigson A. E., Peters A., Luebke J. I., Koffie R. M., Frosch M. P., Hyman B. T., and Spires-Jones T. L. (2011) Tau accumulation causes mitochondrial distribution deficits in neurons in a mouse model of tauopathy and in human Alzheimer's disease brain. Am. J. Pathol. 179, 2071–2082 [DOI] [PMC free article] [PubMed] [Google Scholar]
- 16. Shirendeb U., Reddy A. P., Manczak M., Calkins M. J., Mao P., Tagle D. A., and Reddy P. H. (2011) Abnormal mitochondrial dynamics, mitochondrial loss and mutant huntingtin oligomers in Huntington's disease: implications for selective neuronal damage. Hum. Mol. Genet. 20, 1438–1455 [DOI] [PMC free article] [PubMed] [Google Scholar]
- 17. Wang X., Su B., Siedlak S. L., Moreira P. I., Fujioka H., Wang Y., Casadesus G., and Zhu X. (2008) Amyloid-β overproduction causes abnormal mitochondrial dynamics via differential modulation of mitochondrial fission/fusion proteins. Proc. Natl. Acad. Sci. U.S.A. 105, 19318–19323 [DOI] [PMC free article] [PubMed] [Google Scholar]
- 18. Greene A. W., Grenier K., Aguileta M. A., Muise S., Farazifard R., Haque M. E., McBride H. M., Park D. S., and Fon E. A. (2012) Mitochondrial processing peptidase regulates PINK1 processing, import and Parkin recruitment. EMBO Rep. 13, 378–385 [DOI] [PMC free article] [PubMed] [Google Scholar]
- 19. Narendra D., Tanaka A., Suen D. F., and Youle R. J. (2008) Parkin is recruited selectively to impaired mitochondria and promotes their autophagy. J. Cell Biol. 183, 795–803 [DOI] [PMC free article] [PubMed] [Google Scholar]
- 20. Vives-Bauza C., Zhou C., Huang Y., Cui M., de Vries R. L., Kim J., May J., Tocilescu M. A., Liu W., Ko H. S., Magrané J., Moore D. J., Dawson V. L., Grailhe R., Dawson T. M., et al. (2010) PINK1-dependent recruitment of Parkin to mitochondria in mitophagy. Proc. Natl. Acad. Sci. U.S.A. 107, 378–383 [DOI] [PMC free article] [PubMed] [Google Scholar]
- 21. Irrcher I., Aleyasin H., Seifert E. L., Hewitt S. J., Chhabra S., Phillips M., Lutz A. K., Rousseaux M. W., Bevilacqua L., Jahani-Asl A., Callaghan S., MacLaurin J. G., Winklhofer K. F., Rizzu P., Rippstein P., et al. (2010) Loss of the Parkinson's disease-linked gene DJ-1 perturbs mitochondrial dynamics. Hum. Mol. Genet. 19, 3734–3746 [DOI] [PubMed] [Google Scholar]
- 22. Alexander C., Votruba M., Pesch U. E., Thiselton D. L., Mayer S., Moore A., Rodriguez M., Kellner U., Leo-Kottler B., Auburger G., Bhattacharya S. S., and Wissinger B. (2000) OPA1, encoding a dynamin-related GTPase, is mutated in autosomal dominant optic atrophy linked to chromosome 3q28. Nat. Genet. 26, 211–215 [DOI] [PubMed] [Google Scholar]
- 23. Delettre C., Lenaers G., Griffoin J. M., Gigarel N., Lorenzo C., Belenguer P., Pelloquin L., Grosgeorge J., Turc-Carel C., Perret E., Astarie-Dequeker C., Lasquellec L., Arnaud B., Ducommun B., Kaplan J., et al. (2000) Nuclear gene OPA1, encoding a mitochondrial dynamin-related protein, is mutated in dominant optic atrophy. Nat. Genet. 26, 207–210 [DOI] [PubMed] [Google Scholar]
- 24. Züchner S., Mersiyanova I. V., Muglia M., Bissar-Tadmouri N., Rochelle J., Dadali E. L., Zappia M., Nelis E., Patitucci A., Senderek J., Parman Y., Evgrafov O., Jonghe P. D., Takahashi Y., Tsuji S., et al. (2004) Mutations in the mitochondrial GTPase mitofusin 2 cause Charcot-Marie-Tooth neuropathy type 2A. Nat. Genet. 36, 449–451 [DOI] [PubMed] [Google Scholar]
- 25. Exner N., Lutz A. K., Haass C., and Winklhofer K. F. (2012) Mitochondrial dysfunction in Parkinson's disease: molecular mechanisms and pathophysiological consequences. EMBO J. 31, 3038–3062 [DOI] [PMC free article] [PubMed] [Google Scholar]
- 26. Raimundo N. (2014) Mitochondrial pathology: stress signals from the energy factory. Trends Mol. Med. 20, 282–292 [DOI] [PubMed] [Google Scholar]
- 27. Graef M., and Nunnari J. (2011) Mitochondria regulate autophagy by conserved signalling pathways. EMBO J. 30, 2101–2114 [DOI] [PMC free article] [PubMed] [Google Scholar]
- 28. Germain M., Nguyen A. P., Khacho M., Patten D. A., Screaton R. A., Park D. S., and Slack R. S. (2013) LKB1-regulated adaptive mechanisms are essential for neuronal survival following mitochondrial dysfunction. Hum. Mol. Genet. 22, 952–962 [DOI] [PubMed] [Google Scholar]
- 29. Joza N., Oudit G. Y., Brown D., Bénit P., Kassiri Z., Vahsen N., Benoit L., Patel M. M., Nowikovsky K., Vassault A., Backx P. H., Wada T., Kroemer G., Rustin P., and Penninger J. M. (2005) Muscle-specific loss of apoptosis-inducing factor leads to mitochondrial dysfunction, skeletal muscle atrophy, and dilated cardiomyopathy. Mol. Cell. Biol. 25, 10261–10272 [DOI] [PMC free article] [PubMed] [Google Scholar]
- 30. Casanova E., Fehsenfeld S., Mantamadiotis T., Lemberger T., Greiner E., Stewart A. F., and Schütz G. (2001) A CamKIIα iCre BAC allows brain-specific gene inactivation. Genesis 31, 37–42 [DOI] [PubMed] [Google Scholar]
- 31. Patten D. A., Wong J., Khacho M., Soubannier V., Mailloux R. J., Pilon-Larose K., MacLaurin J. G., Park D. S., McBride H. M., Trinkle-Mulcahy L., Harper M. E., Germain M., and Slack R. S. (2014) OPA1-dependent cristae modulation is essential for cellular adaptation to metabolic demand. EMBO J. 33, 2676–2691 [DOI] [PMC free article] [PubMed] [Google Scholar]
- 32. Germain M., Nguyen A. P., Le Grand J. N., Arbour N., Vanderluit J. L., Park D. S., Opferman J. T., and Slack R. S. (2011) MCL-1 is a stress sensor that regulates autophagy in a developmentally regulated manner. EMBO J. 30, 395–407 [DOI] [PMC free article] [PubMed] [Google Scholar]
- 33. Dairaku T., Iwamoto T., Nishimura M., Endo M., Ohashi T., and Eto Y. (2014) A practical fluorometric assay method to measure lysosomal acid lipase activity in dried blood spots for the screening of cholesteryl ester storage disease and Wolman disease. Mol. Genet. Metab. 111, 193–196 [DOI] [PubMed] [Google Scholar]
- 34. Cheung E. C., Joza N., Steenaart N. A., McClellan K. A., Neuspiel M., McNamara S., MacLaurin J. G., Rippstein P., Park D. S., Shore G. C., McBride H. M., Penninger J. M., and Slack R. S. (2006) Dissociating the dual roles of apoptosis-inducing factor in maintaining mitochondrial structure and apoptosis. EMBO J. 25, 4061–4073 [DOI] [PMC free article] [PubMed] [Google Scholar]
- 35. Vahsen N., Candé C., Brière J. J., Bénit P., Joza N., Larochette N., Mastroberardino P. G., Pequignot M. O., Casares N., Lazar V., Feraud O., Debili N., Wissing S., Engelhardt S., Madeo F., et al. (2004) AIF deficiency compromises oxidative phosphorylation. EMBO J. 23, 4679–4689 [DOI] [PMC free article] [PubMed] [Google Scholar]
- 36. Pospisilik J. A., Knauf C., Joza N., Benit P., Orthofer M., Cani P. D., Ebersberger I., Nakashima T., Sarao R., Neely G., Esterbauer H., Kozlov A., Kahn C. R., Kroemer G., Rustin P., Burcelin R., and Penninger J. M. (2007) Targeted deletion of AIF decreases mitochondrial oxidative phosphorylation and protects from obesity and diabetes. Cell 131, 476–491 [DOI] [PubMed] [Google Scholar]
- 37. Cogliati S., Frezza C., Soriano M. E., Varanita T., Quintana-Cabrera R., Corrado M., Cipolat S., Costa V., Casarin A., Gomes L. C., Perales-Clemente E., Salviati L., Fernandez-Silva P., Enriquez J. A., and Scorrano L. (2013) Mitochondrial cristae shape determines respiratory chain supercomplexes assembly and respiratory efficiency. Cell 155, 160–171 [DOI] [PMC free article] [PubMed] [Google Scholar]
- 38. Gomes L. C., Di Benedetto G., and Scorrano L. (2011) During autophagy mitochondria elongate, are spared from degradation and sustain cell viability. Nat. Cell Biol. 13, 589–598 [DOI] [PMC free article] [PubMed] [Google Scholar]
- 39. Appelqvist H., Wäster P., Kågedal K., and Öllinger K. (2013) The lysosome: from waste bag to potential therapeutic target. J. Mol. Cell. Biol. 5, 214–226 [DOI] [PubMed] [Google Scholar]
- 40. Perzov N., Padler-Karavani V., Nelson H., and Nelson N. (2002) Characterization of yeast V-ATPase mutants lacking Vph1p or Stv1p and the effect on endocytosis. J. Exp. Biol. 205, 1209–1219 [DOI] [PubMed] [Google Scholar]
- 41. Soubannier V., McLelland G. L., Zunino R., Braschi E., Rippstein P., Fon E. A., and McBride H. M. (2012) A vesicular transport pathway shuttles cargo from mitochondria to lysosomes. Curr. Biol. 22, 135–141 [DOI] [PubMed] [Google Scholar]
- 42. McLelland G. L., Soubannier V., Chen C. X., McBride H. M., and Fon E. A. (2014) Parkin and PINK1 function in a vesicular trafficking pathway regulating mitochondrial quality control. EMBO J. 33, 282–295 [DOI] [PMC free article] [PubMed] [Google Scholar]
- 43. Scarffe L. A., Stevens D. A., Dawson V. L., and Dawson T. M. (2014) Parkin and PINK1: much more than mitophagy. Trends Neurosci. 37, 315–324 [DOI] [PMC free article] [PubMed] [Google Scholar]
- 44. Amo T., Sato S., Saiki S., Wolf A. M., Toyomizu M., Gautier C. A., Shen J., Ohta S., and Hattori N. (2011) Mitochondrial membrane potential decrease caused by loss of PINK1 is not due to proton leak, but to respiratory chain defects. Neurobiol. Dis. 41, 111–118 [DOI] [PubMed] [Google Scholar]
- 45. Turk B., Dolenc I., Zerovnik E., Turk D., Gubensek F., and Turk V. (1994) Human cathepsin B is a metastable enzyme stabilized by specific ionic interactions associated with the active site. Biochemistry 33, 14800–14806 [DOI] [PubMed] [Google Scholar]
- 46. Kelso G. F., Porteous C. M., Coulter C. V., Hughes G., Porteous W. K., Ledgerwood E. C., Smith R. A., and Murphy M. P. (2001) Selective targeting of a redox-active ubiquinone to mitochondria within cells: antioxidant and antiapoptotic properties. J. Biol. Chem. 276, 4588–4596 [DOI] [PubMed] [Google Scholar]
- 47. Mailloux R. J., McBride S. L., and Harper M. E. (2013) Unearthing the secrets of mitochondrial ROS and glutathione in bioenergetics. Trends Biochem. Sci. 38, 592–602 [DOI] [PubMed] [Google Scholar]
- 48. Dröse S., and Brandt U. (2008) The mechanism of mitochondrial superoxide production by the cytochrome bc1 complex. J. Biol. Chem. 283, 21649–21654 [DOI] [PubMed] [Google Scholar]
- 49. Starkov A. A., and Fiskum G. (2001) Myxothiazol induces H2O2 production from mitochondrial respiratory chain. Biochem. Biophys. Res. Commun. 281, 645–650 [DOI] [PubMed] [Google Scholar]
- 50. Dodson M., Darley-Usmar V., and Zhang J. (2013) Cellular metabolic and autophagic pathways: traffic control by redox signaling. Free Radic. Biol. Med. 63, 207–221 [DOI] [PMC free article] [PubMed] [Google Scholar]
- 51. Baixauli F., Acín-Pérez R., Villarroya-Beltrí C., Mazzeo C., Nuñez-Andrade N., Gabandé-Rodriguez E., Ledesma M. D., Blázquez A., Martin M. A., Falcón-Pérez J. M., Redondo J. M., Enríquez J. A., and Mittelbrunn M. (2015) Mitochondrial respiration controls lysosomal function during inflammatory T cell responses. Cell Metab. 22, 485–498 [DOI] [PMC free article] [PubMed] [Google Scholar]
- 52. Morán M., Moreno-Lastres D., Marín-Buera L., Arenas J., Martín M. A., and Ugalde C. (2012) Mitochondrial respiratory chain dysfunction: implications in neurodegeneration. Free Radic. Biol. Med. 53, 595–609 [DOI] [PubMed] [Google Scholar]
- 53. Nunnari J., and Suomalainen A. (2012) Mitochondria: in sickness and in health. Cell 148, 1145–1159 [DOI] [PMC free article] [PubMed] [Google Scholar]
- 54. Oliveira J. M., Jekabsons M. B., Chen S., Lin A., Rego A. C., Gonçalves J., Ellerby L. M., and Nicholls D. G. (2007) Mitochondrial dysfunction in Huntington's disease: the bioenergetics of isolated and in situ mitochondria from transgenic mice. J. Neurochem. 101, 241–249 [DOI] [PubMed] [Google Scholar]
- 55. Martin L. J., Pan Y., Price A. C., Sterling W., Copeland N. G., Jenkins N. A., Price D. L., and Lee M. K. (2006) Parkinson's disease α-synuclein transgenic mice develop neuronal mitochondrial degeneration and cell death. J. Neurosci. 26, 41–50 [DOI] [PMC free article] [PubMed] [Google Scholar]
- 56. Settembre C., Fraldi A., Medina D. L., and Ballabio A. (2013) Signals from the lysosome: a control centre for cellular clearance and energy metabolism. Nat. Rev. Mol. Cell Biol. 14, 283–296 [DOI] [PMC free article] [PubMed] [Google Scholar]
- 57. Xie Y., Zhou B., Lin M. Y., Wang S., Foust K. D., and Sheng Z. H. (2015) Endolysosomal deficits augment mitochondria pathology in spinal motor neurons of asymptomatic fALS mice. Neuron 87, 355–370 [DOI] [PMC free article] [PubMed] [Google Scholar]
- 58. Koike M., Shibata M., Tadakoshi M., Gotoh K., Komatsu M., Waguri S., Kawahara N., Kuida K., Nagata S., Kominami E., Tanaka K., and Uchiyama Y. (2008) Inhibition of autophagy prevents hippocampal pyramidal neuron death after hypoxic-ischemic injury. Am. J. Pathol. 172, 454–469 [DOI] [PMC free article] [PubMed] [Google Scholar]
- 59. Finsterer J. (2011) Inherited mitochondrial neuropathies. J. Neurol. Sci. 304, 9–16 [DOI] [PubMed] [Google Scholar]
- 60. Gautier C. A., Kitada T., and Shen J. (2008) Loss of PINK1 causes mitochondrial functional defects and increased sensitivity to oxidative stress. Proc. Natl. Acad. Sci. U.S.A. 105, 11364–11369 [DOI] [PMC free article] [PubMed] [Google Scholar]
- 61. Morais V. A., Verstreken P., Roethig A., Smet J., Snellinx A., Vanbrabant M., Haddad D., Frezza C., Mandemakers W., Vogt-Weisenhorn D., Van Coster R., Wurst W., Scorrano L., and De Strooper B. (2009) Parkinson's disease mutations in PINK1 result in decreased Complex I activity and deficient synaptic function. EMBO Mol. Med. 1, 99–111 [DOI] [PMC free article] [PubMed] [Google Scholar]
- 62. Müftüoglu M., Elibol B., Dalmizrak O., Ercan A., Kulaksiz G., Ogüs H., Dalkara T., and Ozer N. (2004) Mitochondrial complex I and IV activities in leukocytes from patients with parkin mutations. Mov. Disord. 19, 544–548 [DOI] [PubMed] [Google Scholar]
- 63. Esteves A. R., Arduíno D. M., Swerdlow R. H., Oliveira C. R., and Cardoso S. M. (2009) Oxidative stress involvement in α-synuclein oligomerization in Parkinson's disease cybrids. Antioxid. Redox Signal. 11, 439–448 [DOI] [PubMed] [Google Scholar]
- 64. Karuppagounder S. S., Xu H., Shi Q., Chen L. H., Pedrini S., Pechman D., Baker H., Beal M. F., Gandy S. E., and Gibson G. E. (2009) Thiamine deficiency induces oxidative stress and exacerbates the plaque pathology in Alzheimer's mouse model. Neurobiol. Aging 30, 1587–1600 [DOI] [PMC free article] [PubMed] [Google Scholar]
- 65. Batelli S., Albani D., Rametta R., Polito L., Prato F., Pesaresi M., Negro A., and Forloni G. (2008) DJ-1 modulates α-synuclein aggregation state in a cellular model of oxidative stress: relevance for Parkinson's disease and involvement of HSP70. PLoS One 3, e1884. [DOI] [PMC free article] [PubMed] [Google Scholar] [Retracted]
- 66. Gustaw-Rothenberg K., Lerner A., Bonda D. J., Lee H. G., Zhu X., Perry G., and Smith M. A. (2010) Biomarkers in Alzheimer's disease: past, present and future. Biomark. Med. 4, 15–26 [DOI] [PMC free article] [PubMed] [Google Scholar]
- 67. Pagano G., Talamanca A. A., Castello G., Cordero M. D., d'Ischia M., Gadaleta M. N., Pallardó F. V., Petrović S., Tiano L., and Zatterale A. (2014) Oxidative stress and mitochondrial dysfunction across broad-ranging pathologies: toward mitochondria-targeted clinical strategies. Oxid. Med. Cell Longev. 2014, 541230. [DOI] [PMC free article] [PubMed] [Google Scholar]
- 68. Klein J. A., Longo-Guess C. M., Rossmann M. P., Seburn K. L., Hurd R. E., Frankel W. N., Bronson R. T., and Ackerman S. L. (2002) The harlequin mouse mutation downregulates apoptosis-inducing factor. Nature 419, 367–374 [DOI] [PubMed] [Google Scholar]