

Abstract
Background
The associations between overall lifestyle profile and cardiovascular disease (CVD) and death have been mainly investigated in cross‐sectional studies. The full benefits of a healthy lifestyle may therefore be underestimated, and the magnitude of benefits associated with changes in lifestyle remains unclear. We quantified the association of changes in lifestyle profiles over 5 years with risk of CVD and all‐cause mortality.
Methods and Results
Lifestyle factors (ie, diet, physical activity, smoking, alcohol consumption) and body mass index were assessed and dichotomized as healthy/unhealthy among 5263 adults ages 26 to 66 in 1993–1997 and 5 years later (1998–2002). Multivariable‐adjusted hazard ratios (HRs) and corresponding 95% confidence intervals (CIs) were estimated to quantify associations of change in lifestyle with fatal/nonfatal CVD and all‐cause mortality that occurred 8 to 15 years after 1998–2002. Independent of baseline lifestyles, each decrement in number of healthy lifestyle factors was, on average, associated with 35% higher risk of CVD (HR, 1.35; 95% CI, 1.12–1.63) and 37% higher risk of all‐cause mortality (HR, 1.37; 95% CI, 1.10–1.70); no association was noted with increase in the number of healthy lifestyle factors (P>0.5). Individuals who maintained 4 to 5 healthy lifestyle factors had 2.5 times lower risk of CVD (HR, 0.43; 95% CI, 0.25–0.63) and all‐cause mortality (HR, 0.40; 95% CI, 0.22–0.73) than those who maintained only 0 to 1 healthy lifestyle factor.
Conclusions
Our findings suggest that the benefits of healthy lifestyles may be easier lost than gained over a 5‐year period. This underscores the need for efforts to promote maintenance of healthy lifestyles throughout the life course.
Keywords: all‐cause death, cardiovascular disease, lifestyle
Subject Categories: Cardiovascular Disease, Epidemiology, Lifestyle
Introduction
Although it is well established that a healthy lifestyle is associated with a lower risk of cardiovascular disease (CVD) and premature mortality,1, 2, 3, 4, 5, 6, 7, 8, 9 only a small fraction of the adult population has a healthy lifestyle.6, 10 Adhering to a healthy diet, being physically active, no smoking, drinking alcohol in moderation, and having a normal weight are important factors in preventing CVD and premature mortality.11, 12 The few studies that focused on overall lifestyle profiles (ie, combination of lifestyle factors) showed that adherence to a higher number of healthy lifestyle factors, measured at a single point in time, was associated with lower risk of CVD and all‐cause mortality.1, 2, 3, 4, 5, 6, 7, 8, 9 However, whereas lifestyle habits tend to change over time,10, 13, 14, 15 little is known about the magnitude of health effects associated with changes in overall lifestyle profile over time. In addition, the long‐term benefits of a healthy lifestyle profile can only become apparent when looking at lifestyles that are maintained over time. Quantifying the extent to which maintenance of, and changes in, lifestyles in young adulthood and middle age alter risk of CVD and premature mortality can provide insight on the potential effects of population‐level lifestyle modification and may serve as an incentive for adults to adopt and maintain an overall healthy lifestyle.
A study from the United States indicated that adults with unhealthy lifestyles who subsequently adopted healthier lifestyles had a 35% lower risk of CVD and a 40% lower risk of all‐cause mortality over 4 years compared to those who maintained unhealthy lifestyles.13 The Coronary Artery Risk Development in Young Adults study also showed that healthy or unhealthy changes in lifestyle over a 20‐year period were associated with lower or higher risk, respectively, of coronary artery calcification and carotid intima‐media thickness.16 However, both studies were conducted in U.S. populations and did not investigate the benefits of maintaining healthy lifestyles,13, 16 only broadly compared changes in lifestyle profiles (4 healthy lifestyle factors versus less than 4),13 or were limited to intermediate endpoints of CVD (eg, coronary artery calcification) instead of CVD and all‐cause mortality.16 Therefore, we examined maintenance of, and changes in, overall lifestyle profiles over 5 years in a large, prospective cohort and investigated the association of these profiles with subsequent CVD and all‐cause mortality risk over 8 to 15 years of follow‐up.
Methods
Study Population
The Doetinchem Cohort Study is an ongoing study that started in 1987–1991 with an age‐ and sex‐stratified random sample of men and women ages 20 to 59 years living in Doetinchem, a provincial town in The Netherlands. Those who participated in 1987–1991 (N=7768; participation rate, 62%) were reinvited for a second examination in 1993–1997 (wave 2, N=6117; participation rate, 79%) and a third examination in 1998–2002 (wave 3, N=4918; participation rate, 75%). Details of the study design have been described elsewhere.17 Diet and physical activity were assessed from wave 2 onward. Therefore, the second examination wave was considered as baseline for the present analyses. We excluded 854 participants because of: prevalent CVD or cancer at waves 2 or 3 based on hospital discharge data and self‐report (N=676); lack of informed consent for linkage with Statistics Netherlands or the Dutch Hospital Discharge Registry (N=156); censoring before wave 3 (N=8); and lack of follow‐up information on vital status or on CVD (N=14). Thus, these analyses are based on data from 5263 participants (2416 men; 2847 women). All participants gave written informed consent and the study was approved according to the guidelines of the Helsinki Declaration by the Netherlands Organization for Applied Scientific Research.
Measures
At each examination, participants underwent a physical examination, and information on demographic characteristics, lifestyle, and medical history was obtained by self‐administered questionnaires. We investigated 4 lifestyle factors (diet, physical activity, cigarette smoking, and alcohol consumption) and body mass index (BMI), using similar methods to define healthy lifestyle as in previous studies.3, 4, 5, 7, 8, 9, 13, 18 Dietary intake was assessed using a validated 178‐item semiquantitative food frequency questionnaire.19, 20 A healthy diet was operationalized with the modified Mediterranean Diet Score (MDS) as described by Trichopoulou et al.21 This score assigned values of 0 to 1 to each of the following 9 nutritional components: alcohol, vegetables, fruits, legumes and nuts, grains, fish and seafood, meat products, unsaturated to saturated fatty acid ratio, and dairy products. Intakes equal to or above the sex‐specific median in the study population were assigned a value of 1 and intakes below that median a value of 0. For dairy and meat products, the scoring was inverted, because the traditional Mediterranean diet is characterized by low dairy and meat intake. Similar to other studies,4, 5, 8, 9 alcohol consumption was included separately in the analysis and was therefore not included in the MDS. Thus, the MDS ranged from zero (minimal adherence) to 8 (maximal adherence). Physical activity was assessed with a validated questionnaire developed for the European Prospective Investigation into Cancer and Nutrition (EPIC). For the Doetinchem study, the questionnaire was extended with 2 open‐ended questions on the type, frequency, and duration of sports per week.22 Sports, cycling, housekeeping, gardening, and jobs that require heavy physical work were assessed as the number of hours per week, separately for summer and winter. The smallest number of hours per week reported for either summer or winter was used to ensure a conservative estimate. Hours per week spent on the various physical activities were summed. Only physical activities with a Metabolic Equivalent of Task value of 4.0 or higher as reported by Ainsworth et al. were included,23 which is in line with the Dutch physical activity guidelines.24 Body weight was measured to the nearest 0.1 kg on calibrated scales, and 1 kg was subtracted to adjust for clothing. Height was measured to the nearest 0.5 cm. BMI was calculated as weight in kilograms divided by height in meters squared (kg/m2).
Definition of Lifestyle Profiles
Each lifestyle factor was defined as a dichotomous variable, with healthy and unhealthy states. Similar to other studies,2, 3, 4, 13, 18 lifestyle factors were classified as healthy as follows: healthy diet, MDS ≥5, healthy physical activity level: ≥3.5 hours per week spent on physical activities; not currently smoking; BMI lower than 30 kg/m2; and moderate alcohol consumption, that is, between 1 drink (ie, 10 g of alcohol/glass) per month and 2 drinks per day for men, and between 1 drink per month and 1 drink per day for women.25
Healthy lifestyle factor score
The number of healthy lifestyle factors present was summed to compute an aggregate healthy lifestyle factor score ranging from 0 (none) to 5 (all), at both baseline and at the 5‐year follow‐up wave. A change score was constructed by subtracting healthy lifestyle factor score at baseline from the score at the 5‐year follow‐up wave (observed range, −4 to 4).
Lifestyle profiles
To examine the associations of maintenance of, and changes in, lifestyles, seven 5‐year lifestyle profiles were constructed (Figure 1). Both for baseline and for the 5‐year follow‐up wave, participants were categorized into 1 of 3 lifestyle categories based on the healthy lifestyle factor scores as: unhealthy: score 0 to 1; moderately healthy: score 2 to 3; and healthy: score 4 to 5. Participants could remain in the same lifestyle category in which they started at baseline or could adopt a more healthy or unhealthy lifestyle over the 5‐year period.
Figure 1.
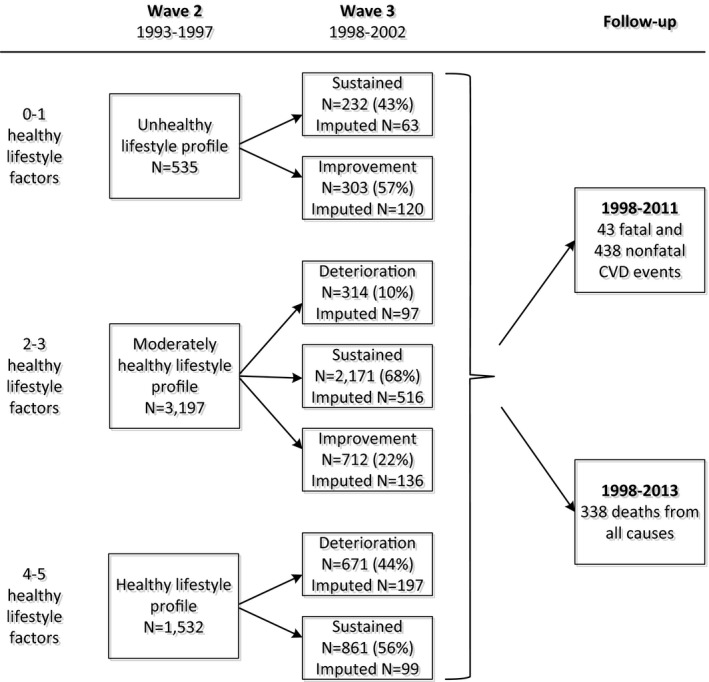
Overview of baseline and 5‐year lifestyle profiles. The number of participants in each lifestyle profile represents the average number of participants of the 20 imputed data sets. The categories do not add up to 5263 because of rounding. CVD indicates cardiovascular disease.
Covariates
Highest educational level achieved was categorized as low (lower vocational training or primary school, ie, <10 years education), medium (secondary school and intermediate vocational training, ie, 11–14 years education), or high (higher vocational training or university, ie, >15 years education). Employment status was categorized as currently employed, homemaker, or unemployed/retired/unfit for work. At each examination wave, systolic (SBP) and diastolic blood pressure (DBP) were measured with a random zero sphygmomanometer (Hawksley and Sons, Lancing, UK). Blood pressure was measured twice after 2 minutes of rest with participants in a seated position. SBP was recorded at the appearance of sounds (first‐phase Korotkoff), and DBP was recorded at the disappearance of sounds (fifth‐phase Korotkoff). The mean value of these 2 measurements was used for analyses. Hypertension was defined as an SBP ≥140 mm Hg, DBP ≥90 mm Hg, and/or using blood pressure–lowering medication. Total cholesterol (TC) and high‐density lipoprotein (HDL) cholesterol (HDL‐c) were measured until 1998 in nonfasting EDTA plasma and from 1998 onward in serum at the Lipid Reference Laboratory, using standardized enzymatic methods. The TC/HDL ratio was calculated by dividing the TC level by the HDL‐c level. Hypercholesterolemia was defined as having a TC/HDL ratio ≥6.0 and/or taking cholesterol‐lowering medication. Diabetes was defined based on self‐reported history and/or nonfasting blood glucose concentration of 11.1 mmol/L or more.26 Ninety percent of the cases were also verified using information from the participant's general practitioner or pharmacist.27 Of the verified self‐reported cases, 13 had type 1 diabetes, 5 an unknown/other type, and 4 did not have diabetes and were classified as being free of type 2 diabetes.
Outcome
Nonfatal and fatal cardiovascular events that occurred after the 5‐year follow‐up wave were ascertained until January 1, 2011. In order to evaluate all‐cause mortality, vital status was verified until June 1, 2013, using the municipal population register. Cause of death was ascertained through linkage with Statistics Netherlands, and morbidity data were obtained through probabilistic linkage with the Dutch Hospital Discharge Registry. In The Netherlands, 88% of hospital admissions can uniquely be linked to an individual based on date of birth, sex, and postal code.28 We defined fatal CVD cases (where CVD was the primary or secondary cause of death) and non‐fatal CVD cases according to International Classification of Diseases, Ninth Revision (ICD‐9)29 codes 410–414, 415.1, 427.5, 428, 430–438, 440 to 442, 443.9, 444, 798.1, 798.2, 798.9, and corresponding ICD, Tenth Revision (ICD‐10) codes.30
Statistical Analyses
Of the study population, 0.4% had some missing data on lifestyle or covariates at baseline and 22.7% had some missing exposure data mainly attributable to nonresponse at the 5‐year follow‐up wave. Exclusion of participants with missing data may lead to biased results and loss of precision.31, 32 Therefore, missing values for all determinants and covariates were multiple‐imputed using the multivariate imputation by chained equations method in the statistical program R (version 3.1.0; R Foundation for Statistical Computing, Vienna, Austria).33, 34
Age‐ and sex‐adjusted event rates per 10 000 person‐years of follow‐up were estimated for the 5‐year lifestyle profiles. Hazard ratios (HRs) and corresponding 95% confidence intervals (CIs) from Cox proportional hazards regression were used to assess associations of changes in single lifestyle factors, healthy lifestyle factor change scores, and lifestyle profiles (unhealthy lifestyle as reference) with CVD and all‐cause mortality. Analyses of the healthy lifestyle factor change score were stratified by improvement (score 0–4) and deterioration (score 0 to −4), with the stable lifestyle as reference in both scores. The latter score was inverted. These analyses were also performed using an aggregate weighted healthy lifestyle score (range, 0–5), which allocated points for each lifestyle factor based on their strength of associations with outcomes.
All analyses were adjusted for baseline age, sex, highest educational level achieved during follow‐up, and employment status in model 1. To investigate whether associations of lifestyle with outcomes were independent from intermediate metabolic risk factors, analyses were additionally adjusted for hypertension, hypercholesterolemia, and diabetes in model 2. To also take into account change over the 5‐year period for intermediate variables, the additional variables in model 2 had 4 categories (eg, hypertension at both waves of data collection, no hypertension at both waves and change from nonhypertensive to hypertensive, or vice versa). Healthy lifestyle factor change scores were additionally adjusted for baseline healthy lifestyle factor score in both models. Interaction terms between the determinants of interest and follow‐up time were not statistically significant (P>0.15), indicating that the proportional hazards assumption was not violated. Results for men and women were similar (P values for interaction with sex >0.10). In sensitivity analyses, all analyses were performed using complete data only. All analyses were performed using SAS software (version 9.3; SAS Institute Inc., Cary, NC), and a 2‐sided P value <0.05 was considered statistically significant.
Results
Participants were, on average, 46 (SD, 10) years of age at baseline and 46% were male (Table 1). At baseline, 29% of the participants had a healthy lifestyle, 61% a moderately healthy lifestyle, and 10% an unhealthy lifestyle. Participants with a healthy lifestyle were more likely to have a higher educational level and to be currently employed, and tended to have more‐favorable levels of the major biological CVD risk factors compared to those with less‐healthy lifestyles (Table 1). Over the 5‐year follow‐up period, 62% of the participants maintained the same lifestyle profile, whereas 19% improved their lifestyles and 19% adopted unhealthier lifestyles (Figure 1). Improvement or deterioration was more likely to be observed in diet score, physical activity, and alcohol consumption than in smoking status or BMI (Table 2). During an average of 9.8 years of follow‐up, 481 CVD events occurred; there were 338 deaths after 12.2 years of follow‐up.
Table 1.
Baseline Characteristics of the Doetinchem Cohort Study (1993–1997) According to Baseline Lifestyle Profilesa
| Total Population | Healthy Lifestyle Profile | Moderately Healthy Lifestyle Profile | Unhealthy Lifestyle Profile | |
|---|---|---|---|---|
| N=5263 | N=1532b | N=3197b | N=535b | |
| Age (y), mean (SD) | 45.7 (9.9) | 45.7 (9.6) | 45.7 (10.0) | 46.4 (9.9) |
| Women, n (%) | 2847 (54) | 719 (47) | 1819 (57) | 309 (58) |
| Low educational attainment, n (%) | 2633 (50) | 617 (40) | 1670 (52) | 345 (65) |
| SBP (mm Hg), mean (SD) | 125 (16) | 124 (16) | 124 (16) | 127 (18) |
| DBP (mm Hg), mean (SD) | 80 (11) | 79 (10) | 80 (11) | 81 (11) |
| TC (mmol/L), mean (SD) | 5.5 (1.0) | 5.4 (1.0) | 5.5 (1.0) | 5.6 (1.0) |
| HDL‐c (mmol/L), mean (SD) | 1.38 (0.37) | 1.42 (0.37) | 1.38 (0.38) | 1.27 (0.36) |
| BMI (kg/m2), mean (SD) | 25.7 (3.7) | 24.9 (2.6) | 25.8 (3.8) | 27.8 (5.1) |
| Type 2 diabetes mellitusc, n (%) | 65 (1.2) | 11 (0.7) | 43 (1.3) | 12 (2.3) |
| Healthy lifestyle factors | ||||
| BMI <30 kg/m2 (%) | 4639 (88) | 1508 (98) | 2810 (88) | 321 (60) |
| Healthy diet MDS ≥5 (%) | 1987 (38) | 1128 (74) | 843 (26) | 16 (3) |
| Physical active ≥3.5 h/week (%) | 2983 (57) | 1340 (87) | 1600 (50) | 43 (8) |
| Not smoking (%) | 3660 (70) | 1439 (94) | 2118 (66) | 103 (19) |
| Moderate alcohol consumption (%) | 1891 (36) | 1048 (68) | 829 (26) | 14 (3) |
BMI indicates body mass index; DBP, diastolic blood pressure; HDL‐c, HDL‐cholesterol; MDS, Mediterranean Diet Score; SBP, systolic blood pressure; TC, total cholesterol.
Healthy lifestyle profile was defined as having 4 to 5 of the following healthy lifestyle factors: Mediterranean Diet Score ≥5, ≥3.5 hours per week spent on moderate‐to‐vigorous intensity physical activities, not currently smoking, moderate alcohol consumption, and a BMI lower than 30 kg/m2. Participants with a moderately healthy lifestyle profile adhered to 2 to 3 healthy lifestyle factors and participants with an unhealthy lifestyle profile to one or less factors.
Represents the average number of participants of the 20 imputed data sets. The categories do not add up to 5263 because of rounding.
Self‐reported diabetes and/or non‐fasting blood glucose concentration ≥11.1 mmol/L.
Table 2.
Means of Each Lifestyle Factor for Participants Who Maintained the Same, Improved, or Deteriorated in That Lifestyle Factor
| Sustained Healtha | Deteriorated Healthya | Improved Unhealthya | Sustained Unhealthya | |
|---|---|---|---|---|
| N≥1282 | N≥126 | N≥74 | N≥549 | |
| Body mass index | <30 kg/m2 at both waves | <30 kg/m2 at baseline and ≥30 kg/m2 at 5‐year follow‐up | ≥30 kg/m2 at baseline and <30 kg/m2 at 5‐year follow‐up | ≥30 kg/m2 at both waves |
| N (%) | 4318 (82) | 321 (6) | 74 (1) | 549 (10) |
| Mean (SD) at baseline | 24.5 (2.5) kg/m2 | 28.6 (1.1) kg/m2 | 31.0 (0.9) kg/m2 | 33.1 (3.0) kg/m2 |
| Mean (SD) at 5‐year follow‐up | 25.2 (2.6) kg/m2 | 31.3 (1.2) kg/m2 | 28.6 (1.3) kg/m2 | 34.1 (3.2) kg/m2 |
| Smoking | Not smoking at both waves | Not smoking at baseline and smoking at 5‐year follow‐up | Smoking at baseline and not smoking at 5‐year follow‐up | Smoking at both waves |
| N (%) | 3533 (67) | 126 (2) | 297 (6) | 1306 (25) |
| Mediterranean diet score | ≥5 at both waves | ≥5 at baseline and <5 at 5‐year follow‐up | <5 at baseline and ≥5 at 5‐year follow‐up | <5 at both waves |
| N (%) | 1218 (23) | 768 (15) | 999 (19) | 2278 (43) |
| Mean (SD) at baseline | 5.7 (0.8) | 5.4 (0.7) | 3.4 (0.9) | 2.9 (1.0) |
| Mean (SD) at 5‐year follow‐up | 5.7 (1.0) | 3.5 (1.0) | 5.3 (0.9) | 3.0 (1.1) |
| Physical activity | ≥3.5 h/week at both waves | ≥3.5 h/week at baseline and <3.5 h/week at 5‐year follow‐up | <3.5 h/week at baseline and ≥3.5 h/week at 5‐year follow‐up | <3.5 h/week at both waves |
| N (%) | 1910 (36) | 1073 (20) | 864 (16) | 1416 (27) |
| Mean (SD) at baseline | 12.0 (13.2) h/week | 10.0 (11.3) h/week | 1.8 (1.1) h/week | 1.4 (1.1) h/week |
| Mean (SD) at 5‐year follow‐up | 11.6 (12.5) h/week | 1.6 (1.2) h/week | 8.9 (9.6) h/week | 1.4 (1.1) h/week |
| Alcohol consumption | At both waves moderately | Moderately at baseline and not moderately at 5‐year follow‐up | Not moderately at baseline and moderately at 5‐year follow‐up | Not moderately at both waves |
| N (%) | 1282 (24) | 623 (12) | 768 (14) | 2634 (50) |
| Median (IQR) at baseline | 0.7 (0.6–1.1) glasses/day | 0.8 (0.4–1.0) glasses/day | 0.0 (0.0–2.1) glasses/day | 0.0 (0.0–2.3) glasses/day |
| Median (IQR) at 5‐year follow‐up | 0.9 (0.6–1.1) glasses/day | 1.1 (0.0–2.1) glasses/day | 0.7 (0.4–1.1) glasses/day | 0.0 (0.0–2.3) glasses/day |
IQR indicates interquartile range.
The number of participants in each category differs per lifestyle factor.
Change in Individual Lifestyle Factors and Risk of CVD and All‐Cause Mortality
For most individual lifestyle factors, improvement and deterioration over 5 years tended to be associated with lower and higher risk, respectively, of CVD and all‐cause mortality, although associations were not statistically significant (Table 3). For example, change from being obese to overweight/normal weight was (not statistically significantly) associated with a 48% lower risk of CVD (HR, 0.52; 95% CI, 0.21–1.31) compared to staying obese over time. Similarly, change from a healthy weight to being obese was (not statistically significantly) associated with a 34% higher risk of CVD (HR, 1.34; 95% CI, 0.92–1.94) compared to maintaining a healthy weight.
Table 3.
HRs and 95% CIs for the Associations Between Change in Single Lifestyle Factors and Cardiovascular Disease and All‐Cause Mortality
| HR and 95% CI of Fatal and Nonfatal Cardiovascular Disease | HR and 95% CI of All‐Cause Mortality | |||
|---|---|---|---|---|
| Improveda | Deteriorateda | Improved | Deteriorated | |
| Body mass index | ||||
| Model 1b | 0.52 (0.21–1.31) | 1.34 (0.92–1.94) | 0.83 (0.31–2.22) | 1.14 (0.74–1.77) |
| Model 2c | 0.52 (0.09–3.04) | 1.59 (0.94–2.68) | 1.24 (0.37–4.20) | 1.00 (0.48–2.06) |
| Smoking | ||||
| Model 1b | 0.71 (0.45–1.11) | 1.56 (0.81–3.02) | 0.78 (0.47–1.28) | 0.83 (0.21–3.21) |
| Model 2c | 0.76 (0.44–1.32) | 1.50 (0.57–3.95) | 0.73 (0.37–1.46) | 0.73 (0.11–4.71) |
| Physical activity | ||||
| Model 1b | 0.86 (0.67–1.11) | 1.17 (0.88–1.56) | 0.87 (0.58–1.35) | 1.31 (0.95–1.82) |
| Model 2c | 1.05 (0.72–1.54) | 1.03 (0.74–1.45) | 1.04 (0.63–1.71) | 1.42 (0.96–2.11) |
| Mediterranean Diet Score | ||||
| Model 1b | 1.01 (0.77–1.31) | 1.14 (0.80–1.62) | 0.93 (0.66–1.32) | 1.37 (0.90–2.08) |
| Model 2c | 1.17 (0.84–1.61) | 1.16 (0.75–1.79) | 1.09 (0.73–1.63) | 1.19 (0.72–1.96) |
| Alcohol consumption | ||||
| Model 1b | 0.82 (0.59–1.13) | 1.19 (0.85–1.68) | 0.93 (0.65–1.32) | 1.11 (0.73–1.71) |
| Model 2c | 0.75 (0.50–1.13) | 1.32 (0.85–2.05) | 0.96 (0.60–1.53) | 1.10 (0.63–1.93) |
CI indicates confidence interval; HR, hazard ratio.
Change in single healthy lifestyle factors from unhealthy to healthy (improved) or vice versa (deteriorated) over a 5‐year period.
Cox proportional hazard models adjusted for age, sex, educational level, and occupation.
Analyses additionally adjusted for (other) lifestyle factors.
Changes in the Number of Healthy Lifestyle Factors and Risk of CVD and All‐Cause Mortality
Regardless of the number of healthy lifestyle factors at baseline, each healthy lifestyle factor lost during follow‐up was associated with a 35% higher risk of CVD (HR, 1.35; 95% CI, 1.12–1.63) and a 37% higher risk of all‐cause mortality (HR, 1.37; 95% CI, 1.10–1.70; Table 4). Improvement in lifestyle was not associated with risk of CVD (HR, 0.95; 95% CI, 0.80–1.14) and all‐cause mortality (HR, 0.96; 95% CI, 0.76–1.21). Analyses using the weighted scores gave virtually the same results as those based on unweighted scores (Table 4). Further adjustment for presence of diabetes, hypertension, and hypercholesterolemia at baseline or the 5‐year follow‐up wave only slightly attenuated the associations for all analyses.
Table 4.
HRs and 95% CIs for the Associations Between the Healthy Lifestyle Factor Change Scores and Cardiovascular Disease and All‐Cause Mortality
| HR and 95% CI of Fatal and Nonfatal Cardiovascular Disease | HR and 95% CI of All‐Cause Mortality | |||
|---|---|---|---|---|
| Improved | Deteriorated | Improved | Deteriorated | |
| HLF change scorea | ||||
| Model 1b | 0.95 (0.80–1.14) | 1.35 (1.12–1.63) | 0.96 (0.76–1.21) | 1.37 (1.10–1.70) |
| Model 2c | 0.96 (0.81–1.15) | 1.31 (1.08–1.58) | 0.98 (0.77–1.24) | 1.36 (1.09–1.69) |
| Weighted HLF change scored | ||||
| Model 1b | 0.88 (0.70–1.10) | 1.27 (1.05–1.54) | 0.94 (0.74–1.20) | 1.41 (1.13–1.76) |
| Model 2c | 0.88 (0.70–1.10) | 1.22 (1.00–1.48) | 0.96 (0.75–1.23) | 1.40 (1.12–1.76) |
CI indicates confidence interval; HLF, healthy lifestyle factor; HR, hazard ratio.
Change in risk for each healthy lifestyle factor gained (improved) or lost (deteriorated) over a 5‐year period.
Cox proportional hazard models adjusted for age, sex, educational level, occupation, and the number healthy lifestyle factors at baseline.
Analyses additionally adjusted for hypertension, hypercholesterolemia, and diabetes.
Change in risk for each point gained (improved) or lost (deteriorated) in aggregate weighted healthy lifestyle score between baseline and the 5‐year follow‐up wave. This score was based on the strength of associations between each individual lifestyle factor and outcomes.
Associations of Baseline and 5‐Year Lifestyle Profiles With Outcomes
Participants who maintained a healthy lifestyle profile over the 5‐year period had a 57% lower risk of CVD (HR, 0.43; 95% CI, 0.26–0.70) and a 60% lower risk of all‐cause mortality (HR, 0.40; 95% CI, 0.22–0.73) compared to those who maintained an unhealthy lifestyle (Figure 2; and Table 5). We compared the risks of improvement and deterioration in each lifestyle category (healthy, moderately healthy, and unhealthy) with maintenance of the same lifestyle profile (Figure 2; Table 5). Improvement resulted in similar or only slightly lower HRs for CVD and all‐cause mortality and deterioration in higher HRs. The HR for CVD and all‐cause mortality was lower for those with a sustained healthy lifestyle (HR, 0.43 and 0.40) compared to those with healthy lifestyles at baseline who changed to an unhealthy lifestyle over the 5‐year period (HR, 0.56; 95% CI, 0.36–0.87 and HR, 0.54; 95% CI, 0.31–0.97, respectively). On the other hand, HRs for CVD (HR, 0.97; 95% CI, 0.56–1.66) and all‐cause mortality (HR, 0.98; 95% CI, 0.49–1.95) were similar for those with an unhealthy lifestyle at baseline who improved over 5 years compared to those who maintained an unhealthy lifestyle profile (HR, 1.00).
Figure 2.
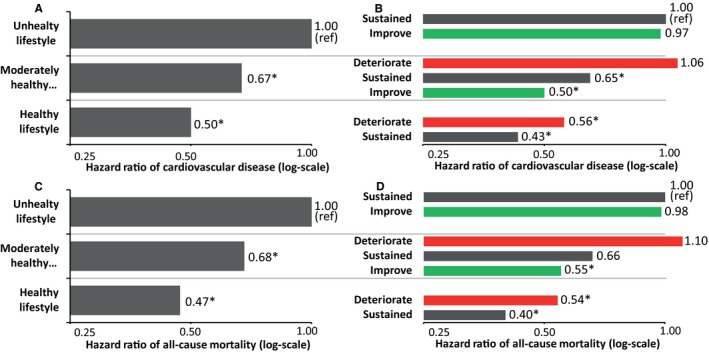
Multivariable adjusted hazard ratios of incident total cardiovascular disease (A and B) and all‐cause mortality (C and D). For baseline lifestyle profiles (A and C)† and 5‐year lifestyle profiles (B and D) including adults who maintained that same lifestyle profile (gray)‡, improved (green)§, or deteriorated (red)║ during 5‐year follow‐up. *Statistically significant different from (sustained) unhealthy lifestyle profile, P<0.05. †Healthy lifestyle profile was defined as having 4 to 5 of the following healthy lifestyle factor: Mediterranean Diet Score ≥5, ≥3.5 hours per week spent on moderate‐to‐vigorous intensity physical activities, not currently smoking, moderate alcohol consumption, and a body mass index lower than 30 kg/m2. Participants with moderately healthy lifestyle profile adhered to 2 to 3 healthy lifestyle factors and participants with an unhealthy lifestyle profile to 1 or less factors. ‡Sustained: lifestyle profile remains steady over 5 years. §Improve: lifestyle profile improved over 5 years. ║Deteriorate: lifestyle profile deteriorated over 5 years.
Table 5.
Hazard Ratio and 95% Confidence Interval of Cardiovascular Disease Events and All‐Cause Mortality in 5‐Year Lifestyle Profiles Compared to Sustained Unhealthy Lifestyle Profile
| Baseline | Healthy Lifestyle Profilea | Moderately Healthy Lifestyle Profilea | Unhealthy Lifestyle Profilea | ||||
|---|---|---|---|---|---|---|---|
| 5‐Year Follow‐up | Sustained | Deteriorate | Improve | Sustained | Deteriorate | Improve | Sustained |
| Fatal and nonfatal cardiovascular disease | |||||||
| Person‐years of follow‐up (no. of events) | 8537 (56) | 6732 (55) | 7146 (52) | 21 492 (199) | 3064 (44) | 2875 (42) | 2201 (52) |
| Age‐ and sex‐adjusted event rate (/10 000 person‐years) | 48 | 66 | 59 | 77 | 131 | 118 | 121 |
| Hazard ratio (95% confidence interval)b | 0.43 (0.26–0.70) | 0.56 (0.35–0.92) | 0.50 (0.30–0.83) | 0.65 (0.43–0.98) | 1.06 (0.63–1.78) | 0.97 (0.56–1.66) | 1.00 (reference) |
| Hazard ratio (95% confidence interval)c | 0.50 (0.31–0.81) | 0.63 (0.38–1.02) | 0.56 (0.37–0.94) | 0.70 (0.46–1.06) | 1.10 (0.65–1.86) | 1.00 (0.58–1.71) | 1.00 (reference) |
| All‐cause mortality | |||||||
| Person‐years of follow‐up (no. of events) | 10 610 (35) | 8287 (36) | 8834 (41) | 26 499 (142) | 3762 (31) | 3616 (31) | 2750 (22) |
| Age‐ and sex‐adjusted event rate (/10 000 person‐years) | 21 | 29 | 29 | 36 | 60 | 53 | 54 |
| Hazard ratio (95% confidence interval)b | 0.40 (0.22–0.73) | 0.54 (0.31–0.97) | 0.55 (0.31–0.97) | 0.66 (0.39–1.10) | 1.10 (0.60–2.02) | 0.98 (0.49–1.95) | 1.00 (reference) |
| Hazard ratio (95% confidence interval)c | 0.45 (0.24–0.83) | 0.60 (0.33–1.07) | 0.60 (0.33–1.08) | 0.70 (0.41–1.17) | 1.16 (0.62–2.14) | 1.03 (0.51–2.06) | 1.00 (reference) |
Healthy lifestyle profile was defined as having 4 to 5 of the following healthy lifestyle factors: Mediterranean Diet Score ≥5, ≥3.5 hours per week spent on moderate‐to‐vigorous intensity physical activities, not currently smoking, moderate alcohol consumption, and a body mass index lower than 30 kg/m2. Participants with a moderately healthy lifestyle profile adhered to 2 to 3 healthy lifestyle factors and participants with an unhealthy lifestyle profile to 1 or less factors.
Model 1: adjusted for age, sex, educational attainment, and employment status.
Model 2: model 1+adjusted for hypertension, hypercholesterolemia, and diabetes.
Sensitivity Analysis
The complete case analysis returned similar results as the results based on multiple imputed data.
Discussion
The current study found that deterioration of lifestyle habits over 5 years were associated with a higher risk of CVD and all‐cause mortality independent of baseline lifestyle status, whereas improvement in lifestyle was not statistically significantly related to these outcomes. Each healthy lifestyle factor lost over time resulted, on average, in a one‐third higher risk of CVD and all‐cause mortality over the subsequent 8 to 15 years. Furthermore, compared to those who maintained an unhealthy lifestyle, adults who maintained a healthy lifestyle over 5 years had a 57% to 60% lower risk of CVD and all‐cause mortality, whereas adults with a healthy lifestyle at baseline who turned to a less‐healthy lifestyle had only a 44% to 46% lower risk of CVD and all‐cause mortality.
Our findings of the association of baseline lifestyle profiles with risk of CVD and all‐cause mortality are consistent with previous studies, which reported that healthy lifestyles were associated with 46% to 68% lower risk for CVD1, 3, 4, 7, 8 and 32% to 87% lower risk for all‐cause mortality,3, 6 compared to unhealthy lifestyles. However, these previous studies did not examine changes in lifestyle over time. In our study, 38% of the adults changed their lifestyle over a period of 5 years, which is in line with an earlier study in The Netherlands investigating the stability of lifestyle behavior.15 The fact that such a large proportion of adults changed their behavior over time underscores the importance of quantifying the impact of changes in lifestyle on risk of CVD and all‐cause mortality in a healthy young adult/middle‐aged population, especially when considering the fact that many epidemiological studies only take into account baseline lifestyle profiles.
King et al. reported that among adults ages 45 to 64 years, improvement from <4 to 4 healthy lifestyle factors over a 4‐year period was associated with a lower risk of CVD and death over the subsequent 4 years.13 In contrast, although a strong graded association was observed between baseline lifestyle profiles and CVD and all‐cause mortality in the current study, improvement in lifestyle was, contrary to our expectations, not associated with these outcomes. Whereas significant associations of baseline physical activity35 and the MDS36 with incident CVD have been previously reported in the MORGEN and EPIC‐NL studies, respectively (of which the Doetinchem Cohort Study was a part), the current analyses showed that improvement in physical activity and the MDS over a 5‐year period were not associated with risk reduction. The absence of such associations and the fact that changes from unhealthy to healthy were most often attributable to changes in physical activity and the MDS likely contributed to the absence of associations of improvement in overall lifestyle with CVD and death. The absence of associations was likely not attributable to the magnitude of changes, given that improvements were substantial, that is, participants increased their amount of physical activity, on average, by 7.1 hours/week and their MDS by 1.9 units over the 5‐year follow‐up period.
In addition, improvement in obesity status was not significantly associated with CVD and all‐cause mortality, most likely attributable to the limited number of people who improved in obesity status (N=74). This may also have contributed to the absence of statistically significant associations between improvement in overall lifestyle and CVD and death. Reverse causation does not appear to explain the absence of associations because exclusion of events in the first 2 years of follow‐up did not change risk estimates (data not shown). Lifelong unhealthy lifestyles up to young adulthood/middle age may have resulted in damage that cannot be compensated by lifestyle improvements over a period as short as 5 years. However, we did not have information on lifestyle history before the 5‐year period, and thus it was not possible to determine whether absence of associations could be explained by lifelong unhealthy lifestyles. Finally, we cannot exclude the possibility that improvement in lifestyle over a 5‐year period has a very small impact on CVD and mortality risks, which requires a larger sample size to demonstrate.
Our results indicate that more effort is needed to increase the proportion of young/middle‐aged adults who maintain a healthy lifestyle given that each healthy lifestyle factor lost over just a 5‐year period resulted, on average, in a one‐third higher risk of CVD and all‐cause mortality. We also showed that maintaining an overall healthy lifestyle was associated with the lowest risk of CVD and all‐cause mortality (ie, a 57%–60% lower risk), compared to those with an unhealthy lifestyle. Whereas prevention and control of CVD has traditionally focused primarily on those with high CVD risk profiles and/or unhealthy lifestyles, our findings indicate that attention is needed to maintenance of healthy lifestyles given that lifestyle habits of many adults deteriorate over time with a sizeable impact on their CVD and mortality risk.
We previously demonstrated that maintenance of a low CVD risk profile based on major CVD risk factors (ideal levels of blood pressure, cholesterol, BMI, no smoking, and no diabetes) was associated with 7 times lower risk of CVD compared to having long‐term high‐risk profile.37 Our findings also suggested that improvement and deterioration in CVD risk profile resulted in 2‐fold lower and higher risk of subsequent CVD incidence, respectively. Risk differences associated with changes in lifestyle profile observed in the present study were smaller, which was to be expected given that lifestyle factors are more‐distal risk factors. However, the current analyses indicate that deterioration in lifestyle directly influence risk of CVD and all‐cause mortality independent of major CVD risk factors, such as hypertension, hypercholesterolemia, or diabetes, given that adjustment for these factors only slightly altered risk estimates.
This study has several strengths, including the prospective design, high participation rate, long follow‐up period, and extensive information about lifestyle and risk factors. Some limitations include the small number of participants with zero healthy lifestyle factors in the unhealthy lifestyle profile group (ie, most participants in this group had 1 healthy lifestyle factor). The exclusion of participants who had a CVD event and/or cancer between baseline and the 5‐year follow‐up wave (N=332) further mitigated the true difference between the healthy and unhealthy groups, which may have resulted in somewhat conservative estimates. Furthermore, we have no data on cycling in lifestyle profile during the 5‐year period. Cycling might have occurred in part of the population, and particularly weight cycling may have led to some underestimation of the associations of improvement and deterioration in lifestyle with outcomes. In addition, we used the MDS because this has commonly been used in previous cardiovascular research and it includes several important foods/food groups. As with all diet scores, some important nutrients are not included in the MDS, such as salt intake. This may have slightly underestimated the benefits of a healthy diet and consequently underestimated the associations between change in diet and CVD and death. Although a substantial proportion of the data at the 5‐year follow‐up wave (1998–2002) were multiple imputed (22.7%), complete‐case analysis yielded similar results. The use of self‐reported lifestyle data may possibly have led to misclassification, resulting in underestimation of the associations. Finally, our results were obtained in a relatively healthy population, which has most likely led to underestimation of the strength of associations attributable to underestimation of the number of participants with CVD and those who died.
In conclusion, having and maintaining an overall healthy lifestyle profile (ie, nonsmoking, a healthy diet, adequate physical activity, moderate alcohol consumption, and a healthy BMI) is associated with the lowest risk of CVD and all‐cause mortality (ie, 57%–60% lower risks compared to maintaining an unhealthy lifestyle profile). However, few adults have a healthy lifestyle and even fewer are able to maintain this healthy lifestyle over time. Independent of lifestyle behavior at young adulthood/middle age, deterioration in lifestyle over a 5‐year period may lead to an approximate one‐third higher risk of CVD incidence and all‐cause mortality, whereas improvement in lifestyle over the same period did not reduce those risks in this cohort. Thus, at young adulthood/middle age, the benefits of a healthy lifestyle are easily lost by deterioration in lifestyle. These findings underscore the need to focus CVD prevention efforts not only on adults with unhealthy lifestyles or at high risk of CVD, but also on adults with healthy lifestyles by promoting the maintenance of healthy lifestyles throughout the life course.
Sources of Funding
This work was supported by the Ministry of Health, Welfare and Sport of the Netherlands and the National Institute for Public Health and the Environment (Grant No.: S/260236/01/LC).
Disclosures
None.
Acknowledgments
The Doetinchem Cohort Study was financially supported by the Ministry of Health, Welfare and Sport of the Netherlands. The authors thank the field workers of the Municipal Health Services in Doetinchem (C. te Boekhorst, I. Hengeveld, L. de Klerk, I. Thus, and C. de Rover, MSc) for their contribution to the data collection of this study. The project director is Prof Dr W.M.M. Verschuren. Dr H.S.J. Picavet coordinates the fieldwork since 2007. Logistic management is provided by P. Vissink and data management is provided by A. Blokstra, MSc, A.W.D. van Kessel, MSc, and P.E. Steinberger, MSc. For statistical advice, Prof Dr H.C. Boshuizen is gratefully acknowledged.
(J Am Heart Assoc. 2016;5:e002432 doi: 10.1161/JAHA.115.002432)
References
- 1. Eguchi E, Iso H, Tanabe N, Wada Y, Yatsuya H, Kikuchi S, Inaba Y, Tamakoshi A. Healthy lifestyle behaviours and cardiovascular mortality among Japanese men and women: the Japan collaborative cohort study. Eur Heart J. 2012;33:467–477. [DOI] [PubMed] [Google Scholar]
- 2. Ford ES, Bergmann MM, Kroger J, Schienkiewitz A, Weikert C, Boeing H. Healthy living is the best revenge: findings from the European Prospective Investigation into Cancer and Nutrition‐Potsdam study. Arch Intern Med. 2009;169:1355–1362. [DOI] [PubMed] [Google Scholar]
- 3. Ford ES, Zhao G, Tsai J, Li C. Low‐risk lifestyle behaviors and all‐cause mortality: findings from the National Health and Nutrition Examination Survey III Mortality Study. Am J Public Health. 2011;101:1922–1929. [DOI] [PMC free article] [PubMed] [Google Scholar]
- 4. Hoevenaar‐Blom MP, Spijkerman AM, Kromhout D, Verschuren WM. Sufficient sleep duration contributes to lower cardiovascular disease risk in addition to four traditional lifestyle factors: the MORGEN study. Eur J Prev Cardiol. 2014;21:1367–1375. [DOI] [PubMed] [Google Scholar]
- 5. Kurth T, Moore SC, Gaziano JM, Kase CS, Stampfer MJ, Berger K, Buring JE. Healthy lifestyle and the risk of stroke in women. Arch Intern Med. 2006;166:1403–1409. [DOI] [PubMed] [Google Scholar]
- 6. Loef M, Walach H. The combined effects of healthy lifestyle behaviors on all cause mortality: a systematic review and meta‐analysis. Prev Med. 2012;55:163–170. [DOI] [PubMed] [Google Scholar]
- 7. Mitchell JA, Bornstein DB, Sui X, Hooker SP, Church TS, Lee CD, Lee DC, Blair SN. The impact of combined health factors on cardiovascular disease mortality. Am Heart J. 2010;160:102–108. [DOI] [PMC free article] [PubMed] [Google Scholar]
- 8. Stampfer MJ, Hu FB, Manson JE, Rimm EB, Willett WC. Primary prevention of coronary heart disease in women through diet and lifestyle. N Engl J Med. 2000;343:16–22. [DOI] [PubMed] [Google Scholar]
- 9. van Dam RM, Li T, Spiegelman D, Franco OH, Hu FB. Combined impact of lifestyle factors on mortality: prospective cohort study in US women. BMJ. 2008;337:a1440. [DOI] [PMC free article] [PubMed] [Google Scholar]
- 10. Liu K, Daviglus ML, Loria CM, Colangelo LA, Spring B, Moller AC, Lloyd‐Jones DM. Healthy lifestyle through young adulthood and the presence of low cardiovascular disease risk profile in middle age: the coronary artery risk development in (young) adults (CARDIA) study. Circulation. 2012;125:996–1004. [DOI] [PMC free article] [PubMed] [Google Scholar]
- 11. Franco M, Cooper RS, Bilal U, Fuster V. Challenges and opportunities for cardiovascular disease prevention. Am J Med. 2011;124:95–102. [DOI] [PubMed] [Google Scholar]
- 12. Danaei G, Ding EL, Mozaffarian D, Taylor B, Rehm J, Murray CJ, Ezzati M. The preventable causes of death in the United States: comparative risk assessment of dietary, lifestyle, and metabolic risk factors. PLoS Med. 2009;6:e1000058. [DOI] [PMC free article] [PubMed] [Google Scholar]
- 13. King DE, Mainous AG III, Geesey ME. Turning back the clock: adopting a healthy lifestyle in middle age. Am J Med. 2007;120:598–603. [DOI] [PubMed] [Google Scholar]
- 14. Picavet HS, Wendel‐vos GC, Vreeken HL, Schuit AJ, Verschuren WM. How stable are physical activity habits among adults? The Doetinchem Cohort Study. Med Sci Sports Exerc. 2011;43:74–79. [DOI] [PubMed] [Google Scholar]
- 15. Mulder M, Ranchor AV, Sanderman R, Bouma J, van den Heuvel WJ. The stability of lifestyle behaviour. Int J Epidemiol. 1998;27:199–207. [DOI] [PubMed] [Google Scholar]
- 16. Spring B, Moller AC, Colangelo LA, Siddique J, Roehrig M, Daviglus ML, Polak JF, Reis JP, Sidney S, Liu K. Healthy lifestyle change and subclinical atherosclerosis in young adults: coronary artery risk development in young adults (CARDIA) study. Circulation. 2014;130:10–17. [DOI] [PMC free article] [PubMed] [Google Scholar]
- 17. Verschuren WM, Blokstra A, Picavet HS, Smit HA. Cohort profile: the Doetinchem Cohort Study. Int J Epidemiol. 2008;37:1236–1241. [DOI] [PubMed] [Google Scholar]
- 18. Chiuve SE, Fung TT, Rexrode KM, Spiegelman D, Manson JE, Stampfer MJ, Albert CM. Adherence to a low‐risk, healthy lifestyle and risk of sudden cardiac death among women. JAMA. 2011;306:62–69. [DOI] [PMC free article] [PubMed] [Google Scholar]
- 19. Ocke MC, Bueno‐de‐Mesquita HB, Goddijn HE, Jansen A, Pols MA, van Staveren WA, Kromhout D. The Dutch EPIC food frequency questionnaire. I. Description of the questionnaire, and relative validity and reproducibility for food groups. Int J Epidemiol. 1997;26(suppl 1):S37–S48. [DOI] [PubMed] [Google Scholar]
- 20. Ocke MC, Bueno‐de‐Mesquita HB, Pols MA, Smit HA, van Staveren WA, Kromhout D. The Dutch EPIC food frequency questionnaire. II. Relative validity and reproducibility for nutrients. Int J Epidemiol. 1997;26(suppl 1):S49–S58. [DOI] [PubMed] [Google Scholar]
- 21. Trichopoulou A, Orfanos P, Norat T, Bueno‐de‐Mesquita B, Ocke MC, Peeters PH, van der Schouw YT, Boeing H, Hoffmann K, Boffetta P, Nagel G, Masala G, Krogh V, Panico S, Tumino R, Vineis P, Bamia C, Naska A, Benetou V, Ferrari P, Slimani N, Pera G, Martinez‐Garcia C, Navarro C, Rodriguez‐Barranco M, Dorronsoro M, Spencer EA, Key TJ, Bingham S, Khaw KT, Kesse E, Clavel‐Chapelon F, Boutron‐Ruault MC, Berglund G, Wirfalt E, Hallmans G, Johansson I, Tjonneland A, Olsen A, Overvad K, Hundborg HH, Riboli E, Trichopoulos D. Modified Mediterranean diet and survival: EPIC‐elderly prospective cohort study. BMJ. 2005;330:991. [DOI] [PMC free article] [PubMed] [Google Scholar]
- 22. Pols MA, Peeters PH, Ocke MC, Slimani N, Bueno‐de‐Mesquita HB, Collette HJ. Estimation of reproducibility and relative validity of the questions included in the EPIC Physical Activity Questionnaire. Int J Epidemiol. 1997;26(suppl 1):S181–S189. [DOI] [PubMed] [Google Scholar]
- 23. Ainsworth BE, Haskell WL, Herrmann SD, Meckes N, Bassett DR Jr, Tudor‐Locke C, Greer JL, Vezina J, Whitt‐Glover MC, Leon AS. 2011 Compendium of physical activities: a second update of codes and MET values. Med Sci Sports Exerc. 2011;43:1575–1581. [DOI] [PubMed] [Google Scholar]
- 24. Kemper H, Ooijendijk W, Stiggelbout M. Consensus about the Dutch physical activity guideline. Tijdschr Soc Geneeskd. 2000;78:180–183. [Google Scholar]
- 25. Perk J, De Backer G, Gohlke H, Graham I, Reiner Z, Verschuren M, Albus C, Benlian P, Boysen G, Cifkova R, Deaton C, Ebrahim S, Fisher M, Germano G, Hobbs R, Hoes A, Karadeniz S, Mezzani A, Prescott E, Ryden L, Scherer M, Syvanne M, Scholte Op Reimer WJ, Vrints C, Wood D, Zamorano JL, Zannad F. European guidelines on cardiovascular disease prevention in clinical practice (version 2012). The Fifth Joint Task Force of the European Society of Cardiology and other societies on cardiovascular disease prevention in clinical practice (constituted by representatives of nine societies and by invited experts). Eur Heart J. 2012;33:1635–1701. [DOI] [PubMed] [Google Scholar]
- 26. Alberti KG, Zimmet PZ. Definition, diagnosis and classification of diabetes mellitus and its complications. Part 1: diagnosis and classification of diabetes mellitus provisional report of a WHO consultation. Diabet Med. 1998;15:539–553. [DOI] [PubMed] [Google Scholar]
- 27. Sluijs I, van der AD, Beulens JW, Spijkerman AM, Ros MM, Grobbee DE, van der Schouw YT. Ascertainment and verification of diabetes in the EPIC‐NL study. Neth J Med. 2010;68:333–339. [PubMed] [Google Scholar]
- 28. de Bruin A, de Bruin EL. Bestand pgs: Linking Data of National Ambulant Register and GBA data: Methods, Results and Quality Research (in Dutch). Koppeling van lmr‐ en gba gegevens: Methode, resultaten en kwaliteitsonderzoek. Volume 6008703010. Voorburg/Heerlen: centraal bureau voor de statistiek; 2003. [Google Scholar]
- 29. World Health Organisation . International Classification of Diseases, 9th Revision (ICD‐9). Geneva, Switserland: World Health Organisation; 1977. [Google Scholar]
- 30. World Health Organisation . International Classification of Diseases, 10th Revision (ICD‐10). Geneve, Switserland: World Health Organisation; 1990. [Google Scholar]
- 31. Greenland S, Finkle WD. A critical look at methods for handling missing covariates in epidemiologic regression analyses. Am J Epidemiol. 1995;142:1255–1264. [DOI] [PubMed] [Google Scholar]
- 32. White IR, Carlin JB. Bias and efficiency of multiple imputation compared with complete‐case analysis for missing covariate values. Stat Med. 2010;29:2920–2931. [DOI] [PubMed] [Google Scholar]
- 33. Rubin DB. Multiple Imputation for Non Response in Surveys. New York: Wiley; 1987. [Google Scholar]
- 34. White IR, Royston P. Imputing missing covariate values for the Cox model. Stat Med. 2009;28:1982–1998. [DOI] [PMC free article] [PubMed] [Google Scholar]
- 35. Hoevenaar‐Blom MP, Wendel‐Vos GC, Spijkerman AM, Kromhout D, Verschuren WM. Cycling and sports, but not walking, are associated with 10‐year cardiovascular disease incidence: the MORGEN study. Eur J Cardiovasc Prev Rehabil. 2011;18:41–47. [DOI] [PubMed] [Google Scholar]
- 36. Hoevenaar‐Blom MP, Nooyens AC, Kromhout D, Spijkerman AM, Beulens JW, van der Schouw YT, Bueno‐de‐Mesquita B, Verschuren WM. Mediterranean style diet and 12‐year incidence of cardiovascular diseases: the EPIC‐NL cohort study. PLoS One. 2012;7:e45458. [DOI] [PMC free article] [PubMed] [Google Scholar]
- 37. Hulsegge G, Smit HA, van der Schouw YT, Daviglus ML, Verschuren WM. Quantifying the benefits of achieving or maintaining long‐term low risk profile for cardiovascular disease: the Doetinchem Cohort Study. Eur J Prev Cardiol. 2015;22:1307–1316. [DOI] [PubMed] [Google Scholar]