Abstract
Background
Hyper‐ and hypokalemia are clinically silent, common in patients with renal or cardiac disease, and are life threatening. A noninvasive, unobtrusive, blood‐free method for tracking potassium would be an important clinical advance.
Methods and Results
Two groups of hemodialysis patients (development group, n=26; validation group, n=19) underwent high‐resolution digital ECG recordings and had 2 to 3 blood tests during dialysis. Using advanced signal processing, we developed a personalized regression model for each patient to noninvasively calculate potassium values during the second and third dialysis sessions using only the processed single‐channel ECG. In addition, by analyzing the entire development group's first‐visit data, we created a global model for all patients that was validated against subsequent sessions in the development group and in a separate validation group. This global model sought to predict potassium, based on the T wave characteristics, with no blood tests required. For the personalized model, we successfully calculated potassium values with an absolute error of 0.36±0.34 mmol/L (or 10% of the measured blood potassium). For the global model, potassium prediction was also accurate, with an absolute error of 0.44±0.47 mmol/L for the training group (or 11% of the measured blood potassium) and 0.5±0.42 for the validation set (or 12% of the measured blood potassium).
Conclusions
The signal‐processed ECG derived from a single lead can be used to calculate potassium values with clinically meaningful resolution using a strategy that requires no blood tests. This enables a cost‐effective, noninvasive, unobtrusive strategy for potassium assessment that can be used during remote monitoring.
Keywords: electrophysiology, potassium, waves
Subject Categories: Diagnostic Testing
Introduction
Blood potassium levels are tightly regulated homeostatically and are critical for normal physiological cellular function.1, 2 Fluctuations in potassium values are found in many disease states and can expose patients to life‐threatening arrhythmias.3, 4, 5 Compelling evidence shows that in patients with renal or cardiac disease, even modest potassium changes may lead to morbidity, hospitalization, and death.6 Moreover, evidence‐based therapies used to treat these conditions, including adrenergic blockade, potassium‐sparing diuretics, and renin–angiotensin antagonism, result in hyper‐ or hypokalemia. After the potassium‐sparing diuretic spironolactone was shown to lower heart failure mortality in a randomized prospective trial, hospitalization for hyperkalemia tripled and mortality doubled.7 As the prevalence of these diseases and their risk factors (hypertension and diabetes) rise, and as the population continues to age, increasing numbers of patients will be at risk of hyper‐ and hypokalemia.8, 9
Potassium levels outside the normal range are concerning because they are usually clinically silent and occur without warning to the patient or provider in the absence of blood tests.10 In addition, a standard 12‐lead ECG is diagnostic only after the onset of severe hyper‐ or hypokalemia. There is a critically unmet need for a noninvasive method of measuring potassium prior to clinically significant changes that may lead to arrhythmogenic death so as to initiate timely lifesaving treatment.11 Noninvasive remote potassium monitoring would permit the administration of evidence‐based life‐saving measures and medications, including recently developed safe and effective potassium‐lowering medications.12, 13, 14, 15
Recently, in a small cohort of dialysis patients, we demonstrated that the signal‐processed 12‐lead ECG can detect subtle T wave changes that, in turn, can be used to calculate blood potassium concentrations reliably.16 To facilitate clinical applicability, a less cumbersome, noninvasive approach is required. To that end, the goal of this study was to refine our processing methodology to reduce detection requirements to a single channel (to enable mobility and home use) and to demonstrate a correlation between the processed ECG and potassium as well as use the ECG to prospectively calculate potassium values reliably. Potassium value extraction using a single lead would permit use in wearable, wireless ECG patches and possibly in implantable loop recorders and cardiac implantable electronic devices (pacemakers and defibrillators). To test the hypothesis that the properly processed ECG could be used to calculate serum potassium from a single lead and to do this reliably both with and without an initial “seeding” blood test to train the algorithm, we performed a prospective trial in a cohort of dialysis patients.
Methods
Inpatients and outpatients aged ≥18 years undergoing clinically indicated hemodialysis at the Mayo Clinic in Rochester, Minnesota, were prospectively enrolled under institutional review board–approved protocols after providing written informed consent. In all patients, 12‐lead ECG data were acquired using electrodes in standard clinical positions, recorded with a Siesta 802 system (Compumedics) starting immediately before the onset of dialysis and continuing until its termination. Signal acquisition was performed at a rate of 1024 samples per second. Data were analyzed using the Matlab environment (MathWorks).
Patient Groups
The algorithm development group (group 1) consisted of 26 patients who underwent 3 dialysis sessions as part of the study (Figure 1). At each dialysis session, blood was drawn for analysis at 3 time points: before dialysis; at the midpoint of dialysis, after temporarily clamping the heparin line (if in use), stopping dialysate flow, and decreasing the blood flow rate to 100 mL/min for at least 15 seconds; and after dialysis, after stopping dialysate flow and decreasing the blood flow rate to 100 mL/min for at least 15 seconds. This group was used to develop the algorithm tested in this report. Although the algorithm applied concepts developed in our previous work,16 the filtering and processing were novel to better account for ambient electrical noise and intermittent poor signal quality and to permit single‐lead recording, as detailed below.
Figure 1.
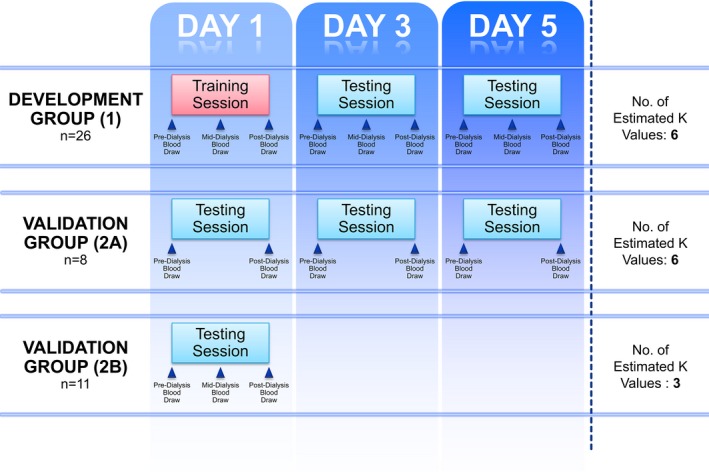
Patient flow. This diagram depicts patient enrollment and analysis. The development group consisted of 26 patients who underwent 3 dialysis sessions, the first of which was the training session used to create a personalized template. The personalized template was tested on days 3 and 5. During each dialysis session, blood was drawn before, during, and after dialysis. Another 8 patients composed validation group 2A, which underwent 3 dialysis sessions with 2 blood tests. Last, validation group 2B was composed of 11 patients who had undergone previous study but whose data were not used for creation of the algorithm. Further details are described in the text.
The validation group was composed of 2 subgroups (groups 2A and 2B). Group 2A consisted of 8 patients, each of whom underwent 3 recorded dialysis sessions with 2 blood tests, 1 before and 1 immediately following dialysis. Group 2B consisted of 11 patients who had been previously studied so that full dialysis and digitized ECG data were available.16 None of the data from the patients in group 2 were used to create the potassium prediction algorithms described in this paper.
Analysis
Results are presented as mean±SD unless otherwise noted. To compare performance of different prediction models, absolute errors were calculated between observed and predicted measurements and summarized.
Analysis Strategies
Personalized analysis
For each patient in group 1, a single dialysis session was used to identify each patient's potassium “dose‐response curve” that defined the relationship between the processed ECG parameter and the measured potassium value for each patient. Of the 3 dialysis sessions, the first was used to seed the algorithm by defining the processed ECG parameter–potassium relationship. The ECG data from the second and third dialysis sessions were then used to calculate potassium values, and the blood tests were used to calculate the error in the calculated potassium. Although group 1 was defined as the algorithm development group, for the purposes of the personalized analysis, the first session was used for personalization, and the next 2 sessions were used to test the results of the personalized strategy.
Global analysis
The global analysis strategy assumed that the relationship between the signal‐processed ECG and blood potassium was universal or at least stable for humans (species specific), as opposed to specific for each person, and thus that potassium determination could be performed without seeding the algorithm using blood tests from each patient (a completely blood‐free “bloodless blood test”). To perform the global analysis, we combined all data from the first dialysis session of all patients in group 1 into a composite group. This was used to create a global model of the relationship between the signal‐processed ECG and serum potassium. This global model was tested in 2 ways. First, we assessed the ability of this model to calculate the potassium during the second and third sessions for the patients in group 1. In other words, we tested the model's ability to calculate potassium in subsequent dialysis sessions using the same cohort that developed the model. Next, we tested the global model by applying it to the patients in group 2 (validation group), none of whom contributed data to model creation.
ECG Signal Processing and Analysis
Electrode selection and segmentation
ECG data from all patients were processed using a multistage signal‐averaging algorithm. In this work, we sought to analyze electrodes in similar precordial positions between sessions to mimic anticipated deployment using prolonged monitoring via a single channel patch or a subcutaneous device. To accomplish this, for each session, only data from the single lateral precordial lead (ie, 1 of V3 through V6) with the greatest amplitude T wave was used to calculate potassium. Signal amplitude between sessions was normalized to the square root of the T wave amplitude. We used this as our first‐generation approach to minimize electrode‐placement wandering; more advanced strategies are under development. In addition, in this early demonstration project, we included only patients with a positive uniphasic T wave in the lead under analysis. The ECG data were divided into 72‐second segments to allow overlap of 1‐minute intervals. The processing algorithms were then applied to each segment. This resulted in every 1‐minute segment having a processed, filtered, averaged representative ECG complex. This processed ECG complex was used for morphological feature extraction.
Signal processing and averaging and “big data” strategy
In each 72‐second, high‐resolution, single‐lead ECG segment, between 50 and 200 beats (depending on ectopy/filtering) were typically averaged and processed to a single representative complex. This resulted in a large ratio between the input and the output of the data‐processing algorithm, creating significant data redundancy. The robust data redundancy permitted ECG signal cleaning using a novel strategy, an artifact detector, that rejected suboptimal data to permit high‐fidelity analysis from a single electrode, as opposed to filtering the data and introducing possible distortions. The artifact detector identified changes in the baseline using linear and nonlinear filtering of the ECG at low frequencies. It automatically scored the signal and applied an adaptive threshold chosen using the entire segment's mean and median scores. Any section of signal that exceeded the threshold was defined as contaminated with artifact and discarded (Figure 2). The second step of the algorithm involved detection of QRS complexes17, 18 and a correlation filter that eliminated ectopic and aberrant complexes. In the third step of the algorithm, all complexes were aligned using a fiducial point in the QRS, and complexes that varied from the median pattern were removed. In the final step, complexes were signal averaged to remove noise and to smooth the waveform morphology.
Figure 2.
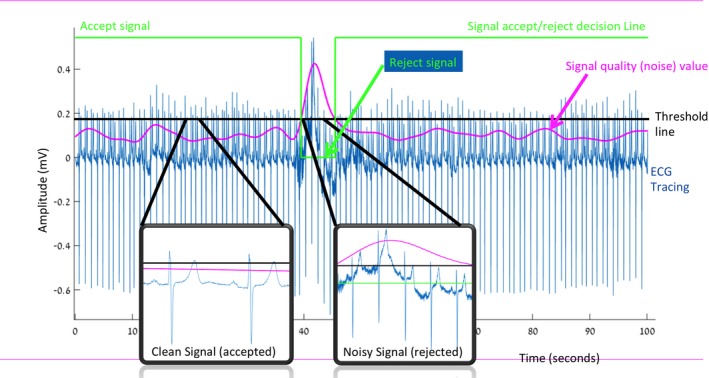
Artifact rejection algorithm. In this time‐compressed ECG tracing, the voltage amplitude is shown on the y‐axis, and time is shown on the x‐axis. The green line indicates the decision to accept or reject the signal as clean or noisy; when the line is positive, the signal is accepted, and when it becomes zero, the signal is rejected for noise. In the center section, the green line becomes zero, and the signal is rejected. The 2 blow‐up boxes demonstrate a magnified sample of ECG from a segment in which the signal was accepted by the algorithm (left box) and a segment during which it was rejected by the algorithm (right inset box). The purple line depicts the algorithmically calculated real‐time score assessing signal quality (larger value indicates more noise, poorer signal). When the purple signal‐quality line exceeds the horizontal black line (a threshold line), the signal is excessively noisy and is rejected (as indicated by the green line becoming zero). Due to data redundancy, noisy data are rejected and sufficiently clean signals are retained to permit analysis.
ECG feature extraction
The averaged processed ECG complex was used for feature extraction for analysis. T wave peak and end points were selected in an automated manner, as described previously.16 The algorithm then automatically selected a representative section of the descending T wave to estimate its slope (T‐right slope) using the mean derivative approach.19, 20, 21 T wave amplitude (T‐amp) was measured as the difference in millivolts between the T wave peak and end. After deriving these values of the T‐right slope and T‐amp, a Kalman filter22 was used to reduce noise, taking advantage of the fact that the rate of serum potassium change over 72 seconds is limited and that abrupt segmental changes represent a segmental anomaly as opposed to a true potassium change.
Potassium and feature tracking during dialysis
To validate the correlation between the features selected and potassium values, we built a tool for temporal progression analysis. This tool permitted “fast‐forward” ECG analysis using the methods described. The tool demonstrates the progress of the automated ECG analysis on the dialysis timeline and representative corresponding potassium blood tests in a time‐lapsed manner. An example of tool usage to analyze feature extraction during dialysis run is shown in Video S1 and Figure 3.
Figure 3.
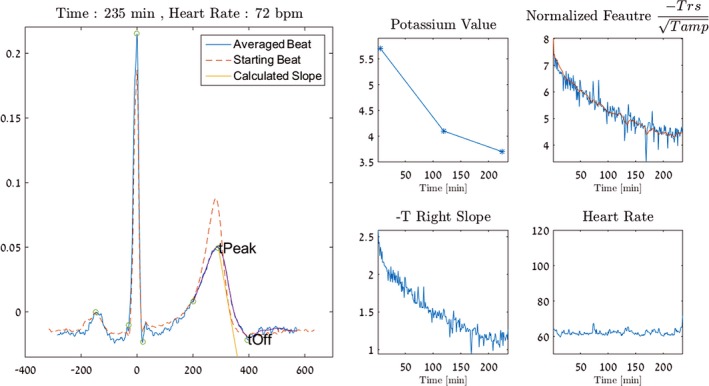
Temporal change of potassium using the temporal progression tool. This image is a still frame taken from Video S1. The left panel shows a representative ECG complex that has been processed, filtered, and displayed. The dashed ECG complex is an initial processed ECG acquired before dialysis commenced. The overlapping blue ECG tracing demonstrates the processed ECG acquired at the end of dialysis, at which point potassium had dropped from 5.0 to 3.4 mmol/L. The peak and the end of the T wave are continuously calculated by the algorithm and updated during the course of dialysis by the temporal progression tool, as shown in Video S1. The peak (tPeak) and the end (tOff) of the T wave are labeled. The brown straight line between tPeak and tOff shows the automatically calculated slope for that time interval, the T‐right slope. The 4 inset boxes to the right depict additional processing and data. The potassium value indicates the 3 blood potassium test results for this patient during the dialysis run demonstrated. The straight line between these points is assumed and does not reflect any actual data. The top‐right box demonstrates the feature used to calculate potassium in blue. The brown line in the center depicts the application of the Kalman filter used to remove transient, artifactual deviations to calculate the final potassium value. The bottom‐left box demonstrates the nonnormalized T‐right slope over time, and the bottom‐right box demonstrates the heart rate plot during the dialysis run.
Creation of Prediction Models
With the personalized strategy, potassium values from the first dialysis session and were used to build a linear least squares estimator for each patient. The second and third ECG recordings were extracted, processed, and plugged into the estimator for prediction purposes.
In the global prediction approach, we combined the first‐visit data of all group 1 patients to create a “global estimator.” To combine the ECGs from all patients, we normalized the T‐right slope with the square root of the T‐amp.
Results
We recorded ECG data during 129 dialysis sessions in 51 patients, with a mean of 2.5 sessions per patient. Patients had a mean age of 58±16 years, and 66% were men. The mean left ventricular ejection fraction was 59±7, and 9% of analyzed patients had a history of myocardial infraction. In those patients excluded from the analysis due to unusable ECG, left ventricular ejection fraction was 46±16%, and 67% of patients had a history of myocardial infarction. Biphasic or inverted T waves precluded analysis of any data in 6 patients (11% of the study population) and precluded analysis of a single visit from 1 patient.
Personalized Analysis
The personalized estimator was tested on 26 patients who had all 3 visits with 3 blood tests during each visit, except for 3 patients in whom 1 blood test or an ECG at the time of phlebotomy was not available. The measured blood potassium value was 3.9±0.8 mmol/L. The mean absolute error across 2 subsequent visits (6 blood tests per patient) was 0.36±0.34 mmol/L. The median absolute error was 0.26 mmol/L, and the averaged percentage error was 10% of the serum potassium blood test result (Figures 4 and 5).
Figure 4.
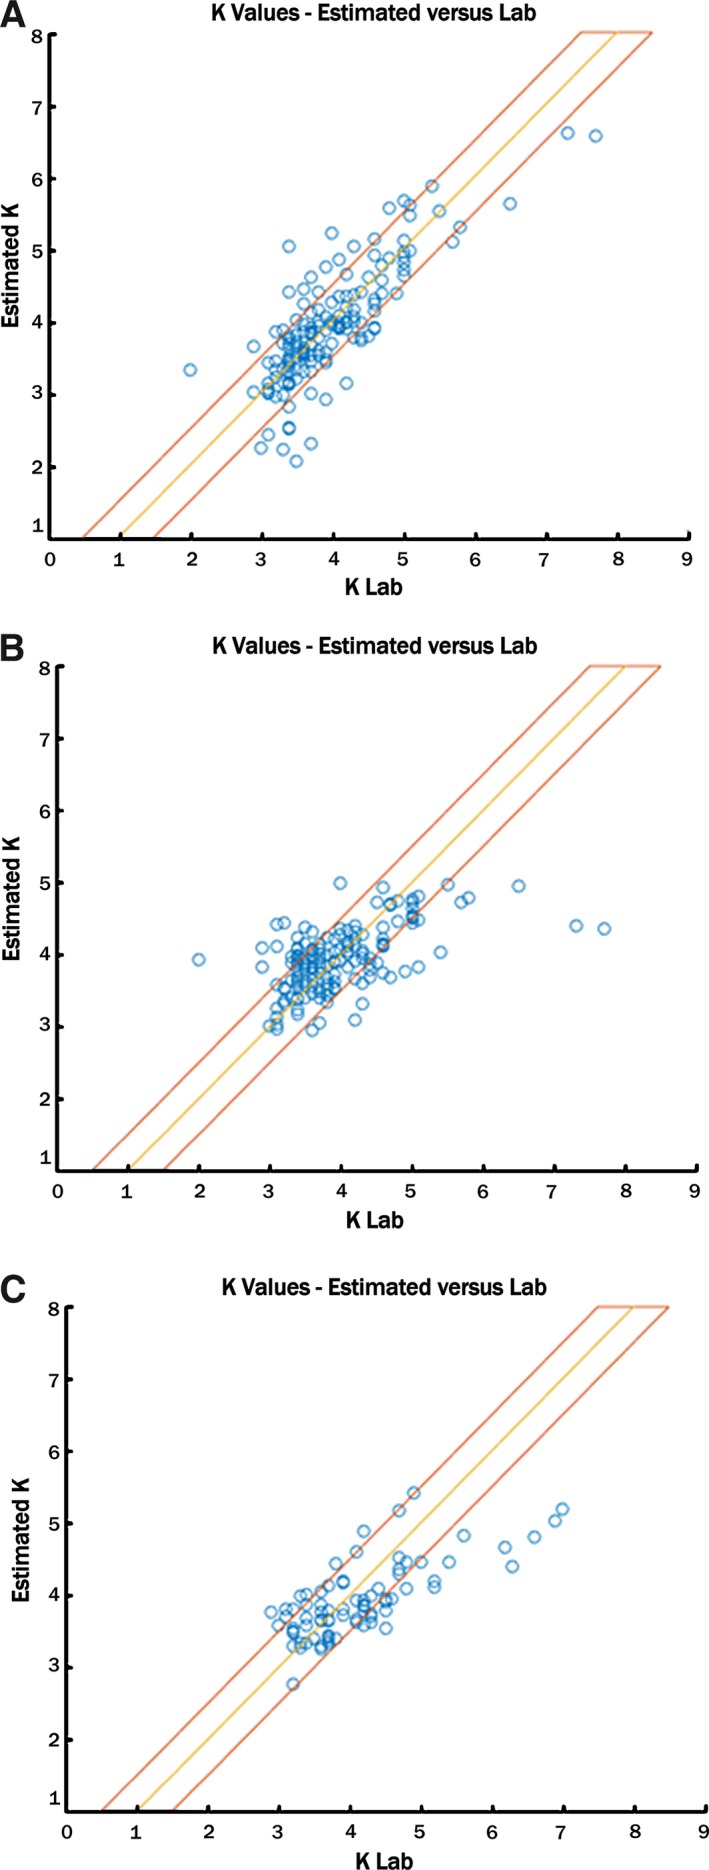
Algorithmically calculated and laboratory potassium values. A, The algorithmically estimated potassium value using the personalized prediction system is on the ordinate, and the laboratory‐derived value is on the abscissa. Panels (B) and (C) reflect the same, using the global methodology. B, The first dialysis run was used to create global parameters, and those parameters were then tested in the same patients in dialysis runs 2 and 3. C, A separate validation set of patients was used to test the parameters developed using patient group 1. The yellow line represents a perfect match between calculated and laboratory potassium values, and the red boundaries represent the area for which each predicted value is within the 0.5 mmol/L absolute error range.
Figure 5.
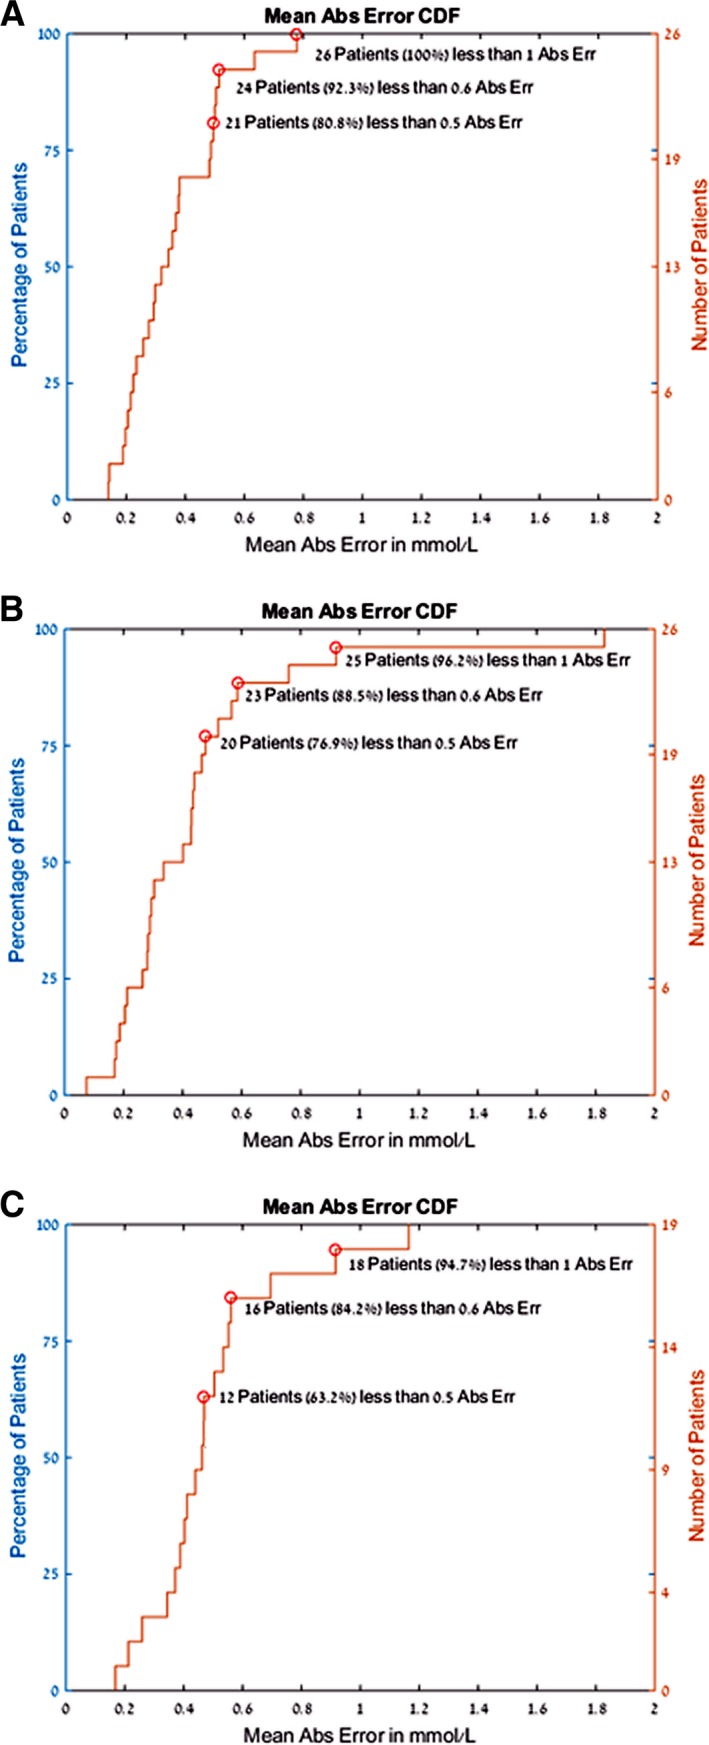
Cumulative mean absolute error in calculated potassium. In all panels, the abscissa shows the mean absolute error in calculated potassium, and the ordinate indicates the percentage of patients with that error. Panel (A) demonstrates the error when using the personalized predictor model. In panel (B), we see the same presentation of the data but using the global predictor applied to group 1 patients. In other words, the group of patients used to create the global model then had that model tested in subsequent dialysis sessions. In panel (C), the global predictor was applied to an independent cohort of patients (group 2A and 2B) to assess the parameters developed for one set of patients with regard to the other. As can be seen, when using the personalized predictor (A), 92% of patients had a mean absolute error <0.6 mmol/L. Abs indicates absolute.
Global Analysis (No Seeding Blood Test)
The global estimator was tested in 2 populations. The first population tested was group 1 (the development group), in which the global estimator was used to calculate the potassium in the second and third dialysis sessions. The absolute error value in 2 different visits (6 blood tests total) was 0.44±0.47 mmol/L, the median absolute error was 0.33 mmol/L, and the averaged percentage error was 11% of the serum potassium blood test result. Using the square root of the T wave to normalize the T‐right slope improved the results of the global analysis.
When the global analysis was applied in group 2 (validation population, none of the data of which contributed to model creation), the measured blood potassium value was 4.2±0.95 mmol/L. The absolute error value in 6 blood tests for group 2A and 3 blood tests for group 2B was 0.5±0.42 mmol/L; median error was 0. 41 mmol/L, and averaged percentage error was 12% of the serum potassium blood test result.
The temporal progression tool confirmed the utility of using the T‐right slope as a parametric feature to calculate potassium. In addition, it confirmed that the temporal change in calculated potassium paralleled changes in the blood tests and suggested a more accurate means of assessing potassium values during dialysis (Figure 6 and Video S1).
Figure 6.
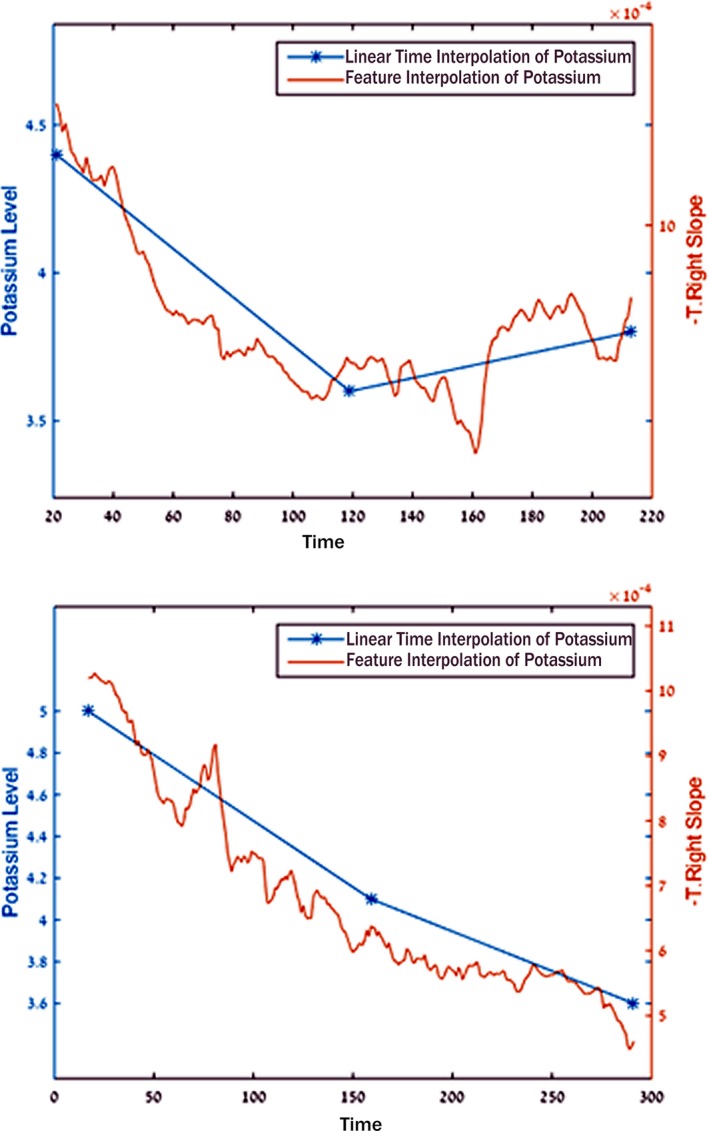
Comparison of trends in potassium during dialysis using processed ECG and blood potassium. The left and right panels each show a dialysis run in 2 separate patients. Blue points indicate the potassium blood test results, and the brown line indicates the calculated real‐time potassium level. Note that the blue lines interpolated between the blood test results are not based on actual data. Also note the strong similarity in trends and potassium changes between the ECG‐derived and blood potassium values. This suggests that trending could be used to identify rising or falling potassium values, even in the absence of an absolute numerical value for potassium.
Discussion
In patients with cardiovascular and/or renal disease, hyperkalemia is frequent, life‐threatening, and usually asymptomatic.3, 5 The emergence of safe and effective medications that lower potassium underscores the importance of detection of hyperkalemia.11, 12, 14, 23 The ability to remotely, unobtrusively, frequently, and noninvasively assess potassium through a single‐channel signal‐processed ECG would permit currently available wireless ECG patches, implanted monitors, and cardiac devices to infer measurements of potassium; would address a critical need; and would affect a large population. In this study of patients undergoing hemodialysis, the signal‐processed ECG was able to calculate potassium values with a mean error of 0.36±0.34 mmol/L using a personalized strategy that required a seeding blood test, providing a clinically meaningful value via individualized medicine. Importantly, even without personalization and in the absence of any blood draws, clinically useful estimates of potassium were obtained, providing potassium values with a mean error of 0.5±0.42 mmol/L, and could be useful for alerts and trending. These findings, using a single lead of high‐resolution ECG data, suggest that this approach may be suitable for remotely monitoring potassium in dialysis patients. This population is at high risk for hyperkalemia and sudden death, often in the 12 hours before a dialysis session, suggesting a hyperkalemic mechanism.1
Several algorithmic strategies were applied to achieve a high level of precision. One was application of an artifact detector concept, in which the availability of redundant data permitted use of an automated artifact detector that discarded poor‐quality data rather than attempt to filter or clean it. This fundamental strategy may be applicable to the analysis of a large number of physiological signals for which mild or moderate latency is tolerable. Given that potassium values are not available clinically in the absence of blood tests, even once‐ or twice‐daily assessments would represent a significant advance, particularly in high‐risk patients recently discharged from the hospital. Delays of minutes or hours in determination of a potassium value are generally acceptable clinically. Broadly, a major challenge in remote patient monitoring is the issue of artifact and noise, commonly present when nonobtrusive, well‐tolerated sensors are used to acquire often‐noisy signals in ambulatory patients. Leveraging data redundancy may be applicable in a large array of physiological signal and monitoring applications. A second strategy was the use of the Kalman filter, historically used to distinguish returning radar signals caused by flocks of birds from those of tracked airplanes by recognizing constraints in the abruptness of change of trajectory and velocity of which an airplane is capable. In a similar manner, we recognized that a marked change in potassium over a time frame of a few minutes, particularly if not a consistent change, represents measurement error, permitting correction and increased accuracy.
In this study, we used advanced algorithms to further validate the use of easily obtained ECG repolarization to predict potassium in both personalized and global prediction models in hemodialysis patients. We focused on single‐lead recordings to allow practical implementation and used 2 T wave features that we found best correlated with potassium in our prior work.16 These were used to develop both the personalized and global predictor models. The use of the descending T wave in lateral precordial leads mechanistically corroborated the relationship between potassium and repolarization. Extracellular potassium differentially affects the action potential repolarization in midmyocardial compared with endocardial and epicardial myocytes, reflected predominantly on the surface ECG as the T‐right slope.24 Changes in extracellular potassium concentrations affect the transmembrane voltage gradient of each myocyte, in aggregate summarized as the surface T wave. The function of potassium channels is essential to life, and their genetic sequence is highly conserved on an evolutionary scale, with similar sequences in a variety of species including bacteria and humans.25 Consequently, transmembrane channels are ideal microsensors of potassium levels, and global analysis is feasible, supporting the concept that we are detecting the sum of potassium changes at the cellular level and accounting for our unique fidelity in detecting subtle changes.
We previously described the correlation between the T‐right slope and T‐amp and potassium, and in this work, we used the correlation in a personalized and global predictive manner. Corsi et al26 found a similar relationship between the T wave and potassium levels, corroborating our findings; however, they created multidimensional Eigen leads using principal component analysis, which required a 12‐lead ECG. Although such a strategy further supports the concept, it is impractical for home use by ambulatory patients. We specifically developed tools to permit adaptation to ambulatory patients. In addition, we used a different normalization method, by using the square root of T‐amp instead of T‐amp itself, and thus preserved some of the information yielded by T‐amp while minimizing between‐patient and between‐visit ECG variability. Finally, our prediction was based on only 5 minutes of ECG instead of 15, which may be more practical for remote monitoring applications.
The temporal progression tool we developed created an animation of the processed ECG‐calculated potassium in a time‐lapsed manner, permitting assessment of potassium change during dialysis to facilitate assessment of the impact of algorithm changes during development (Figure 3 and Video S1). Moreover, using the tool, it was apparent that even if there was an error in absolute potassium value, the trend of the calculated potassium was very similar to the blood test potassium trend and indeed may represent a more accurate assessment than the presumed linearity plotted between blood draw potassium values (Figure 6). Furthermore, such information may prove helpful for determining whether an additional dialysis session may be helpful, for identifying interventions needed to lower (or raise) potassium, and for guiding the duration and intensity of dialysis itself.
Our work is best understood in the context of its limitations. In this initial implementation of the algorithm, patients with biphasic, bimodal, or inverted T waves were excluded, resulting in the exclusion of 6 patients (11.7% of enrolled participants) from analysis, 66% of whom had a history of myocardial infarction. In an additional patient, a single dialysis session was excluded because of the presence of T wave abnormalities at that visit alone; however, it is quite likely that with additional analysis and development, a larger set of ECG variants will become amenable to this form of signal processing. Patients with active ischemia and acute infarction likely will not be good candidates for this methodology; however, they are not typically treated via remote monitoring, and access to blood tests is not generally a challenge. The addition of currently available algorithms to detect cardiac rhythm disorders and ischemia would add useful functionality to the potassium assessment tool by providing relevant clinical information and could modify or withhold analysis when other important medical conditions arise. Longer term following infarction, stabilization of T waves will likely permit analysis, as we noted in the 9% of patients in our analyzed cohort with a history of myocardial infarction.
A number of factors other than potassium levels affect the ECG. These include variations in lead position,27 alteration in body position, changes in weight and volume status,28 alterations in heart rate and rhythm, and development of cardiac ischemia as well as other electrolytes that change during dialysis. Some of these factors, most notably body and lead position variability and fluid volume changes, likely account for some of the estimation error. Several potential sources of error can be eliminated using ECG template analysis and/or a sensor‐based accelerometer to record body position. Despite the multiple potential sources of error, the mean ECG‐derived potassium error in this stable dialysis population was only 0.5±0.42 mmol/L, or 12% on average. In addition, our T wave analysis validation testing was performed in a relatively small cohort, and all of our participants were dialysis patients. Future studies will extend these novel algorithms to nondialysis patients and validate the algorithms in larger cohorts. Last, we focused initially on potassium because of its clinical importance and its known relationship with ECG. Because other analytes exert known and different forces on ECG, it may be possible to process recordings to determine which ECG changes are attributable to which analyte to provide estimates of blood concentrations of elements beyond potassium, recognizing that some overlap will exist and that sophisticated analysis will be required.
In summary, the signal‐processed ECG derived from a single lead can be used to calculate potassium values with clinically meaningful resolution, using both a personalized strategy in which an algorithm is individualized based on seeding blood tests and a global analysis strategy that requires no blood tests at all. This opens the door to noninvasive, unobtrusive, remote, monitored potassium assessment. By enabling both accurate potassium value ascertainment and trend detection, alerts can be issued and interventions initiated, with the goal of improving clinical outcomes.
Sources of Funding
This study was funded in part by a Mayo Clinic Discovery Translation Award.
Disclosures
Mayo Clinic has filed a patent around the work described in the publication and both Mayo Clinic and Drs Dillon, Somers, Bruce, Ackerman, Asirvatham, Friedman, and Kevin Bennet will receive compensation if the patent is licensed. This work was done in collaboration with the ECE department of Ben‐Gurion University in Israel, which holds patent rights related to this technology.
Supporting information
Video S1. This temporal‐progression video demonstrates time‐lapsed ECG changes during dialysis, together with the automated T wave right slope and calculated ECG feature and blood potassium values. The video demonstrates how the signal‐processed ECG tracks with potassium changes during a dialysis run, compressing changes that occur in 216 minutes into 1.5 minutes.
(J Am Heart Assoc. 2016;5:e002746 doi: 10.1161/JAHA.115.002746)
An accompanying Video S1 is available at http://jaha.ahajournals.org/content/5/1/e002746/suppl/DC1
References
- 1. Einhorn LM, Zhan M, Hsu VD, Walker LD, Moen MF, Seliger SL, Weir MR, Fink JC. The frequency of hyperkalemia and its significance in chronic kidney disease. Arch Intern Med. 2009;169:1156–1162. [DOI] [PMC free article] [PubMed] [Google Scholar]
- 2. Goyal A, Spertus JA, Gosch K, Venkitachalam L, Jones PG, Van den Berghe G, Kosiborod M. Serum potassium levels and mortality in acute myocardial infarction. JAMA. 2012;307:157–164. [DOI] [PubMed] [Google Scholar]
- 3. Gennari FJ. Hypokalemia. N Engl J Med. 1998;339:451–458. [DOI] [PubMed] [Google Scholar]
- 4. Kovesdy CP. Management of hyperkalaemia in chronic kidney disease. Nat Rev Nephrol. 2014;10:653–662. [DOI] [PubMed] [Google Scholar]
- 5. Weiner ID, Wingo CS. Hyperkalemia: a potential silent killer. J Am Soc Nephrol. 1998;9:1535–1543. [DOI] [PubMed] [Google Scholar]
- 6. Jain N, Kotla S, Little BB, Weideman RA, Brilakis ES, Reilly RF, Banerjee S. Predictors of hyperkalemia and death in patients with cardiac and renal disease. Am J Cardiol. 2012;109:1510–1513. [DOI] [PubMed] [Google Scholar]
- 7. Juurlink DN, Mamdani MM, Lee DS, Kopp A, Austin PC, Laupacis A, Redelmeier DA. Rates of hyperkalemia after publication of the Randomized Aldactone Evaluation Study. N Engl J Med. 2004;351:543–551. [DOI] [PubMed] [Google Scholar]
- 8. Roger VL, Go AS, Lloyd‐Jones DM, Benjamin EJ, Berry JD, Borden WB, Bravata DM, Dai S, Ford ES, Fox CS, Fullerton HJ, Gillespie C, Hailpern SM, Heit JA, Howard VJ, Kissela BM, Kittner SJ, Lackland DT, Lichtman JH, Lisabeth LD, Makuc DM, Marcus GM, Marelli A, Matchar DB, Moy CS, Mozaffarian D, Mussolino ME, Nichol G, Paynter NP, Soliman EZ, Sorlie PD, Sotoodehnia N, Turan TN, Virani SS, Wong ND, Woo D, Turner MB. Heart disease and stroke statistics–2012 update: a report from the American Heart Association. Circulation. 2012;125:e2–e220. [DOI] [PMC free article] [PubMed] [Google Scholar]
- 9. Wild S, Roglic G, Green A, Sicree R, King H. Global prevalence of diabetes: estimates for the year 2000 and projections for 2030. Diabetes Care. 2004;27:1047–1053. [DOI] [PubMed] [Google Scholar]
- 10. Gumz ML, Rabinowitz L, Wingo CS. An integrated view of potassium homeostasis. N Engl J Med. 2015;373:60–72. [DOI] [PMC free article] [PubMed] [Google Scholar]
- 11. Ingelfinger JR. A new era for the treatment of hyperkalemia? N Engl J Med. 2015;372:275–277. [DOI] [PubMed] [Google Scholar]
- 12. Ash SR, Singh B, Lavin PT, Stavros F, Rasmussen HS. A phase 2 study on the treatment of hyperkalemia in patients with chronic kidney disease suggests that the selective potassium trap, ZS‐9, is safe and efficient. Kidney Int. 2015;88:404–411. [DOI] [PMC free article] [PubMed] [Google Scholar]
- 13. Bakris GL, Pitt B, Weir MR, Freeman MW, Mayo MR, Garza D, Stasiv Y, Zawadzki R, Berman L, Bushinsky DA. Effect of patiromer on serum potassium level in patients with hyperkalemia and diabetic kidney disease: the AMETHYST‐DN Randomized Clinical Trial. JAMA. 2015;314:151–161. [DOI] [PubMed] [Google Scholar]
- 14. Packham DK, Rasmussen HS, Lavin PT, El‐Shahawy MA, Roger SD, Block G, Qunibi W, Pergola P, Singh B. Sodium zirconium cyclosilicate in hyperkalemia. N Engl J Med. 2015;372:222–231. [DOI] [PubMed] [Google Scholar]
- 15. Roscioni SS, Lambers Heerspink HJ. Clinical trials: new nonabsorbable potassium‐exchange resins in hyperkalaemia. Nat Rev Nephrol. 2015;11:205–206. [DOI] [PubMed] [Google Scholar]
- 16. Dillon JJ, DeSimone CV, Sapir Y, Somers VK, Dugan JL, Bruce CJ, Ackerman MJ, Asirvatham SJ, Striemer BL, Bukartyk J, Scott CG, Bennet KE, Mikell SB, Ladewig DJ, Gilles EJ, Geva A, Sadot D, Friedman PA. Noninvasive potassium determination using a mathematically processed ecg: proof of concept for a novel “blood‐less, blood test”. J Electrocardiol. 2015;48:12–18. [DOI] [PMC free article] [PubMed] [Google Scholar]
- 17. Seena V, Jerrin Y. A review on feature extraction and denoising of ECG signal using wavelet transform. 2014 2nd International Conference on Devices, Circuits and Systems (ICDCS). 2014:1–6.
- 18. Zidelmal Z, Amirou A, Adnane M, Belouchrani A. QRS detection based on wavelet coefficients. Comput Methods Programs Biomed. 2012;107:490–496. [DOI] [PubMed] [Google Scholar]
- 19. Hamming RW. Numerical Methods for Scientists and Engineers. New York: Dover Publications; 2012. [Google Scholar]
- 20. Helfenbein ED, Ackerman MJ, Rautaharju PM, Zhou SH, Gregg RE, Lindauer JM, Miller D, Wang JJ, Kresge SS, Babaeizadeh S, Feild DQ, Michaud FP. An algorithm for QT interval monitoring in neonatal intensive care units. J Electrocardiol. 2007;40:S103–S110. [DOI] [PubMed] [Google Scholar]
- 21. Zhang Q, Manriquez AI, Medigue C, Papelier Y, Sorine M. An algorithm for robust and efficient location of T‐wave ends in electrocardiograms. IEEE Trans Biomed Eng. 2006;53:2544–2552. [DOI] [PubMed] [Google Scholar]
- 22. Kalman RE. A new approach to linear filtering and prediction problems. J Basic Eng. 1960;82:35–45. [Google Scholar]
- 23. Kosiborod M, Rasmussen HS, Lavin P, Qunibi WY, Spinowitz B, Packham D, Roger SD, Yang A, Lerma E, Singh B. Effect of sodium zirconium cyclosilicate on potassium lowering for 28 days among outpatients with hyperkalemia: the HARMONIZE randomized clinical trial. JAMA. 2014;312:2223–2233. [DOI] [PubMed] [Google Scholar]
- 24. Yan GX, Antzelevitch C. Cellular basis for the normal T wave and the electrocardiographic manifestations of the long‐QT syndrome. Circulation. 1998;98:1928–1936. [DOI] [PubMed] [Google Scholar]
- 25. Choe S. Potassium channel structures. Nat Rev Neurosci. 2002;3:115–121. [DOI] [PubMed] [Google Scholar]
- 26. Corsi C, DeBie J, Napolitano C, Priori S, Mortara D, Severi S. Validation of a novel method for non‐invasive blood potassium quantification from the ECG. Comput Cardiol. 2012; 105–108. [Google Scholar]
- 27. Kania M, Rix H, Fereniec M, Zavala‐Fernandez H, Janusek D, Mroczka T, Stix G, Maniewski R. The effect of precordial lead displacement on ECG morphology. Med Biol Eng Comput. 2014;52:109–119. [DOI] [PMC free article] [PubMed] [Google Scholar]
- 28. Nguyen UC, Potse M, Regoli F, Caputo ML, Conte G, Murzilli R, Muzzarelli S, Moccetti T, Caiani EG, Prinzen FW, Krause R, Auricchio A. An in‐silico analysis of the effect of heart position and orientation on the ECG morphology and vectorcardiogram parameters in patients with heart failure and intraventricular conduction defects. J Electrocardiol. 2015;48:617–625. [DOI] [PubMed] [Google Scholar]
Associated Data
This section collects any data citations, data availability statements, or supplementary materials included in this article.
Supplementary Materials
Video S1. This temporal‐progression video demonstrates time‐lapsed ECG changes during dialysis, together with the automated T wave right slope and calculated ECG feature and blood potassium values. The video demonstrates how the signal‐processed ECG tracks with potassium changes during a dialysis run, compressing changes that occur in 216 minutes into 1.5 minutes.


