

Abstract
Background
Exosomes derived from mesenchymal stem cells (MSCs) were proved to boost cell proliferation and angiogenic potency. We explored whether cardiac stem cells (CSCs) preconditioned with MSC exosomes could survive and function better in a myocardial infarction model.
Methods and Results
DiI‐labeled exosomes were internalized with CSCs. They stimulated proliferation, migration, and angiotube formation of CSCs in a dose‐dependent manner. In a rat myocardial infarction model, MSC exosome–preconditioned CSCs had significantly better survival, enhanced capillary density, reduced cardiac fibrosis, and restored long‐term cardiac function. MicroRNA profiling analysis revealed that a set of microRNAs were significantly changed in CSCs after MSC exosome treatment.
Conclusions
Pretreatment of CSCs with MSC exosomes provided a promising strategy to improve survival and angiogenic potency of CSCs.
Keywords: angiogenesis, cardiac stem cells, exosomes, miRNA profiling, proliferation
Subject Categories: Angiogenesis, Cell Therapy, Stem Cells, Translational Studies, Myocardial Infarction
Introduction
The discovery of cardiac resident c‐kit+ cells aroused much interest among the cardiologists at the beginning of the century.1 These cells are self‐renewing, clonogenic, and multipotent and possess the potential to differentiate into all cardiovascular lineages.2 Thereafter, preclinical and clinical studies have provided plentiful evidence for the capacity of cardiac stem cells (CSCs) to improve cardiac function.3, 4 However, one of the critical problems faced by CSCs is the poor engraftment after transplantation.5 Therefore, researchers are focusing on developing next‐generation CSC products that will enhance the engraftment and regenerative capabilities of these cells.
Exosomes are small vesicles, 30 to 100 nm in diameter, containing a wide range of functional proteins, mRNAs, and microRNAs (miRNAs).6 As an intracellular messenger, exosomes play an important role in cell‐to‐cell communication. The discovery of MSC exosomes (MSC‐Exo) could be traced back to 2006; at that time, Gnecchi et al reported that the conditioned medium of Akt‐overexpressing mesenchymal stem cells (MSCs) significantly limits infarct size and improves ventricular function of infarcted hearts.7 They proposed for the first time that the therapeutic benefits of Akt‐MSCs, at least in the acute phase of myocardial infarction (MI), appear to be attributable primarily to the paracrine effects of the cells. Further, Lai et al demonstrated that MSCs mediated its cardioprotective paracrine effect by secreting exosomes.8 And MSC‐Exo could protect cardiac tissue from ischemic injury by means of promoting blood vessel formation, in accordance with reduced infarct size and preserved cardiac systolic and diastolic performance.9 MSC‐Exo were also reported to promote migration of a breast cancer cell line through Wnt signaling pathway.10 At the same time, Hare et al reported that injection of exogenous MSCs could recruit endogenous CSCs to the ischemic and border zones of the infarcted hearts and promote their expansion.11 Considering the potential role of MSC‐Exo on cardioprotection, together with the effect of exogenous MSCs on endogenous CSCs, we sought to determine whether CSCs preconditioned with MSC‐Exo could survive and function better in an MI model.
We isolated and characterized MSC‐Exo and evaluated their effects on CSCs in vitro. DiI‐labeled exosomes were internalized by CSCs. They stimulated proliferation, migration, and angiotube formation of CSCs in a dose‐dependent manner. In a rat MI model, MSC‐Exo–preconditioned CSCs significantly enhanced the capillary density, reduced the cardiac fibrosis, and restored the cardiac function. miRNA profiling analysis revealed that a set of miRNAs were significantly changed in CSCs on MSC‐Exo treatment, which may explain the enhanced proliferative, migratory, and angiogenic capacities in the cells. In conclusion, we found a way to boost the engraftment and neovascularization of transplanted cells.
Materials and Methods
Ethics Statement
All animals were obtained from the Experimental Animal Center of Soochow University (Suzhou, China). Animal experiments were approved by the Institutional Animal Care and Use Committee of Soochow University. All the procedures were in compliance with the “Guide for the Care and Use of Laboratory Animals” approved by Directive 2010/63/EU.
Isolation and Culture of Bone Marrow MSCs
Bone marrow MSCs were isolated from Sprague–Dawley (SD) rats (80–100 g) as previously described.12 In brief, total bone marrow cells were flushed with culture medium from the femur and tibia and seeded in culture dishes containing Dulbecco's modified Eagle's medium‐low glucose (DMED‐LG) (HyClone) supplemented with 10% fetal bovine serum (FBS) (Gibco) and penicillin (100 U/mL)/streptomycin (100 μg/mL) (HyClone). Then, cells were incubated at 37°C in a humidified atmosphere containing 5% CO2. The first medium change was performed to remove the nonadherent cells at 48 hours. When grown to 90% confluence, cells were harvested with 0.25% trypsin (Sigma) and passaged at a ratio of 1:3. The MSCs (passage 3 [P3]) were identified by flow cytometry with antibodies against CD90‐FITC (Fluorescin isothiocyanate), CD29‐FITC, CD44‐PE (P‐phycoerythrin), and CD34‐PE (Biolegend). MSCs at P3 to P5 were used for the experiment described later.
Harvest and Identification of MSC Exosomes
MSCs were cultured in DMEM‐LG supplemented with 10% FBS, which was previously centrifuged at 100 000g to 110 000g for 8 to 10 hours to eliminate preexisting bovine‐derived exosomes.13 After 48 hours, exosomes derived from MSC‐Exo were isolated by using Exo‐Quick‐TCTM (System Bioscience) according to the user manual. In brief, the culture supernatant was collected and centrifuged at 3000g for 15 minutes to remove cells and cell debris. Then, 2 mL of ExoQuick‐TC Exosomes Precipitation Solution was added to 10 mL of the supernatant. This was mixed well and refrigerated overnight. After that, the mixture was centrifuged at 1500g for 30 minutes, and the supernatant was removed. The residual solution was centrifuged at 1500g for 5 minutes and aspirated. The exosome pellet was resuspended in the appropriate buffer and stored at −80°C for the use in the experiments described later.
By using a BCA protein assay kit (Pierce), the amount of MSC‐Exo was detected by measuring total protein content.14 Then, exosomes were observed directly under the transmission electron microscope (Hitachi H‐7650), and the photographs were taken at the same time. By using Image‐Pro Plus 6.0 software, the exact size of the exosomes was measured. In addition, the MSC‐Exo were identified by using flow cytometry with antibodies against CD63 (Abcam), which was previously described for specific exosome markers.15 MSC‐Exo were prebound to aldehyde/sulfate latex beads (4 μm; Molecular Probes; Invitrogen) to amplify channel signal, because the signals of exosomes were too small to be captured with flow cytometry. Further, CD63 (Abcam) in exosomes was also detected with Western blot analysis.
Isolation and Culture of c‐kit+ CSCs
CSCs were isolated from the hearts of neonatal SD rats (3–5 days old) according to the previous methods1 with a minor modification. Briefly, the hearts were harvested from rats and minced into 1‐ to 2‐mm3 pieces, washed with phosphate‐buffered solution (PBS), and digested 3 times for 15 minutes at 37°C with 0.1% II collagenase (Worthington). The cell suspension after enzymatic digestion was collected and filtered with a strainer. Then, the mixed cells were incubated with anti–c‐kit biotin antibody (Sigma) and isolated through the use of anti‐biotin immunomagnetic microbeads (Miltenyi). The newly sorted c‐kit+ cells were grown in the fibronectin‐coated 60‐mm culture dish at 37°C and 5% CO2. The expansion medium contained DMEM‐high glucose (Hyclone), 10% FBS (Gibco), 10 ng/mL basic fibroblast growth factor (Sigma), 10 ng/mL leukemia inhibitory factor (Sigma), and 5 U/L human erythropoietin (Sigma). When passaged, CSCs was digested by using Accutase (Millipore), which caused less damage to the cells. To detect the purity of the isolated CSCs, they (P0) were identified by flow cytometry with antibody against c‐kit. To identify the ability of differentiation, the CSCs (P3) were stained with immunofluorescence antibodies against desmin, Connexin‐43, α–smooth muscle actin, and CD31 (Abcam). In addition, the CSCs (P0) were stained with immunofluorescence antibody against Ki‐67 (Abcam).
Internalization of DiI‐Labeled Exosomes Into CSCs
CSCs at P2 were harvested and seeded in fibronectin‐coated dishes to be maintained at 37°C overnight. In brief, MSC‐Exo were labeled with 1 μg/mL DiI (Invitrogen) as previously described.16 Then, exosomes were washed in PBS with centrifugation at 100 000g for 2 hours to remove unbound DiI. DiI‐labeled exosomes at a concentration of 10 μg/mL were added to the culture medium of CSCs for 6 hours. CSCs were then washed in PBS, fixed in 4% paraformaldehyde, and stained with 1 mg/mL 4′,6‐diamidino‐2‐phenylindole (DAPI) (Invitrogen) for 15 minutes. Finally, the fluorescence was observed by using a fluorescent microscope (Olympus).
Cell Proliferation Assay
The effects of MSC‐Exo on the proliferative status of CSCs were determined by using the CCK8 assay. Briefly, CSCs were seeded at 5000 cells per well onto 96‐well plates. Different doses of MSC‐Exo (0, 100, 200, 400, and 800 μg/mL) were added to the culture medium, and then CSCs were cocultured with exosomes for 72 hours. The value of optical density was measured at 450 nm with use of the microplate reader (Synergy H1; BioTek).
Transwell Assay
Migration of CSCs was assessed by using Transwell chambers (8.0‐μm pore size, Corning Costar; Corning). Ten thousand cells in serum‐free medium were added to the upper chamber, and 500 μL of media supplemented with MSC‐Exo at the indicated concentrations was added to the bottom well. Cells were incubated for 6 hours at 37°C, and then nonmigrated cells were removed with cotton swabs. Cells that migrated to the bottom of the membrane were then fixed with 4% paraformaldehyde and stained with 1 mg/mL DAPI for 15 minutes. The fluorescence of nuclei was observed with the microscope and counted in 5 representative fields.
Tube Formation Assay
The formation of a tube‐like structure was determined by tube formation assay on Matrigel (BD Bioscience). CSCs were plated on top of Matrigel (300 μL/well) and treated with different doses of MSC‐Exo (0, 100, 200, 400, and 800 μg/mL) for 24 hours. A triple number of wells were set for each concentration. Tube formation was examined via microscopy (Olympus), and the length of the tube structure was quantified by randomly selecting 5 fields per well with the use of Image J software as previously described.9
MI and Implantation of CSCs
MI was induced in 30 male SD rats (250–300 g) as previously reported with a slight modification.11, 17, 18, 19 Animals were anesthetized with tribromoethanol (Avertin, 300 mg/kg; Sigma) intraperitoneally for 1 time. Then, rats were incubated via tracheotomy, and the thoracotomy was performed. After the left ventricle was exposed satisfactorily, MI was achieved through ligation of the left anterior descending coronary artery. Successful induction of MI was verified by color change immediately in the infarct and obvious electrocardiogram lead I and aVL ST‐segment elevation after ligation. Then, the thoracic incision was closed carefully.
Forty‐eight hours later, rats were reincubated and reventilated, and the thoracotomy was reoperated. Then, the heart was sufficiently exposed to reveal the border zones of the infarct. To trace CSCs stably in vivo, cells were transduced with lentiviral vector (pGLVH1/green fluorescent protein [GFP]; Genepharma) at a multiplicity of infection of 50. After 24 hours' incubation, culture medium was changed. Transduction efficiency was determined based on observation under the fluorescent microscope 96 hours after transduction. Next, 500 000 cells were injected in 4 sites surrounding the infarct zones. Rats were randomly divided into 3 groups. Ten rats were injected with CSCs (CSCs group). Ten rats were injected with CSCs that were preconditioned with 400 μg/mL MSC‐Exo for 24 hours (CSCsExo group). And 10 sham‐operated rats were injected with saline (control group). Intraperitoneal injection of penicillin (1.5×10⁵ U/mL) was performed postoperatively.
Cardiac Function and Myocardial Infarct Size
Rats were anesthetized with 1.0% inhaled isoflurane, and echocardiography was performed to evaluate cardiac function just at baseline and then 7 and 28 days after MI with use of a 12‐MHz transducer (SONOS 7500; Philips Medical Systems); this procedure was repeated 3 times with use of the same equipment by the same examiner. The left ventricular (LV) end‐diastolic and end‐systolic dimensions, LV ejection fraction (LVEF), and LV fractional shortening were calculated as previously described.20 All procedures and analysis were performed by an experienced researcher who was blinded to treatment.
Twenty‐eight days after MI, animals were euthanized to remove the hearts, and infarct size was determined with the use of Masson trichrome staining (Sigma). In brief, the hearts were simply trimmed to eliminate the upper part of ligation after immersion in 4% formaldehyde for 48 hours. The remainder of the heart was cut into about 5‐mm specimens perpendicular to the axis of the left anterior descending coronary artery, to be mounted on plastic and processed with paraffin embedding. Thus, 4 μm of paraffin tissue section was produced. To elucidate the severity of myocardial fibrosis, the slices were stained with Masson trichrome to measure the average ratio of the fibrotic area to the entire LV cross‐sectional area (fibrosis area %) and the average ratio of fibrosis length to entire internal LV circumference (fibrosis length %), with the use of Image J software.21, 22, 23
Immunofluorescence Staining
For detection of neovascularization, 1 mg/mL Griffonia (Bandeiraea) simplicifolia lectin 1 (BS1 lectin; Vector) was injected into the LV via direct cardiac puncture before MI‐induced rats were euthanized. After dewaxing, the sections were stained with goat anti‐BS1 lectin antibody (1:100; Vector) and then washed with PBS and stained with Alexa Fluor 594 rabbit anti‐goat IgG (1:500; Invitrogen) at room temperature for 1 hour. Nuclei were counterstained with DAPI (Abcam, 1:1000) included in aqueous mounting medium. With the use of a fluorescence microscopy (Olympus, Japan), the fluorescence of capillaries in the peri‐infarcted area was imaged for ≥8 random high‐power fields (HPFs) on each section. The results were showed as the density of capillary per HPF.
To detect differentiation of transplanted CSCs into endothelial cells, the sections were stained with Alexa Fluor 488 anti‐GFP antibody (1:500; Abcam) at room temperature for 1 hour after fluorescent staining with BS1 lectin. To detect arterioles, we stained the sections with anti–α–smooth muscle actin antibody (1:250: Dako), washed them with PBS, and stained them with Alexa Fluor 594 donkey anti‐mouse IgG2a (1:1000; MP/Invitrogen) at room temperature for 1 hour. With the use of aqueous mounting medium with DAPI, sections were mounted and nuclei were counterstained. Images were observed by using a fluorescence microscope (Olympus). The numbers of arterioles and CSCs that differentiated into endothelial cells were counted in the peri‐infarcted area.
miRNA Array Experiment and Analysis
Total RNA was extracted from CSCsExo and CSCs by using Qiagen miRNeasy Mini Kit. Global expression patterns of miRNAs were then examined by using Affymetrix GeneChip miRNA 4.0 arrays. The Affymetrix GeneChip miRNA 4.0 array was designed based on miRBase version 20 (www.mirbase.org). The arrays included 36 249 probe sets and targeted 728 and 490 rat mature and pre‐miRNAs, respectively. One microgram of total RNA was used as input into the labeling reaction as recommended by the protocol of the Genisphere FlashTag Biotin RNA Labeling Kit. Labeled miRNA was then hybridized to the array for 16 hours at 48°C and 60 rpm. Genechips were then scanned by using the Hewlett Packard Gene Array Scanner G3000 7G (Affymetrix). Expression data were generated by Affymetrix Expression Console software and normalized according to the MAS5 method.24 The RVM t test was applied to filter the differentially expressed genes for the control and experiment group. Differentially expressed genes were defined by using a P‐value threshold and fold‐change analysis. The threshold of truly significant genes was taken to be P<0.05 and fold change >2.0. Unsupervised hierarchical clustering was performed by using Cluster 3.0 and Java TreeView software. The miRNA targets were predicted with TargetScan and Miranda software. The predicted targets of the differentially expressed miRNAs were then analyzed in terms of their gene ontology (GO) categories and pathways using 2‐side Fisher exact test and χ2 test. Differentially miRNA target genes in significant GO and pathway categories, obtained from GO and pathway analyses, were analyzed by miRNA–target gene network. The relationship of the miRNAs and target genes was counted based on their differential expression values and according to the interactions of miRNA and target genes in Sanger miRNA database to build the miRNA–target gene network. In the miRNA–target gene network, the circle represents target gene and the shape of square represents miRNA, and their relationship is represented by 1 edge. The center of the network was represented by degree. The degree of each miRNA was the number of genes regulated by that miRNA, and the degree of each gene was the number of miRNAs which regulated the gene. The core miRNAs in the network always have the highest degrees.
Statistical Analysis
Data were given as mean±SD. Statistical significance between 2 groups was determined by nonparametric test (Mann–Whitney test). Comparisons between multiple groups were specified for significance by Kruskal–Wallis test, with Dunn's posttest to compare all pairs of groups. P<0.05 was considered to indicate significant difference.
Results
Identification and Characterization of Exosomes Secreted by Rat Bone Marrow MSCs
The morphological characteristic of rat bone marrow MSCs was observed under a light microscope (Figure 1A). Based on flow cytometry, MSCs were positive for CD29, CD44, and CD90 but negative for CD34 (Figure 1B), as previously reported. The protein content of exosomes that were isolated from the supernatants of MSCs was 1879±81 μg/mL as detected with the BCA kit. To identify the harvested MSC‐Exo, on the one hand, the morphology of exosomes was observed under a transmission electron microscope. They were round and hypodense in the center, and they varied in size (Figure 2A). The mean diameter was 46.55±11.64 nm (range 11–98 nm) as measured with Image‐Pro Plus software (Figure 2B). On the other hand, the protein markers were detected in the exosomes. Flow cytometry analysis showed that exosomes expressed a high level of CD63 (Figure 2C). Western blot analysis further confirmed that exosomes was positive for CD63 (Figure 2D).
Figure 1.
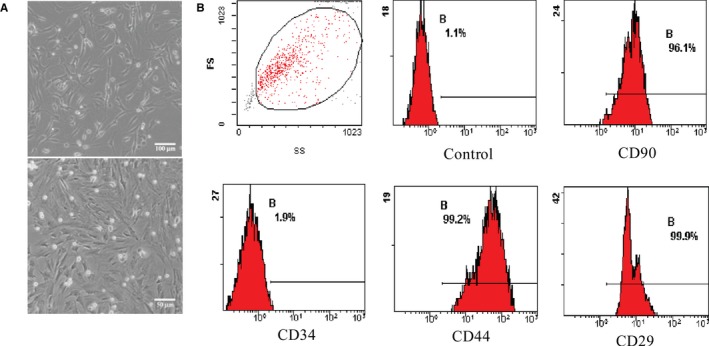
Characterization of rat bone marrow mesenchymal stem cells (MSCs). A, The morphology of MSCs was observed under microscope. B, Representative fluorescence‐activated cell sorting (FACS) analysis of MSCs expressing antigens for CD90, CD34, CD44, and CD29. FS, fractional shortening.
Figure 2.
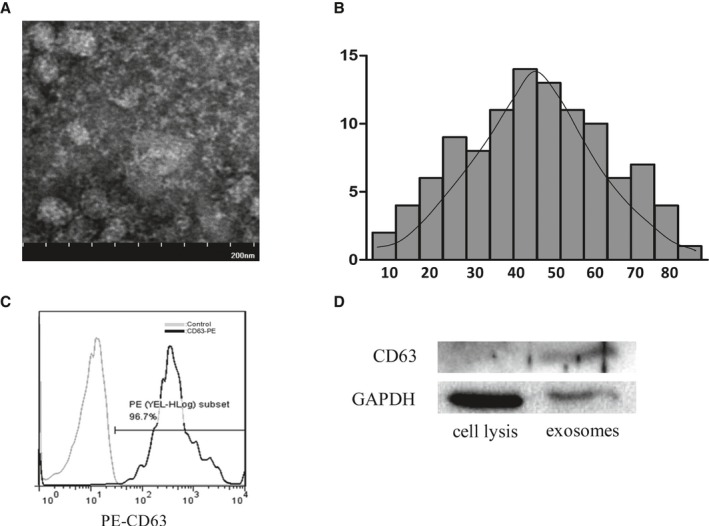
Identification of mesenchymal stem cell (MSC) exosomes (MSC‐Exo). A, The morphology of MSC‐Exo was observed under an electron microscope. Bar, 200 nm. B, The diameter distribution of MSC‐Exo was measured by Image‐Pro Plus software. C, The phenotype of MSC‐Exo for CD63 was identified by fluorescence activated cell sorting (FACS) analysis. D, Western blot analysis of CD63 protein was detected in MSC‐Exo.
Identification and Characterization of c‐kit+ CSCs From the Rat Hearts
Compared with unsorted cardiac cells (Figure 3A), the proportion of harvested c‐kit+ CSCs by MACS (Magnetic‐activated cell sorting) reached a high level (Figure 3B), and met the experimental requirements. Under light microscopy, c‐kit+ CSCs were small, round, and bright (Figure 3C) and positively stained for anti–c‐kit antibody (Figure 3D). Further, c‐kit+ CSCs were characterized through the ability of differentiation. Immunofluorescence staining demonstrated that differentiated CSCs could express cardiomyocyte specific protein (desmin, connexin‐43, Figure 3E), smooth muscle specific protein (α‐SMA, Figure 3E), and endothelium specific protein (CD31, Figure 3F), while these markers could not be detected in CSCs before differentiation. In addition, proliferation of c‐kit+ CSCs was determined by immunofluorescence staining positive for Ki‐67 (Figure 3G)
Figure 3.

Identification of c‐kit+ cardiac stem cells (CSCs). The percentages of c‐kit for CSCs were performed by FACS analyses before (A) and after (B) Magnetic‐activated cell sortin (MACS). The morphology of c‐kit+ CSCs was observed under light microscopy. Bar, 250 μm, (C). Immunofluorescence for c‐kit was observed in the MACS‐sorted CSCs. Bar, 200 μm, (D). The differentiation of c‐kit+ CSCs was detected by immunofluorescence for cardiomyocyte specific protein (desmin, connexin‐43, smooth muscle specific protein [α‐SMA]), bar, 100 μm (E), and endothelial specific protein (CD31), bar, 20 μm (F). The proliferation of c‐kit+ CSCs was observed for immunofluorescent Ki‐67. Bar, 20 μm (G).
Internalization of MSC‐Exo Into CSCs
To study whether MSC‐Exo could be internalized into CSCs, MSC‐Exo were labeled with the fluorescent dye DiI. After DiI‐labeled exosomes were cocultured with CSCs for 6 hours, internalization of MSC‐Exo was observed under a fluorescent microscope (Figure 4). The red fluorescence in exosomes was localized in the cytoplasm of CSCs, implying that DiI‐labeled exosomes had successfully been internalized by CSCs.
Figure 4.
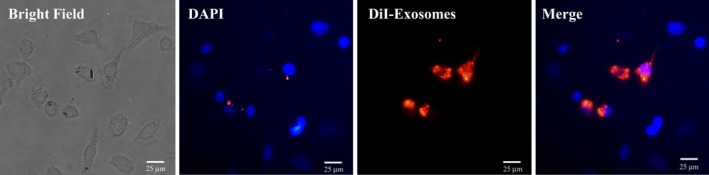
Cellular internalization of mesenchymal stem cell (MSC)‐Exo into c‐kit+ cardiac stem cells (CSCs). DiI‐labeled MSCs‐Exo (red) were internalized into DAPI‐labeled CSCs (blue). Bar, 25 μm.
MSC‐Exo Promoted Proliferation, Migration, and Tube Formation of CSCs
MSC‐conditioned medium has been reported to induce proliferation of rat CSCs, but whether MSC‐Exo contribute to this effect remains unsolved. Here, using the CCK‐8 assay, we found that CSCs exhibited an enhanced proliferative capacity in a dose‐dependent manner after treatment with MSC‐Exo (Figure 5A).
Figure 5.
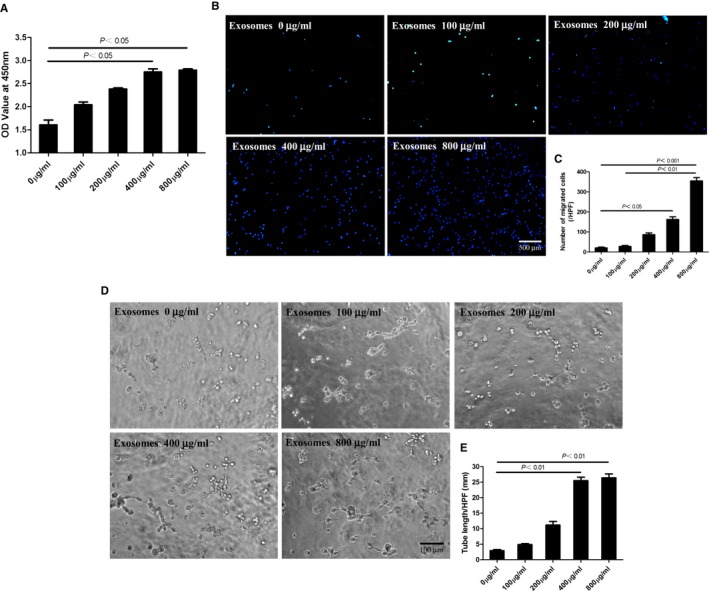
Mesenchymal stem cells (MSCs)‐Exo enhanced in vitro proliferation, migration, and tube formation of c‐kit+ cardiac stem cells (CSCs) in a dose‐dependent manner. The c‐kit+ CSCs were incubated in the presence of different concentrations of MSCs‐Exo. A, After culture for 72 hours, proliferative capacity of CSCs was significantly improved dose‐dependently using CCK8 assay. B, Cell migration capacity was tested by transwell assay. The representative images were shown and the number of migrating cells per high‐power field was provided in different groups. Bar, 100 μm. C, Numbers of migrated cells were analyzed by Prism 5 software (n=5). D, Tube formation of CSCs in vitro in Matrigel. The representative images of capillary‐like structure were shown, and the length of tube per high field in different groups was measured by Image J software. Bar, 100 μm. E, Statistical analysis of tube length (n=5). The P values for comparison were indicated in the images, respectively.
In addition, a transwell assay was established to quantitatively determine the migration of CSCs. As shown in Figure 5B and 5C, the number of migrating CSCs significantly increased after treatment with MSC‐Exo in a dose‐dependent manner.
Further, we explored the effect of MSC‐Exo on the angiogenic ability of CSCs, by using a Matrigel assay. The result showed that MSC‐Exo dose dependently promoted tube formation of CSCs and reached a peak at 400 μg/mL (Figure 5D and 5E).
Enhanced Endothelial Cell Differentiation, Neovascularization, and Reduced Fibrosis in Ischemic Hearts by CSCsExo Transplantation
To track the injected cells in vivo for 28 days, CSCs were transduced with lentiviral vector‐GFP and further identified by anti‐GFP antibody (green). For detection of capillaries, BS1 lectin was injected into the LV via direct cardiac puncture before MI‐induced rats were euthanized. The capillary density in the peri‐infarct zone was revealed through immnunofluorescent staining of BS1 lectin (red). The cells in CSCsExo group were preconditioned with 400 μg/mL MSC‐Exo for 24 hours, as this concentration had a significant peak effect on tube formation of CSCs. Double fluorescent immunostaining of ischemic myocardium revealed that CSCsExo colocalized more with vessels perfused with BS1 lectin than did nontreated CSCs, implying that endothelial differentiation of CSCs was promoted by MSC‐Exo preconditioning (CSCsExo: 7±1.6 cells/HPF; CSCs: 2.8±1.7 cells/HPF; CSCExo versus CSCs, P<0.05) (Figure 6A and 6B). The average numbers of capillaries per HPF were significantly higher in the CSCsExo group compared with the CSCs and control groups (CSCsExo: 96.6±8.7/HPF, CSCs: 64.6±10.4/HPF, control: 14±3.5/HPF; P<0.05, CSCsExo versus CSCs and control groups) (Figure 7A and 7B). Meanwhile, the average numbers of arterioles per HPF also evidently increased in the CSCsExo group compared with the CSCs and control groups (CSCsExo: 19.8±2.5/HPF, CSCs: 11.5±2.4/HPF, control: 4.5±1.7/HPF; P<0.05, CSCsExo versus CSCs and control groups) (Figure 7C and 7D). This indicated that CSCs preconditioned with MSC‐Exo could boost neovascularization on ischemic heart, which is in line with the in vitro data.
Figure 6.
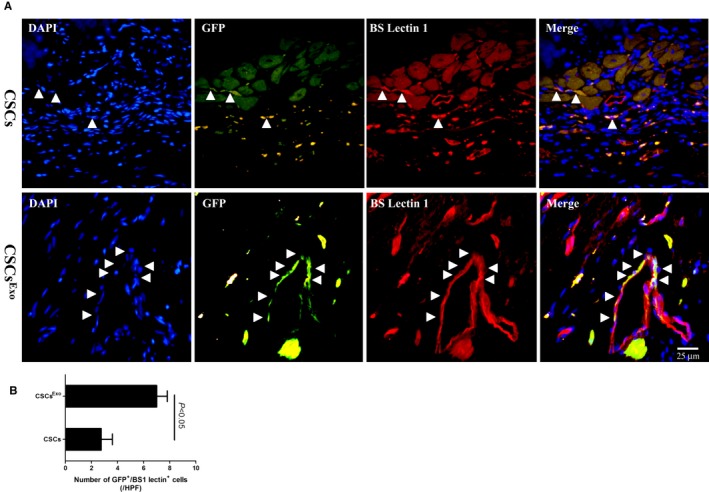
Differentiation of transplanted cardiac stem cells (CSCs) into the neovasculature in the peri‐infarct myocardium. CSCs were transduced with lentiviral vector–green fluorescent protein (GFP), to be stably traced in vivo. CSCsExo were preconditioned with 400 μg/mL mesenchymal stem cells (MSCs)‐Exo for 24 hours, and CSCs were injected into the peri‐infarct zones 2 days after myocardial infarction induction. Heart samples were harvested following BS1 lectin systemic perfusion 28 days after cell injection. A, The transplanted CSCs that had differentiated into endothelial cells were visualized by immunofluorescence costaining for GFP (green) and BS1 lectin (red), in both groups. Bar, 25 μm. B, The numbers of transplanted cells that colocalized with capillaries were counted under a fluorescence microscope separately and averaged. CSCsExo vs CSCs, P<0.05; n=4.
Figure 7.
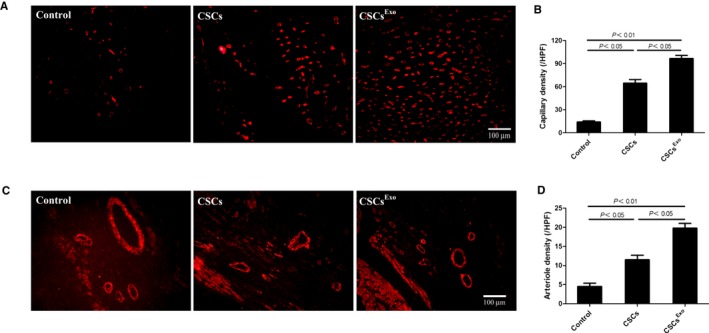
Histological analysis for capillary density in the peri‐infarct myocardium. Cardiac stem cells (CSCs)Exo were preconditioned with 400 μg/mL mesenchymal stem cells (MSCs)‐Exo for 24 hours), CSCs, and PBS control were injected into the peri‐infarct zones 2 days after myocardial infarction induction. Heart samples were harvested following BS1 lectin systemic perfusion 28 days after cell transplantation. A, Capillaries were immunofluorescently observed as tubular structure perfused with BS1 lectin (red). Bar, 100 μm. B, The numbers of capillaries were counted in the peri‐infarct zone and averaged in each group (n=5). C, Hearts sections were stained with anti–α–smooth muscle actin (SMA) antibody (red) to detect arterioles in the peri‐infarct zone. Bar, 100 μm. D, The numbers of arterioles were counted and averaged in each group (n=4).
To evaluate the size of MI, Masson trichrome staining was performed 28 days after CSC transplantation. As shown in Figure 8A, the blue represents fibrotic tissue and the red shows normal myocardium. Through quantitative analyses with the use of Image J software, we found that the percentage of fibrotic area in the entire LV cross‐sectional area and the percentage of fibrosis length in the entire internal LV circumference were both significantly reduced in the CSCsExo group compared with the CSCs and control groups (Figure 8B and 8C).
Figure 8.
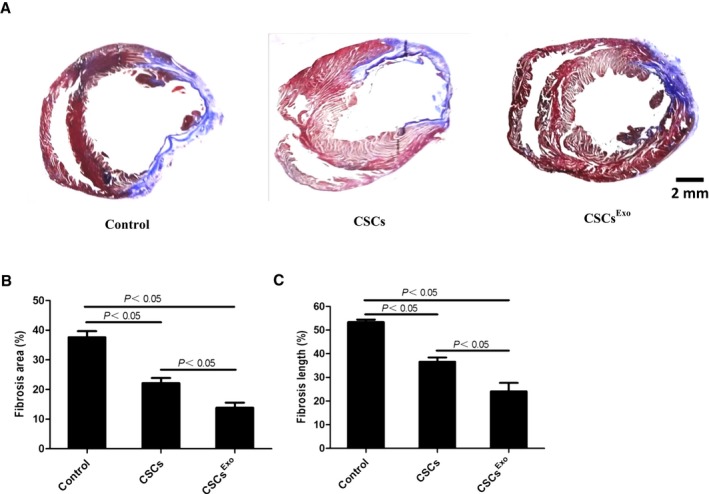
Histological analysis for myocardial infarction (MI) sizes in each group. Cardiac stem cells (CSCs)Exo were preconditioned with 400 μg/mL mesenchymal stem cells (MSCs) for 24 hours, and CSCs were injected into the peri‐infarct zones after MI induction. Heart samples were harvested 28 days after cell injection. A, Heart sections were stained with Masson trichrome: myocardium (red), scarred fibrosis (blue). The percentage of fibrotic area (B) and fibrosis length (C) was calculated and averaged (n=5) by using Image J software.
CSCsExo Effectively Preserved Cardiac Function After MI
Echocardiography was performed at baseline and 7 and 28 days after the MI surgery. As shown in Figure 9A and 9B, LVEF was not significantly different among the groups preoperatively. At 7 days after MI surgery, the LVEF was markedly increased in the CSCsExo and CSCs groups compared with the control group (CSCsExo: 49.9±0.3%, CSCs: 49.7±0.9%, control: 44.0±2.7%; P<0.05, control versus CSCs and CSCsExo groups). At 28 days postoperatively, LVEF was signally higher in the CSCsExo group, followed by the CSCs and control groups (P<0.05, CSCsExo versus CSCs and control groups).
Figure 9.
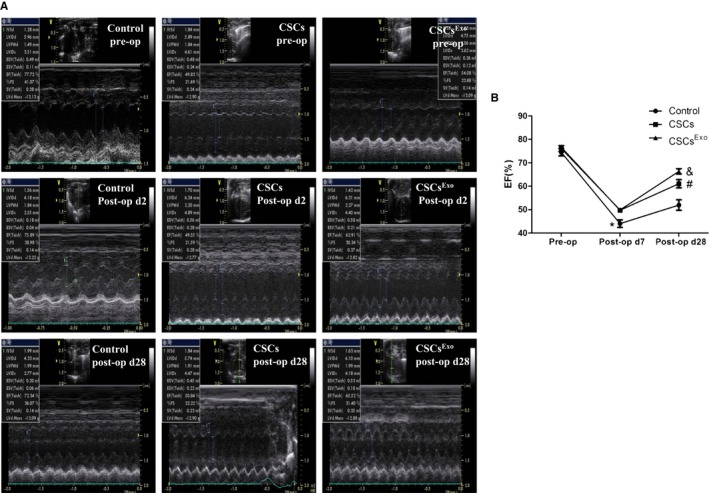
Functional analysis of rat hearts by echocardiography. A, Left ventricular ejection fraction (LVEF) was measured in the control, cardiac stem cells (CSCs). and CSCsExo‐injected groups. B, The changing tendency of LVEF preoperatively and 7 days and 28 days postoperatively was indicated (n=5). *Control vs CSCs and CSCsExo at postoperative day 7, P<0.05; & CSCsExo vs CSCs and control at postoperative day 28, P<0.05; # CSCs vs control at postoperative day 28, P<0.05.
Changes in miRNA Expression Profiles in CSCsExo and Validation of Selected miRNAs by Quantitative Polymerase Chain Reaction
To further investigate the effect of MSC‐Exo on CSCs, we analyzed the miRNA expression profiles of CSCs treated with or without MSC‐Exo for 3 days. The data obtained have been deposited in the NCBI Gene Expression Omnibus (GEO) database according to the MIAME guidelines (accession number GSE73598). The hierarchical cluster of miRNA expression (Figure 10A) showed that CSCsExo had an miRNA expression signature very different from that of untreated CSCs. Overall, 17 miRNAs, including miR‐147, let‐7i‐3p, miR‐503‐5p, and miR‐362‐3p, showed marked upregulation after MSC‐Exo treatment, 5 miRNAs (miR‐326‐5p, miR‐328a‐5p, miR‐207, miR‐760‐3pn, and miR‐702‐5p) showed evident downregulation in CSCsExo.
Figure 10.
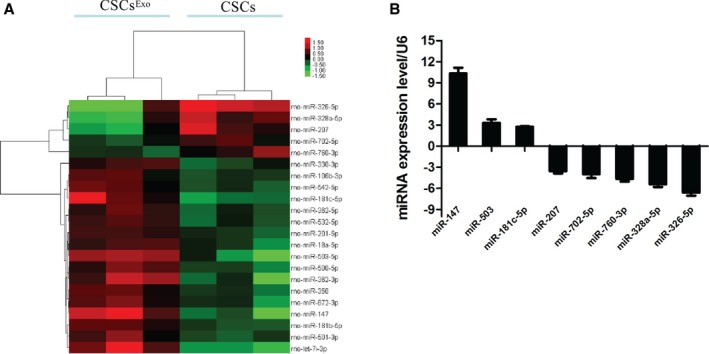
MicroRNA (miRNA) expression profiling and validation of microarray data. A, miRNA profiles differentiate cardiac stem cells (CSCs) treated with mesenchymal stem cell (MSC) exosomes from nontreated CSCs (n=3). Both downregulated (green) and upregulated (red) miRNAs were identified in CSCsExo. B, Validation of microarray data using real‐time RT‐PCR. Triplicate assays were done for each RNA sample, and the relative amount of each miRNA was normalized to U6 snRNA.
Differential miRNA expression in the networks was further validated by real‐time quantitative polymerase chain reaction. In total, 9 miRNAs were selected for validation. All tested miRNAs exhibited a high agreement with the array‐generated expression data. The expressions of miR‐326‐5p, miR‐328a‐5p, miR‐207, miR‐760‐3p, and miR‐702‐5p were significantly lower in the CSCsExo group compared with the CSCs group (Figure 10B), while miR‐147, miR‐503, and miR‐181c‐5p were significantly higher in the CSCs group after treatment (Figure 10B).
Target Prediction, Functional Enrichment, and Networks for miRNAs Significantly Changed in CSCsExo
The miRNAs are a class of 22‐nucleotide noncoding RNAs that regulate target genes through translational repression. Thus, identification of their regulatory targets is essential for miRNA functional studies. Target prediction was performed by using TargetScan and Miranda software. Supplemental data (Data S1) provided a detailed list of identified target genes. Specifically, 2‐sided Fisher exact test and χ2 test were used to classify the GO category and pathway. Enrichment provides a measure of the significance of the function: as the enrichment increases, the corresponding function is more specific, which helps us to find those GOs with more concrete function description in the experiment. After MSC‐Exo treatment, the target genes of differentially expressed miRNAs (Figure 11A) indicated a broad range of biological functions (Data S2). These genes were significantly enriched in angiogenesis (GO: 0001525), heart development (GO: 0007507), positive regulation of cell proliferation (GO: 0008284), positive regulation of cell migration (GO: 0030335), cell differentiation (GO: 0030154), and response to hypoxia (GO: 0001666) (Figure 11B). We also performed pathway analysis on these miRNAs target genes (Data S3). Specifically, signaling pathways associated with Wnt signaling pathway (path: 4310), Hippo signaling pathway (path: 4390), vascular endothelial growth factor (VEGF) signaling pathway (path: 4370), phosphatidylinositol 3‐kinase–Akt signaling pathway (path: 4151), endocytosis (path: 4144), and metabolic pathways (path: 1100) were found to be upregulated in CSCsExo (Figure 11C).
Figure 11.
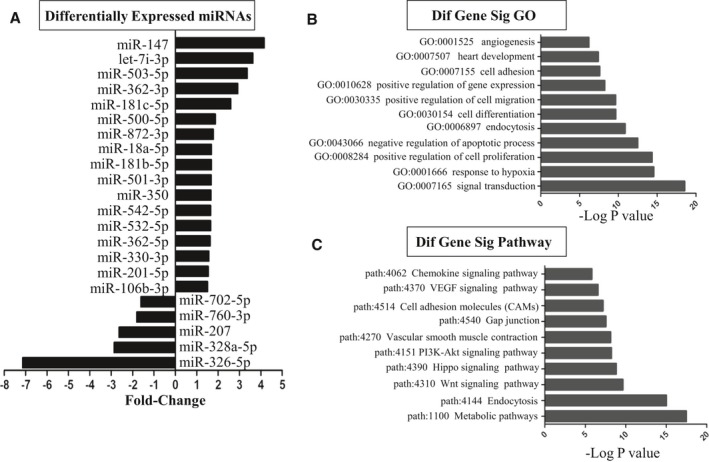
Differentially expressed microRNAs (miRNAs) and gene ontology (GO) and pathway analysis based on miRNA‐targeted genes. A, List of the differentially expressed miRNAs and the fold‐changes are indicated. B, GOs targeted by overexpressed or underexpressed miRNAs. All these GOs show increased enrichment. The vertical axis is the GO category, and the horizontal axis is the enrichment of GO. C, Pathways targeted by overexpressed or downexpressed miRNAs. The vertical axis is the pathway category and the horizontal axis is the enrichment of pathways.
To identify the putative functional modules, we constructed the miRNA gene network (Figure 12) based on the data sets consisting of miRNA–target gene binding information and expression profiles of miRNAs and mRNAs.21, 24 The network pointed out several central miRNAs with a high degree of enrichment, including rno‐miR‐760‐3p, rno‐miR‐207, rno‐miR‐328a‐5p, rno‐miR‐326‐5p, rno‐miR‐330‐3p, and rno‐miR‐702‐5p (Figure 12). rno‐miR‐760‐3p had the highest degree of regulation in the miRNA gene network; 189 target genes were upregulated in the mRNA expression profiles, followed by rno‐miR‐207 with 188 target genes and rno‐miR‐328a‐5p, rno‐miR‐326‐5p, rno‐miR‐330‐3p, and rno‐miR‐702‐5p with177, 166, 123, and 120 target genes in the network, respectively (Data S4). rno‐miR‐872‐3p and rno‐let‐7i‐3p, with a minor degree of regulation, had only 11 and 6 target genes included in the network (Data S4).
Figure 12.
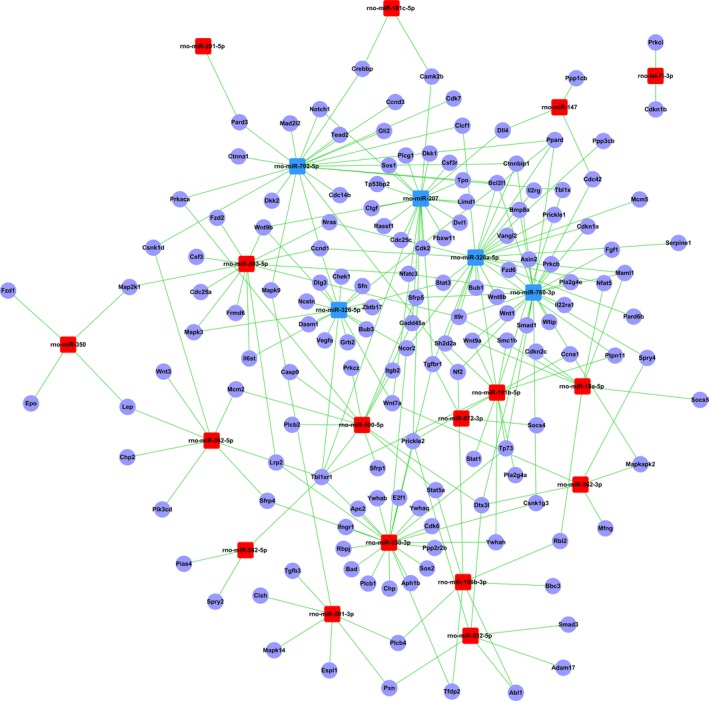
The microRNA (miRNA)–gene network. Blue and red box nodes represent miRNA, and purple cycle nodes represent mRNA. Edges describe the inhibitive effect of miRNA on mRNA. Blue box nodes show the underexpression microRNA–mRNA network, and red box nodes show the overexpression miRNA–mRNA network.
Among the 1031 target genes, 709 genes were targeted by only 1 miRNA in the network (eg, cdkn2c was targeted by miR‐18a‐5p) (Data S4). Then, 229 genes were targeted by 2 miRNAs, 67 genes were regulated by 3 miRNAs, and 26 genes were regulated by >3 miRNAs. For example, Kcnj6 (potassium inwardly rectifying channel, subfamily J, member 6) was regulated by 9 miRNAs (the highest degree of regulation in the network), followed by Tbl1xr1 [transducin (β) –like 1 X‐linked receptor 1] and Pip5k1c (hosphatidylinositol‐4‐phosphate 5‐kinase, type I, γ), which were regulated by 7 and 6 miRNAs in the network, respectively.
Discussion
Exosomes are small vesicles, 30–100 nm in diameter, that carry a wide range of functional proteins, mRNAs, and miRNAs. As intracellular messengers, exosomes play an important role in cell‐to‐cell communication. Recent studies demonstrated that extracellular vesicles derived from human bone marrow MSCs promoted angiogenesis in a rat MI model9 and that tube formation in endothelial cells could be enhanced by exosomes derived from hypoxic leukemia cells.25 Considering this, we proposed that CSCs preconditioned with exosomes derived from bone marrow MSCs could survive and function better in an MI model.
We observed that MSC‐Exo could be internalized by CSCs and that MSC‐Exo promoted the proliferation, migration, and angiogenic potency in CSCs. In an acute MI model, the treatment of CSCs with MSC‐Exo resulted in enhanced engraftment and capillary density, reduced fibrotic area, and a better cardiac outcome compared with CSCs only or the control. miRNA, shuttled by exosomes, was one of the most important factors controlling gene expression. Therefore, we evaluated the miRNA expression profile in CSCs treated with or without MSC‐Exo. In comparison with nontreated CSCs, microarray revealed a set of differentially expressed miRNAs, with 17 significantly upregulated and 5 significantly downregulated miRNAs in CSCsExo. Tests of miR‐326‐5p, miR‐328a‐5p, miR‐207, miR‐760‐3p, miR‐702‐5p, miR‐147, miR‐503, and miR‐181c‐5p further validated the reliability of micoarray hybridization. Previous studies to enhance CSC therapies included genetic modification, biomaterial approach, hypoxic preconditioning, and combination cell therapy,26 whereas pretreatment with MSC‐Exo on CSCs was performed in our study. To our knowledge, it is the first time that the protective effects of MSC‐Exo on CSCs in vitro and in vivo was studied and the changes in miRNA expression profiling in CSCs after treatment with MSC‐Exo were explored.
c‐kit+ CSCs possess the potential to differentiate into all cardiovascular lineages, including cardiomyocytes, endothelial cells, and smooth muscle cells,1 and when injected into the infarct region, they produced substantial new myocardium. Moreover, many laboratories reported that c‐kit+ CSCs hold a full cardiomyocyte differentiation capacity.11, 27, 28, 29, 30 In our study, we also observed the spontaneous differentiation of CSCs into cardiomyocytes in vitro. However, controversy exists regarding the differentiation ability of c‐kit+ CSCs. van Berlo et al suggests that new cardiomyocytes generated from CSCs are functionally insignificant.31 In fact, c‐kit+ lineage cell–derived cardiomyocytes exhibited a 3‐fold increase after MI compared with the normal condition.31 Intriguingly, a recent report by Dr J.M. Hare demonstrated that differentiation of c‐kit+ lineage cells into cardiomyocytes required the bone morphogenetic protein signaling pathway using induced pluripotent stem cells modeling.32 Therefore, the differentiation of c‐kit+ CSCs into cardiomyocytes could be supported by modulating the activity of bone morphogenetic protein pharmacologically or via transplantation of cells capable of regulating bone morphogenetic protein activity.
CSCs could directly differentiate into endothelial cells, secrete angiocrine signals, and differentiate into cardiomyocytes in vivo,33 which leads to a larger amount of vessel density, to the survival of cardiomyocytes in the ischemic border zone and to smaller areas of scar tissue in the cell‐treated hearts. MSCs‐Exo, containing a large amount of bioactive compounds, stimulated the proliferation and angiogenic potency of CSCs. Transplantation of CSCs treated with MSC‐Exo evidently increased capillary density and reduced the fibrotic area after acute MI, because of the enhanced angiogenic and cardiogenic potency of these cells.
In addition, GO enrichment analysis outlined the effects of exosomes on CSCs through high‐enriched GOs. Various phenotypes of CSCs, including proliferation, apoptosis, cell cycle, differentiation, migration, heart development, and angiogenesis, were pointed out, which was in accordance with the Kyoto encyclopedia of Genes and Genomes pathway analysis. The miRNA gene interaction networks further reveals the high regulatory role of miR‐760‐3p, which targets 189 genes in the network. Most of miR‐760‐3p target genes, such as Wnt1, Wnt9a, Egf, and PDGFb, are involved in cellular differentiation and angiogenesis. Wnt9a, a member of the Wnt family, was significantly elevated, thus inducing myogenic differentiation in C2C12 cells.34 Evidence supports the notion that Wnt4 and Wnt9a could antagonize the canonical Wnt signaling pathway, thus switching myoblast cells from cell proliferation to myogenic differentiation.34 Taking into account the results of pathway analysis, the Wnt signaling pathway is a most interesting pathway which needs deep investigation in the future work. The central convergent molecules VEGFa and VEGFb, targeted by miR‐326‐5p and miR‐207, respectively, are the most important proangiogenic agents that activate receptors on vascular endothelial cells and promote blood vessel regeneration.35 Because miR‐326‐5p and miR‐207 are both downregulated in CSCs treated with MSC‐Exo, it is highly probable that the VEGF signaling pathway is activated in the cells.
One of the primary barriers limiting the effectiveness of stem cell transplantation is the harsh ischemic microenvironment in which acute MI that would kill most of the injected cells. Preconditioning with MSC‐Exo may be a more viable therapeutic approach, because the cellular components in MSCs could be in CSCs in advance for administration after a subsequent ischemic event. Our results suggest that exosomes released from MSCs, acting as a shuttle, could stimulate the proliferation, migration, and angiogenic potency of CSCs in vitro and in vivo. Further, the miRNAs shuttled by MSC‐Exo may regulate the proliferation and differentiation of CSCs. The putative miRNA targets provide new aspects to improve the function of CSCs. Taken together, these findings facilitate our access to novel therapeutic strategy for the treatment of cardiovascular diseases in the future.
Sources of Funding
This work was supported by the National Natural Science Foundation of China (No. 30972696 and No. 81400199) and Suzhou Municipal Science and Technology Project of China (No. SYS201414).
Disclosures
None.
Supporting information
Data S1. The list of identified target genes. The possible target genes of significantly changed miRNAs were predicted by using TargetScan and Miranda software. The gene symbol, align score, energy, miRNA start, miRNA end, gene start, gene end, miRNA aglin, alignment, and gene align are shown.
Data S2. Biological functions indicated by the target genes of differentially expressed miRNAs. The GO categories were analyzed. GO ID, GO name, enrichment, P‐value, FDR, gene ID, and gene name are shown.
Data S3. Pathway analysis on the miRNAs target genes. Path ID, path name, path gene count, enrichment, P‐value, and FDR are shown.
Data S4. The microRNA–gene relationship and the enrichment degree of microRNAs and genes.
Acknowledgments
We would like to acknowledge Genminix for performing gene chip analysis.
Author Contributions: Drs Asahara and Shen conceived and supervised the study; Drs Zhang and Yang designed experiments; Drs Zhang, Yang, and Yan performed experiments; Dr Li analyzed data; Drs Zhang and Yang wrote the manuscript; and Drs Asahara and Shen made manuscript revisions.
(J Am Heart Assoc. 2016;5:e002856 doi: 10.1161/JAHA.115.002856)
Accompanying Datas S1 through S4 are available at http://jaha.ahajournals.org/content/5/1/e002856/suppl/DC1
References
- 1. Beltrami AP, Barlucchi L, Torella D, Baker M, Limana F, Chimenti S, Kasahara H, Rota M, Musso E, Urbanek K, Leri A, Kajstura J, Nadal‐Ginard B, Anversa P. Adult cardiac stem cells are multipotent and support myocardial regeneration. Cell. 2003;114:763–776. [DOI] [PubMed] [Google Scholar]
- 2. Linke A, Muller P, Nurzynska D, Casarsa C, Torella D, Nascimbene A, Castaldo C, Cascapera S, Bohm M, Quaini F, Urbanek K, Leri A, Hintze TH, Kajstura J, Anversa P. Stem cells in the dog heart are self‐renewing, clonogenic, and multipotent and regenerate infarcted myocardium, improving cardiac function. Proc Natl Acad Sci USA. 2005;102:8966–8971. [DOI] [PMC free article] [PubMed] [Google Scholar]
- 3. Bearzi C, Rota M, Hosoda T, Tillmanns J, Nascimbene A, De Angelis A, Yasuzawa‐Amano S, Trofimova I, Siggins RW, Lecapitaine N, Cascapera S, Beltrami AP, D'Alessandro DA, Zias E, Quaini F, Urbanek K, Michler RE, Bolli R, Kajstura J, Leri A, Anversa P. Human cardiac stem cells. Proc Natl Acad Sci USA. 2007;104:14068–14073. [DOI] [PMC free article] [PubMed] [Google Scholar]
- 4. Bolli R, Tang XL, Sanganalmath SK, Rimoldi O, Mosna F, Abdel‐Latif A, Jneid H, Rota M, Leri A, Kajstura J. Intracoronary delivery of autologous cardiac stem cells improves cardiac function in a porcine model of chronic ischemic cardiomyopathy. Circulation. 2013;128:122–131. [DOI] [PMC free article] [PubMed] [Google Scholar]
- 5. Zhang L, Xu Q. Stem/progenitor cells in vascular regeneration. Arterioscler Thromb Vasc Biol. 2014;34:1114–1119. [DOI] [PubMed] [Google Scholar]
- 6. Cervio E, Barile L, Moccetti T, Vassalli G. Exosomes for intramyocardial intercellular communication. Stem Cells Int. 2015;2015:482171. [DOI] [PMC free article] [PubMed] [Google Scholar]
- 7. Gnecchi M, He H, Noiseux N, Liang OD, Zhang L, Morello F, Mu H, Melo LG, Pratt RE, Ingwall JS, Dzau VJ. Evidence supporting paracrine hypothesis for Akt‐modified mesenchymal stem cell‐mediated cardiac protection and functional improvement. FASEB J. 2006;20:661–669. [DOI] [PubMed] [Google Scholar]
- 8. Lai RC, Arslan F, Lee MM, Sze NS, Choo A, Chen TS, Salto‐Tellez M, Timmers L, Lee CN, El Oakley RM, Pasterkamp G, de Kleijn DP, Lim SK. Exosome secreted by MSC reduces myocardial ischemia/reperfusion injury. Stem Cell Res. 2010;4:214–222. [DOI] [PubMed] [Google Scholar]
- 9. Bian S, Zhang L, Duan L, Wang X, Min Y, Yu H. Extracellular vesicles derived from human bone marrow mesenchymal stem cells promote angiogenesis in a rat myocardial infarction model. J Mol Med (Berl). 2014;92:387–397. [DOI] [PubMed] [Google Scholar]
- 10. Lin R, Wang S, Zhao RC. Exosomes from human adipose‐derived mesenchymal stem cells promote migration through Wnt signaling pathway in a breast cancer cell model. Mol Cell Biochem. 2013;383:13–20. [DOI] [PubMed] [Google Scholar]
- 11. Hatzistergos KE, Quevedo H, Oskouei BN, Hu Q, Feigenbaum GS, Margitich IS, Mazhari R, Boyle AJ, Zambrano JP, Rodriguez JE, Dulce R, Pattany PM, Valdes D, Revilla C, Heldman AW, McNiece I, Hare JM. Bone marrow mesenchymal stem cells stimulate cardiac stem cell proliferation and differentiation. Circ Res. 2010;107:913–922. [DOI] [PMC free article] [PubMed] [Google Scholar]
- 12. Dai Y, Xu M, Wang Y, Pasha Z, Li T, Ashraf M. HIF‐1alpha induced‐VEGF overexpression in bone marrow stem cells protects cardiomyocytes against ischemia. J Mol Cell Cardiol. 2007;42:1036–1044. [DOI] [PMC free article] [PubMed] [Google Scholar]
- 13. Cho JA, Lee YS, Kim SH, Ko JK, Kim CW. MHC independent anti‐tumor immune responses induced by Hsp70‐enriched exosomes generate tumor regression in murine models. Cancer Lett. 2009;275:256–265. [DOI] [PubMed] [Google Scholar]
- 14. Brill A, Dashevsky O, Rivo J, Gozal Y, Varon D. Platelet‐derived microparticles induce angiogenesis and stimulate post‐ischemic revascularization. Cardiovasc Res. 2005;67:30–38. [DOI] [PubMed] [Google Scholar]
- 15. Atay S, Gercel‐Taylor C, Kesimer M, Taylor DD. Morphologic and proteomic characterization of exosomes released by cultured extravillous trophoblast cells. Exp Cell Res. 2011;317:1192–1202. [DOI] [PubMed] [Google Scholar]
- 16. Hood JL, Pan H, Lanza GM, Wickline SA. Paracrine induction of endothelium by tumor exosomes. Lab Invest. 2009;89:1317–1328. [DOI] [PMC free article] [PubMed] [Google Scholar]
- 17. Kawada H, Fujita J, Kinjo K, Matsuzaki Y, Tsuma M, Miyatake H, Muguruma Y, Tsuboi K, Itabashi Y, Ikeda Y, Ogawa S, Okano H, Hotta T, Ando K, Fukuda K. Nonhematopoietic mesenchymal stem cells can be mobilized and differentiate into cardiomyocytes after myocardial infarction. Blood. 2004;104:3581–3587. [DOI] [PubMed] [Google Scholar]
- 18. Padin‐Iruegas ME, Misao Y, Davis ME, Segers VF, Esposito G, Tokunou T, Urbanek K, Hosoda T, Rota M, Anversa P, Leri A, Lee RT, Kajstura J. Cardiac progenitor cells and biotinylated insulin‐like growth factor‐1 nanofibers improve endogenous and exogenous myocardial regeneration after infarction. Circulation. 2009;120:876–887. [DOI] [PMC free article] [PubMed] [Google Scholar]
- 19. Iso Y, Rao KS, Poole CN, Zaman AK, Curril I, Sobel BE, Kajstura J, Anversa P, Spees JL. Priming with ligands secreted by human stromal progenitor cells promotes grafts of cardiac stem/progenitor cells after myocardial infarction. Stem Cells. 2014;32:674–683. [DOI] [PMC free article] [PubMed] [Google Scholar]
- 20. Zentilin L, Puligadda U, Lionetti V, Zacchigna S, Collesi C, Pattarini L, Ruozi G, Camporesi S, Sinagra G, Pepe M, Recchia FA, Giacca M. Cardiomyocyte VEGFR‐1 activation by VEGF‐B induces compensatory hypertrophy and preserves cardiac function after myocardial infarction. FASEB J. 2010;24:1467–1478. [DOI] [PubMed] [Google Scholar]
- 21. Enomoto D, Obana M, Miyawaki A, Maeda M, Nakayama H, Fujio Y. Cardiac‐specific ablation of the STAT3 gene in the subacute phase of myocardial infarction exacerbated cardiac remodeling. Am J Physiol Heart Circ Physiol. 2015;309:H471–H480. [DOI] [PubMed] [Google Scholar]
- 22. Rota M, Kajstura J, Hosoda T, Bearzi C, Vitale S, Esposito G, Iaffaldano G, Padin‐Iruegas ME, Gonzalez A, Rizzi R, Small N, Muraski J, Alvarez R, Chen X, Urbanek K, Bolli R, Houser SR, Leri A, Sussman MA, Anversa P. Bone marrow cells adopt the cardiomyogenic fate in vivo. Proc Natl Acad Sci USA. 2007;104:17783–17788. [DOI] [PMC free article] [PubMed] [Google Scholar]
- 23. Tang JM, Wang JN, Zhang L, Zheng F, Yang JY, Kong X, Guo LY, Chen L, Huang YZ, Wan Y, Chen SY. VEGF/SDF‐1 promotes cardiac stem cell mobilization and myocardial repair in the infarcted heart. Cardiovasc Res. 2011;91:402–411. [DOI] [PMC free article] [PubMed] [Google Scholar]
- 24. Guo CJ, Pan Q, Li DG, Sun H, Liu BW. miR‐15b and miR‐16 are implicated in activation of the rat hepatic stellate cell: an essential role for apoptosis. J Hepatol. 2009;50:766–778. [DOI] [PubMed] [Google Scholar]
- 25. Mineo M, Garfield SH, Taverna S, Flugy A, De Leo G, Alessandro R, Kohn EC. Exosomes released by K562 chronic myeloid leukemia cells promote angiogenesis in a Src‐dependent fashion. Angiogenesis. 2012;15:33–45. [DOI] [PMC free article] [PubMed] [Google Scholar]
- 26. Mayfield AE, Tilokee EL, Davis DR. Resident cardiac stem cells and their role in stem cell therapies for myocardial repair. Can J Cardiol. 2014;30:1288–1298. [DOI] [PubMed] [Google Scholar]
- 27. Florea V, Majid SS, Kanashiro‐Takeuchi RM, Cai RZ, Block NL, Schally AV, Hare JM, Rodrigues CO. Agonists of growth hormone‐releasing hormone stimulate self‐renewal of cardiac stem cells and promote their survival. Proc Natl Acad Sci USA. 2014;111:17260–17265. [DOI] [PMC free article] [PubMed] [Google Scholar]
- 28. Kanashiro‐Takeuchi RM, Takeuchi LM, Rick FG, Dulce R, Treuer AV, Florea V, Rodrigues CO, Paulino EC, Hatzistergos KE, Selem SM, Gonzalez DR, Block NL, Schally AV, Hare JM. Activation of growth hormone releasing hormone (GHRH) receptor stimulates cardiac reverse remodeling after myocardial infarction (MI). Proc Natl Acad Sci USA. 2012;109:559–563. [DOI] [PMC free article] [PubMed] [Google Scholar]
- 29. Karantalis V, Suncion‐Loescher VY, Bagno L, Golpanian S, Wolf A, Sanina C, Premer C, Kanelidis AJ, McCall F, Wang B, Balkan W, Rodriguez J, Rosado M, Morales A, Hatzistergos K, Natsumeda M, Margitich I, Schulman IH, Gomes SA, Mushtaq M, DiFede DL, Fishman JE, Pattany P, Zambrano JP, Heldman AW, Hare JM. Synergistic effects of combined cell therapy for chronic ischemic cardiomyopathy. J Am Coll Cardiol. 2015;66:1990–1999. [DOI] [PMC free article] [PubMed] [Google Scholar]
- 30. Williams AR, Hatzistergos KE, Addicott B, McCall F, Carvalho D, Suncion V, Morales AR, Da Silva J, Sussman MA, Heldman AW, Hare JM. Enhanced effect of combining human cardiac stem cells and bone marrow mesenchymal stem cells to reduce infarct size and to restore cardiac function after myocardial infarction. Circulation. 2013;127:213–223. [DOI] [PMC free article] [PubMed] [Google Scholar]
- 31. van Berlo JH, Kanisicak O, Maillet M, Vagnozzi RJ, Karch J, Lin SC, Middleton RC, Marban E, Molkentin JD. c‐kit+ cells minimally contribute cardiomyocytes to the heart. Nature. 2014;509:337–341. [DOI] [PMC free article] [PubMed] [Google Scholar]
- 32. Hatzistergos KE, Takeuchi LM, Saur D, Seidler B, Dymecki SM, Mai JJ, White IA, Balkan W, Kanashiro‐Takeuchi RM, Schally AV, Hare JM. cKit+ cardiac progenitors of neural crest origin. Proc Natl Acad Sci USA. 2015;112:13051–13056. [DOI] [PMC free article] [PubMed] [Google Scholar]
- 33. Barile L, Lionetti V, Cervio E, Matteucci M, Gherghiceanu M, Popescu LM, Torre T, Siclari F, Moccetti T, Vassalli G. Extracellular vesicles from human cardiac progenitor cells inhibit cardiomyocyte apoptosis and improve cardiac function after myocardial infarction. Cardiovasc Res. 2014;103:530–541. [DOI] [PubMed] [Google Scholar]
- 34. Tanaka S, Terada K, Nohno T. Canonical Wnt signaling is involved in switching from cell proliferation to myogenic differentiation of mouse myoblast cells. J Mol Signal. 2011;6:12. [DOI] [PMC free article] [PubMed] [Google Scholar]
- 35. Song G, Li Y, Jiang G. Role of VEGF/VEGFR in the pathogenesis of leukemias and as treatment targets (Review). Oncol Rep. 2012;28:1935–1944. [DOI] [PubMed] [Google Scholar]
Associated Data
This section collects any data citations, data availability statements, or supplementary materials included in this article.
Supplementary Materials
Data S1. The list of identified target genes. The possible target genes of significantly changed miRNAs were predicted by using TargetScan and Miranda software. The gene symbol, align score, energy, miRNA start, miRNA end, gene start, gene end, miRNA aglin, alignment, and gene align are shown.
Data S2. Biological functions indicated by the target genes of differentially expressed miRNAs. The GO categories were analyzed. GO ID, GO name, enrichment, P‐value, FDR, gene ID, and gene name are shown.
Data S3. Pathway analysis on the miRNAs target genes. Path ID, path name, path gene count, enrichment, P‐value, and FDR are shown.
Data S4. The microRNA–gene relationship and the enrichment degree of microRNAs and genes.