

Abstract
The two key steps for analyzing proteomic data generated by high-resolution MS are database searching and postprocessing. While the two steps are interrelated, studies on their combinatory effects and the optimization of these procedures have not been adequately conducted. Here, we investigated the performance of three popular search engines (SEQUEST, Mascot, and MS Amanda) in conjunction with five filtering approaches, including respective score-based filtering, a group-based approach, local false discovery rate (LFDR), PeptideProphet, and Percolator. A total of eight data sets from various proteomes (e.g., E. coli, yeast, and human) produced by various instruments with high-accuracy survey scan (MS1) and high- or low-accuracy fragment ion scan (MS2) (LTQ-Orbitrap, Orbitrap-Velos, Orbitrap-Elite, Q-Exactive, Orbitrap-Fusion, and Q-TOF) were analyzed. It was found combinations involving Percolator achieved markedly more peptide and protein identifications at the same FDR level than the other 12 combinations for all data sets. Among these, combinations of SEQUEST–Percolator and MS Amanda–Percolator provided slightly better performances for data sets with low-accuracy MS2 (ion trap or IT) and high accuracy MS2 (Orbitrap or TOF), respectively, than did other methods. For approaches without Percolator, SEQUEST–group performs the best for data sets with MS2 produced by collision-induced dissociation (CID) and IT analysis; Mascot–LFDR gives more identifications for data sets generated by higher-energy collisional dissociation (HCD) and analyzed in Orbitrap (HCD–OT) and in Orbitrap Fusion (HCD–IT); MS Amanda–Group excels for the Q-TOF data set and the Orbitrap Velos HCD–OT data set. Therefore, if Percolator was not used, a specific combination should be applied for each type of data set. Moreover, a higher percentage of multiple-peptide proteins and lower variation of protein spectral counts were observed when analyzing technical replicates using Percolator-associated combinations; therefore, Percolator enhanced the reliability for both identification and quantification. The analyses were performed using the specific programs embedded in Proteome Discoverer, Scaffold, and an in-house algorithm (Build Summary). These results provide valuable guidelines for the optimal interpretation of proteomic results and the development of fit-for-purpose protocols under different situations.
Keywords: Build Summary, database search engine, post-processing approach, local false discovery rate, PeptideProphet, Percolator
Graphical abstract
INTRODUCTION
To achieve comprehensive proteome profiling, a strategy achieving the optimal identification of peptides and proteins is indispensable in proteomic studies based on mass spectrometry (MS). With the wide use and rapid advancement of MS techniques in the past decade, database search engines such as SEQUEST,1 Mascot,2 Phenyx,3 OMSSA,4 XTandem,5 MyriMatch,6 Andromeda,7 Morpheus,8 and MS Amanda9 are developed to interpret various types of MS2 spectra produced by different MS instruments. A spectrum generally contains mass-to-charge ratios (m/z) of precursor ions (MS1) and fragment ions (MS2) with respective intensity information. The general task of a search algorithm is to assign spectra to peptide sequences on the basis of the m/z values and intensities, and the quality of assignment is determined by a specific scoring system. For example, the SEQUEST algorithm, one of the most popular search engines, utilizes a cross-correlation (XCorr) score to evaluate the similarity between the experimental and the theoretical mass spectra computed based on the putative peptide sequences. Some other engines, such as Mascot, emphasize the rank of possible peptide matches that best fits the acquired tandem mass spectrum via probabilistic modeling. In response to the rapidly expanding availability of high-resolution MS, most recent algorithms, such as MS Amanda and Morpheus, are designed and optimized for analyzing high-resolution and high-accuracy spectra at both the MS1 and MS2 levels.
Quality control of the peptide-spectrum matching (PSM) is critical to achieve confident and accurate MS-based identification. Currently, the target–decoy search strategy is one of the most popular approaches to estimate the false-positive discovery rate (FDR).10 This method utilizes a concatenated database containing a forward-sequence database (target database) and a decoy database (a reversed, shuffled or randomized database of the same size as the target database). One key assumption is that the number of PSM from the decoy database equals the number of false positives from the target database, which permits the FDR estimation. Due to its conceptual simplicity and easy implementation, the target–decoy search strategy is widely applied to ensure confident identification in many search engines based on the corresponding scores, which examine peptide assignments. In addition, some efforts also have been made on FDR estimation without using decoy databases such as the early version of PeptideProphet,11 spectral probabilities,12 and the mixture-modeling method13 combining the PeptideProphet11 and Choi’s approach.14
Besides the utilization of score-based filtering to calculate FDR, many postsearch algorithms have been developed to perform further statistical classification between correct and incorrect PSMs,11,15–21 such as PeptideProphet11,21 and Percolator.17 PeptideProphet originally uses a linear discriminant analysis classifier to separate correct and incorrect PSMs in an unsupervised fashion (i.e., without decoy information)11 and is improved later by the semisupervised approach, using decoy PSMs to estimate probabilities from the discriminant scores.21 The Percolator17 identifies a subset of high-confidence target PSMs; on the basis of this data, the algorithm is trained to achieve an optimal separation of correct and incorrect PSMs using the support-vector-machines (SVM)-based classifier. Besides the PeptideProphet’s LDA or Percolator’s SVM classifier, Searle et al. used log-likelihood ratios generated by naïve Bayesian classifiers to perform local FDR (LFDR) estimation for the classification of correct versus incorrect PSMs.22 In addition, we have developed a simple group-based approach, separating PSMs into different groups based on peptide characterizations, such as the missed internal cleavage sites and modification state prior to FDR filtering, to achieve a better sensitivity of peptide and protein identification for analysis of PSMs from various search engines such as SEQUEST, Mascot, and X!Tandem.23
Though new search engines and filtering approaches have been continuously developed thus far, to our knowledge, the effects of different combinations of the two steps have not been adequately evaluated. In this work, we performed the evaluation of different combinations of popular search engines and postprocessing approaches to achieve optimal peptide and protein identification. Popular search engines (e.g., SEQUEST, Mascot, and MS Amanda) and filtering approaches (e.g., respective score-based filtering, group-based approach, PeptideProphet, Percolator, and LFDR) were comprehensively assessed using eight data sets (three replicates per data set) generated from a variety of organisms (E. coli, yeast, and human) by various mass spectrometers. In total, 360 analyses (three engines × five filtering approaches × eight data sets × three replicates) were performed. This study provides a practical guideline on choosing proper combinations under different situations to maximize proteomic coverage, which is valuable for proteomics researchers.
MATERIALS AND METHODS
Data Sets Used in This Study
The possible combinations of search engines and filtering approaches were tested with eight data sets (n = 3/data set) as shown in Table 1: (1) yeast sample analyzed on a Thermo Scientific LTQ Orbitrap XL using CID with MS2 analysis in the ion trap (XL CID–IT yeast); (2) human cell-line sample (MCF7 cells) analyzed on a Thermo Scientific Orbitrap-Elite using CID with MS2 analysis in IT (Elite CID–IT human); (3) human cell-line sample (Hela cells) analyzed on a Thermo Scientific Orbitrap-Fusion using CID with MS2 analysis in IT (Fusion CID–IT human); (4) yeast sample analyzed on a Thermo Scientific Orbitrap-Fusion using HCD with product-mass-spectra analysis in IT (Fusion HCD–IT yeast); (5) E. coli sample analyzed on an Agilent 6530A (Q-TOF E. coli); (6) yeast sample analyzed on a Thermo Scientific LTQ Orbitrap Velos using HCD with product-mass-spectra observation in the orbitrap (Velos HCD–OT yeast); (7) human cell-line sample (Hela cells) analyzed on a Thermo Scientific Q-Exactive using HCD with product-mass-spectra observation in OT (QE HCD–OT human); and (8) human cell-line sample (PANC-1 cells) analyzed on a Thermo Scientific Orbitrap-Fusion using HCD with product-mass-spectra analysis in OT (Fusion HCD–OT human). The data sets for Velos HCD–OT yeast and QE HCD–OT human were described in a previous publication by Michalski et al.,24 and Q-TOF E. coli was described in Wenger et al.;8 these three data sets are available at http://www.chem.wisc.edu/~coon/Downloads/Morpheus/. The data set for Fusion HCD–IT yeast is available at https://chorusproject.org/anonymous/download/experiment/449795368199176159, as described in the report by Hebert et al.25 The sample preparation and MS analysis of data set Elite CID–IT human (MCF7 cells) were performed as previously described26 and also analyzed in triplicate. The remained data sets were described in detail as below.
Table 1.
Summary of Raw Files and Search Parameters Used in This Study
| name | MS analysis parameters
|
database search parameters
|
replicates | |||||
|---|---|---|---|---|---|---|---|---|
| MS instrument | collision dissociation | MS2 analyzer | precursor mass tolerance | fragment ion mass tolerance | maximum missed cleavages | dynamic modifications | ||
| XL CID–IT yeast | LTQ Orbitrap XL | CID | ion trap | 20 ppm | 1 Da | 2 | 3 | |
| Elite CID–IT human | Orbitrap Elite | CID | ion trap | 20 ppm | 1 Da | 2 | 3 | |
| Fusion CID–IT human | Orbitrap Fusion | CID | ion trap | 20 ppm | 1 Da | 2 | 3 | |
| Fusion HCD–IT yeast | Orbitrap Fusion | HCD | ion trap | 20 ppm | 1 Da | 2 | fixed cysteine carbamidomethylation; variable methionine oxidation and N-terminal acetylation | 3 |
| Q-TOF E. coli | Q-TOF | CID | TOF | 20 ppm | 0.05 Da | 2 | 3 | |
| Velos HCD–OT yeast | LTQ Orbitrap Velos |
HCD | Orbitrap | 20 ppm | 0.02 Da | 2 | 3 | |
| QE HCD–OT human | Q-Exactive | HCD | Orbitrap | 20 ppm | 0.02 Da | 2 | 3 | |
| Fusion HCD–OT human | Orbitrap Fusion | HCD | Orbitrap | 20 ppm | 0.02 Da | 2 | 3 | |
Sample Preparation
The HeLa protein digest standard, a tryptic digest of HeLa S3 cell lysate, was purchased from Thermo Scientific, Pierce. The PANC-1 cells (treated by 20 nM gemcitabine for 72 h) were from Dr. William J. Jusko’s lab at the department of Pharmaceutical Sciences in University at Buffalo, and yeast cells were from Kinex Pharmaceuticals (Buffalo, NY). Cell samples were homogenized in an ice-cold lysis buffer (50 mM Tris–formic acid, 150 mM NaCl, 0.5% sodium deoxycholate, 2% SDS, and 2% NP-40 and pH 8.0) using a Polytron homogenizer (Kinematica AG). After homogenization was performed for a 5–10 s burst at 15 000 rpm for ten cycles, the mixture was then sonicated in a cold room for ~10 min with a low-power sonicator until the solution was clear. Lysates were centrifuged at 140 000g for 1 h at 4 °C, and the resulting supernatant was collected. The protein concentration was determined using a BCA protein assay (Pierce, Rockford, IL), and the remaining samples were stored at −80 °C until further analysis. Each sample, containing 100 μg of total protein, was reduced with 3 mM TCEP for 10 min and then alkylated with 20 mM IAM for 30 min in darkness. In this study, a precipitation and on-pellet-digestion procedure was used to perform precipitation and tryptic digestion as previously described.27,28
Nano-LC–MS/MS Analysis
The peptide mixture of yeast was analyzed using an ultrahigh-pressure Eksigent (Dublin, CA) nano-2D Ultra capillary and nano-LC system coupled to a LTQ Orbitrap XL hybrid mass spectrometer (Thermo Fisher Scientific, San Jose, CA). The mobile phase consisted of 0.1% formic acid in 2% acetonitrile (A) and 0.1% formic acid in 88% acetonitrile (B). The peptide mixture was loaded onto a reversed-phase trap (300 μm i.d. × 0.5 cm), with 1% mobile phase B at a flow rate of 10 μL/min, and the trap was washed for 3 min. A series of nanoflow gradients (flow rate of 250 nL/min) was used to back-flush the trapped samples onto the nano-LC column (75 μm i.d. × 75 cm, packed with 3 μm particles) for separation. The nano-LC column was heated to 52 °C to improve the chromatographic resolution and reproducibility. A 7 h shallow gradient was used to achieve sufficient peptide separation, as previously described.29 The data-dependent product ion mode was applied and an MS1 survey scan (m/z 310–1800) at a resolution of 60 000, followed by seven MS2 scans using CID activation mode, was set to fragment the top seven most abundant precursors in the survey scan. The target values for MS1 by Orbitrap and MS2 by ion trap were 6 × 10⁶ and 1 × 10⁴. The dynamic exclusion was enabled with the following settings: repeat count, 1; repeat duration, 30 s; exclusion list size, 500; and exclusion duration, 40 s. The activation time was 30 ms, with an isolation width of 3 Da for ITMS; the normalized activation energy was 35%, and the activation (q) was 0.25. The yeast sample was analyzed in triplicate.
Respective peptide mixtures of Hela and PANC-1 cells were analyzed on an Orbitrap Fusion tribrid mass spectrometer (Thermo Fisher Scientific). The settings of mobile phases, the reversed-phase trap, and the nano-LC column were same as described above. A 160 min gradient was applied in these analyses. The gradient profile was as following: 0 to 3% B over 3 min; 3 to 6% B over 5 min; 6 to 28% B over 118 min; 28 to 50% B over 10 min; 50 to 97% B over 1 min; and, finally, isocratic at 97% B for 23 min. The data-dependent product-ion mode was applied for all analyses. For HCD–OT fragmentation and detection, MS1 survey scans (m/z 310 to 1800) were performed at a resolution of 60 000 with an AGC target of 5 × 10⁵. MS2 was performed by isolation at 1.6 Th with the quadrupole for HCD fragmentation. The normalized collision energy was 35%, and tandem mass spectra were analyzed by Orbitrap with a resolution of 15 000. The MS2 AGC target was set to 5 × 10⁴, and the max injection time was 50 ms. Peptide precursors with charge state 2–6 were sampled for MS2. The dynamic exclusion was enabled with the following settings: repeat count, 1; repeat duration, 50 s; exclusion duration, 45 s; mass tolerance, ± 10 ppm; signal-to-noise (S/N) threshold, 2. Monoisotopic precursor selection was turned on. The instrument was run in top-speed mode with a cycle time of 3 s. For CID–IT fragmentation and detection, MS1 survey scans (m/z 310 to 1800) were performed at a resolution of 120 000 with a 5 × 10⁵ AGC target. MS2 was performed by isolation at 1.6 Th with the quadrupole for CID fragmentation. The normalized collision energy was 30%, and tandem mass spectra were analyzed by ion trap with rapid scan rate. The MS2 AGC target was set to 1 × 10⁴, and the max injection time was 50 ms. Only peptide precursors with a charge state of 2–6 were sampled for MS2. The dynamic exclusion was enabled with the following settings: repeat count, 1; repeat duration, 50 s; exclusion duration, 45 s; S/N threshold, 2. Monoisotopic precursor selection was turned on. The instrument was also run in top-speed mode with a cycle time of 3 s. Each sample was analyzed in triplicate.
Database Search and Postsearch Filtering Analyses
Proteome Discoverer (PD) version 1.4.1.14 (Thermo-Scientific) was used to perform the database search against respective Swiss-Prot protein database (version June 2012) for these raw data files. The search engines SEQUEST-HT, Mascot (version 2.4.0), and MS Amanda (version 1.4.4.2822) were implemented in PD as previously described.9 A total of 20 238 entries, 4431 entries, and 7801 entries were presented in the respective human, E. coli, and yeast databases. The downloaded mzML files for Q-TOF and the remaining raw files were searched directly by these three search engines through PD. The search parameters used were as follows: 20 ppm tolerance for precursor ion masses, 1.0 Da for fragment ion masses analyzed by ion trap, 0.02 Da for fragment ion masses analyzed by Orbitrap, and 0.05 Da for fragment ion masses of data set generated by Q-TOF (Table 1). A total of two missed cleavages were permitted for fully tryptic peptides. Carbamidomethylation of cysteines (+57.0215 Da) was set as a fixed modification, and variable modifications of methionine oxidation (+15.9949 Da) and N-terminal acetylation (+42.0106 Da) were allowed. The false discovery rate (FDR) was determined by using a target–decoy search strategy.30 The sequence database contains each sequence in both forward and reverse orientations, enabling FDR estimation.
In this study, Scaffold v4.3.4 (Proteome Software, Portland, OR) and custom software Build Summary23 were applied to generate peptide and protein lists using different postsearch filtering approaches. Here, protein FDR was calculated as the number of decoy proteins divided by the number of target proteins. The FDR was set to 0.01 at both the peptide and the protein levels. In cases where the target and decoy PSMs had the same score (spectra could be assigned to target or decoy peptides), the decoy was preferred. The score threshold yielding the largest number of target protein groups at less than or equal to 1% FDR was determined. Score-based, group-based, and Percolator postprocessing approaches were summarized by Build Summary, while PeptideProphet and LFDR were analyzed and summarized by Scaffold. For score-based postsearch filtering, PSMs were sorted and selected according scores to achieve the protein FDR of 1%: ascending XCorr for SEQUEST-HT, ascending ion score for Mascot, and ascending MS Amanda score for MS Amanda. For PeptideProphet (with δ mass correction) and LFDR, ascending probability was used to select confident PSMs for SEQUEST-HT, Mascot, and MS Amanda. For Percolator, the ascending SVM score was used for these three search engines. For the group-based postsearch filtering approach, PSMs were further separated into different groups on the basis of the missed internal cleavage sites and modification state besides the peptide charges prior to FDR filtering with ascending respective scores. The protein with the longest sequence was selected as the representative protein for the protein group. Percolator (version 2.04) was used to generate q values, SVM scores, and posterior error probabilities through the stand-alone application or PD including Percolator as a component. Software Build Summary23 was further developed and updated to enable FDR analysis according to the SVM score by Percolator and score by MS Amanda. The newest version of Build Summary can be downloaded freely at https://github.com/shengqh/RCPA.Tools/releases/.
RESULTS AND DISCUSSION
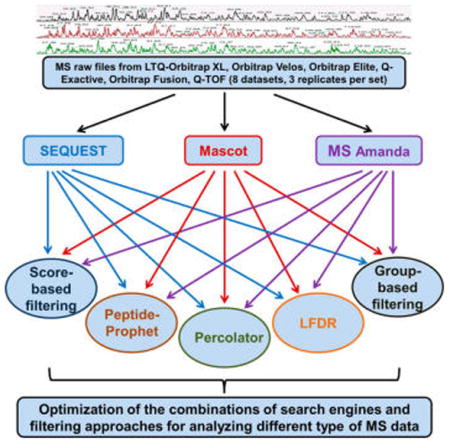
In recent years, the prevalent use of high-resolution MS and the related technical advances elicited the development of various new search engines and postprocessing approaches. However, to our knowledge, optimization and evaluation of the combinations of these two critical steps was not adequately conducted. Here, we assessed the effects of different combinations of search engines and filtering approaches for the interpretation of high-resolution MS data. A total of three popular search engines representing different characteristics (SEQUEST, Mascot, and MS Amanda (i.e., SEQUEST, emphasis on similarity; Mascot, emphasis on probability; and MS Amanda, emphasis on high-accuracy MS2 spectra)) were selected. Meanwhile, the five most popular filtering approaches (original-score-based filtering, group-based, PeptideProphet, Percolator, and LFDR) were assessed for each search engine. In addition, eight data sets (three replicates per data set) generated from three organisms (E. coli, yeast, and human) by various MS instruments including LTQ Orbitrap XL, Q-TOF, Orbitrap Velos, Orbitrap Elite, Q-Exactive, and Orbitrap Fusion were investigated. Commercially available software such as Proteome Discovery (Thermo-Scientific) and Scaffold (Proteome Software) and a custom algorithm Build Summary23 were utilized to perform database searches and results summaries. The MS and database search parameters were shown in Table 1, and the detailed flowchart of this experiment was shown in Figure 1.
Figure 1.
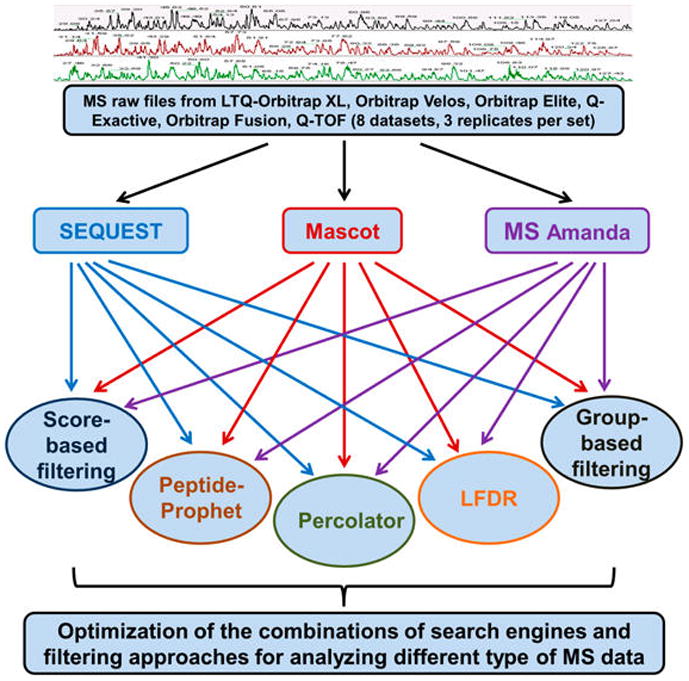
Flowchart for the optimization and evaluation of the combinations of search engines and postprocessing approaches. A total of three popular search algorithms (SEQUEST, Mascot, and MS Amanda) and five filtering approaches (score-based, group-based, PeptideProphet, LFDR, and Percolator) were investigated for analyzing different types of high-resolution MS data.
Investigation Using SEQUEST algorithm
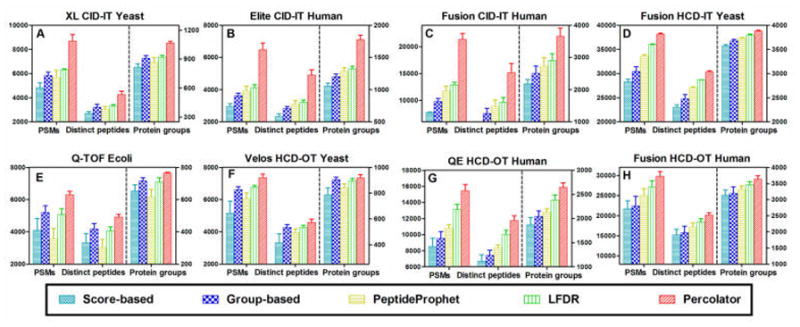
SEQUEST, developed by Eng et al. in 1994,1 is one of the most popular database-searching algorithms. It first computes a preliminary score (Sp) for all candidate peptides based on peaks that are common in experimental and theoretical spectra and then uses cross-correlation (Xcorr) analysis of these top candidates based on the rank of preliminary score (Rsp). A total of two scores (Xcorr and ΔCn (the difference of Xcorr between the first hit and the second hit)) are commonly used to determine high-confidence identifications. Generally, it is required that a ΔCn value is at least 0.1 regardless of charge state.1,31 Here, we used a cutoff of ΔCn values ≥0.1 and adjusted Xcorr scores to obtain desired FDR. This approach is named as the SEQUEST score-based approach (SEQUEST–score). As shown in Figure 2, the naïve score-based filtering method was not optimal for all MS data sets. LFDR, a new postprocessing algorithm incorporated in Scaffold version 4, was developed to evaluate the confidence level of peptides based on a Bayesian approach to local false discovery rate, and especially improves identification for high-mass-accuracy data.22 Except for the CID–IT data (data sets A–C), LFDR achieved more identifications than the score-based and PeptideProphet approaches when processing data by SEQUEST (Figure 2), as was expected. However, Percolator significantly outperformed the other four methods in PSMs, distinct peptides, and protein groups of all of the data sets analyzed (Figure 2). Compared to the naïve score-based approach, improvements by Percolator ranged from 55 to 88%, 44 to 85%, and 14 to 39% at the PSM, distinct peptide, and protein group levels, respectively, in the eight data sets. For all of the CID–IT data (data sets A–C), the group-based approach and PeptideProphet achieved the second and third highest numbers in all categories. For all HCD-OT data (data sets F–H), the LFDR and group-based approach achieved the second and third highest numbers in all categories. As for the Fusion HCD–IT yeast and Q-TOF E. coli data sets, the group-based approach and LFDR achieved similar improvements, although both were inferior to the results from Percolator.
Figure 2.

Comparison of PSMs, distinct peptides, and protein groups identified at 1% protein FDR with SEQUEST, respectively coupled with score-based, group-based, LFDR, PeptideProphet, and Percolator filtering approaches. Data sets of (A) Orbitrap XL CID–IT yeast, (B) Elite CID-IT human, (C) Fusion CID–IT human, (D) Fusion HCD–IT yeast, (E) Q-TOF E. coli, (F) Velos HCD–OT yeast, (G) QE HCD–OT human, and (H) Fusion HCD–OT human were analyzed. For all five combinations, SEQUEST–Percolator achieves the highest number in all three categories; the group-based approach achieves the second highest numbers for the CID-IT data sets (A–C); and LFDR achieves the second-highest number for HCD–OT data sets (F–H).
To further validate the peptide identification from different filtering approaches, we visualized the overlap of these five combinations using a five-way Venn diagram. Data shown in Figure 3A is for one LC/MS analysis of yeast proteome by Fusion HCD–IT followed by SEQUEST searching. A total of 30 960 distinct peptides were identified, among which 15 804 (51.0%) were common for all five filtering approaches. SEQUEST–score resulted in the lowest number of peptide identifications (16 114), and 98.1% (15 804) of these peptides were identified by all other four filtering approaches. Moreover, 21.6% of the total identified peptides are unique to SEQUEST–Percolator; by comparison, only less than 1% of peptides are unique to each of the other four combinations. Therefore, SEQUEST–Percolator identified substantially more distinct peptides than other combinations, and the peptides identified by other combinations overlap well with these by SEQUEST–Percolator.
Figure 3.

(A) Overlap of distinct peptides identified by SEQUEST followed by postprocessing with score-based, group-based, LFDR, PeptideProphet, and Percolator approaches. (B) Distribution of distinct peptides per protein. A single randomly selected LC/MS run from the Fusion HCD–IT yeast data set was employed for this investigation, and 1% protein FDR was used.
We further investigated the distribution of the number of distinct peptides assigned to each protein by these combinations. As shown in Figure 2D, the use of group-based, PeptideProphet, LFDR, and Percolator approaches identified more peptides and proteins, and the percentages of proteins containing ≥4 distinct peptides were higher (Figure 3B) than SEQUEST–score. SEQUEST–Percolator achieved the highest percentage of proteins containing ≥4 peptides (63.1% versus 47.5% by SEQUEST–score), while the percentage of one-peptide-hit proteins was only 14.6%, compared with 24.3% by SEQUEST–score. A minimum of two distinct peptides per protein is often required to enhance the quantitative reliability and accuracy for targeted and global quantification.32–34 Consequently, the increase of proteins containing multiple peptides by SEQUEST–Percolator can provide not only better identification but also improved protein quantification.
Investigation Using the Mascot Algorithm
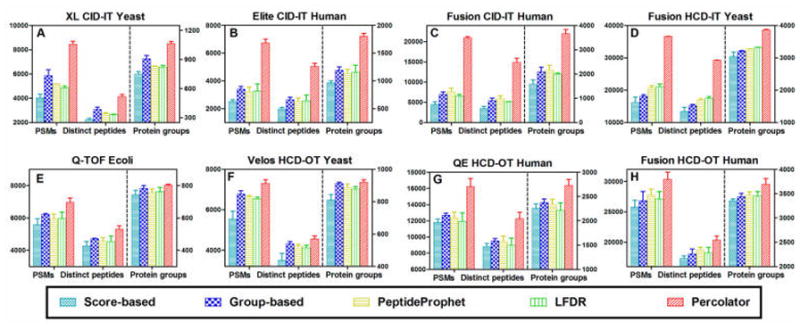
The probabilistic scoring method has been applied in many search engines such as Mascot,2 X!Tandem,5 and OMSSA,4 among which Mascot is by far the most popular. Mascot calculates the ions score to examine whether a particular peptide spectrum match is a random event. Similar to the observations for SEQUEST, the original score-cutoff method using the ions score (Mascot–score) resulted in the lowest number of identifications at the same protein FDR level; Percolator also outperformed the other four filtering methods in the numbers of identified PSMs, distinct peptides, and protein groups in all of the data sets at a protein FDR of 1% (Figure 4). In these data sets, Mascot–Percolator provided, respectively, 34.6 to 175.9%, 31.9 to 154.0%, and 8.6 to 68.3% more PSM, distinct peptides, and protein groups compared to the Mascot–score approach. Apparently, Percolator is the method-of-choice for postprocessing both low- and high-accuracy MS data produced by Mascot, consistent with a previous study.35 Among the other four filtering approaches, LFDR achieved superior overall performance in comparison to score-based, group-based, and PeptideProphet approaches, as shown in Figure 4. Only in data sets E and F in the group-based approach achieved similar or slightly higher (~1%) identifications in protein groups than the LFDR results. Although SEQUEST–LFDR was found not to be optimal for CID–IT data (Figure 2A–C) as discussed above, Mascot–LFDR achieved the second-best performance for those data sets with low-accuracy MS2 spectra. The excellent performance of Mascot–LFDR was also demonstrated in other data sets from different species (data not show).
Figure 4.
Comparison of PSMs, distinct peptides, and protein groups identified at 1% protein FDR by Mascot coupled, respectively, with score-based, group-based, LFDR, PeptideProphet, and Percolator filtering approaches. Mascot–Percolator achieves the highest number in all three categories.
The five-way Venn diagram of distinct peptides identified by these processing methods in a Fusion HCD–IT yeast data set is shown in Supplemental Figure 1A; 21726 (68.4%) peptides were commonly identified by all the five filtering approaches after a Mascot search. The uniquely identified peptides in each of the five combinations were 0, 0.4%, 0.2%, 1.2%, and 6.3% of total peptides, respectively, by Mascot–score, Mascot–group, Mascot–PeptideProphet, Mascot–LFDR, and Mascot–Percolator. Again Mascot–Percolator identified markedly more peptides than other combinations. In summary, when using the Mascot database search, Percolator and LFDR provide the best results for all data sets with low- or high-accuracy MS2 spectra.
Investigation Using MS Amanda Algorithm
MS Amanda was recently designed to cope with the need of interpreting high-accuracy tandem mass spectra,9 and the general applications of MS Amanda to data generated by HCD, ETD, and CID fragmentation were reported. In this study, as shown in Figure 5, the numbers of PSMs, distinct peptides, and proteins identified from low-accuracy MS/MS data sets (sets A–D) by MS Amanda–score were significantly lower than those from SEQUEST–score or Mascot–score (Figures 2 and 4). This indicates that MS Amanda may not be optimal for the identification of MS2 data produced by a low-accuracy detector such as IT, regardless of the fragmentation type (CID or HCD). On the basis of this result, here we mostly focus on the analysis of high-resolution and high-accuracy MS2 data for MS Amanda. Similar to the observations for SEQUEST and Mascot, Percolator performed better than the other four postprocessing methods (Figure 5E–H). MS Amanda–Percolator provided an average of 27.9%, 27.6%, and 13.1% more PSM, distinct peptides, and protein groups, respectively, in data sets E–H, compared to the results from MS Amanda–score. The group-based filtering approach achieved the second-best overall performance for analyzing data sets E–H (Figure 5E–H). The overlap analysis of peptides identified by these five combinations for MS Amanda is shown in Supplemental Figure 1B. A total of 7227 (61.0%) peptides were commonly identified by all combinations for a replicate of the QE HCD–OT human data set. Among the five combinations, 15.6% of total peptides were unique to MS Amanda–Percolator, while only 0, 0.6%, 0.4%, and 0.5% were unique to the MS Amanda–score, MS Amanda–group, MS Amanda–PeptideProphet, and MS Amanda–LFDR approaches, respectively. About 97% of distinct peptides identified by MS Amanda–score, 96% identified by MS Amanda–group, 97% identified by MS Amanda–PeptideProphet, and 97% identified by MS Amanda–LFDR approaches were also confidently identified by the MS Amanda–Percolator approach. This result highlights the excellent reliability and sensitivity of the MS Amanda–Percolator approach for analyzing high-accuracy MS2 data.
Figure 5.
Comparison of PSMs, distinct peptides, and protein groups identified at 1% protein FDR by MS Amanda coupled, respectively, with score-based, group-based, LFDR, PeptideProphet, and Percolator filtering approaches. MS Amanda–Percolator achieves the highest number in all three categories.
Evaluation of Different Search Engines
In previous studies, original score-based filtering approaches are often used to compare different search engines;8,9 this study demonstrated that Percolator afforded the best performance out of the five popular postprocessing approaches. Therefore, we performed the comparison of three search engines (SEQUEST, Mascot, and MS Amanda) using both the score-based approach (Supplemental Figure 2) and the Percolator approach (Figure 6). Of these three search engines, SEQUEST and Mascot are algorithms designed for HCD, ETD, and CID fragmentation with high- or low-accuracy MS2 spectra, while MS Amanda is optimal for high-accuracy MS2 data and for identifying more peptides at the same FDR than SEQUEST and Mascot, as previously reported.9
Figure 6.
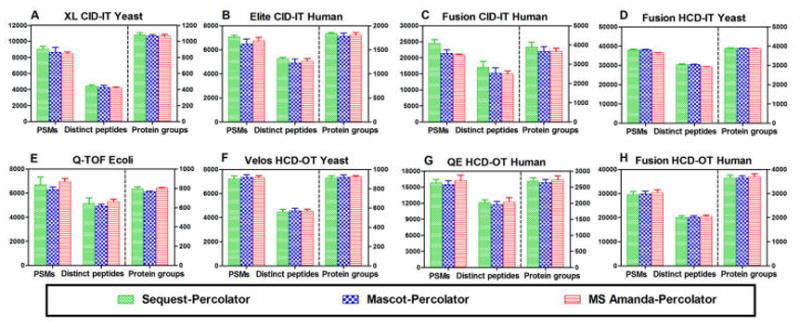
Comparison of PSMs, distinct peptides, and protein groups identified at 1% protein FDR by SEQUEST–Percolator, Mascot–Percolator, and MS Amanda–Percolator.
As shown in Supplemental Figure 2A–D, for those data sets with low-accuracy MS2 (analyzed in IT), MS Amanda–score underperformed the others regardless the activation mode (HCD or CID). Conversely, for high-accuracy MS2 data (data set E–H) produced by various MS instruments (Q-TOF, QE, Velos, and Fusion) for a variety of organisms (E. coli, yeast, and human), MS Amanda–score achieved the best performance as expected (Supplemental Figure 2E–H), consistent with the previous report.9 SEQUEST–score identified more PSMs, peptides, and protein groups for all CID–IT data (data sets A–C) than did the MS Amanda–score and Mascot–score approaches. Interestingly, for the Fusion HCD–IT yeast data set (from Coon’s lab),25 Mascot–score achieved the better performance (Supplemental Figure 2D), with increases of 40%, 40%, and 8% respectively at PSM, distinct-peptide, and protein-group levels over SEQUEST–score. To further confirm this interesting observation, we used another Fusion HCD–IT data set generated from human samples in our own lab and found significant increases of 53%, 52%, and 23%, respectively, for PSMs, distinct peptides, and protein groups by the Mascot–score over the SEQUEST–score approach (Supplemental Figure 3). These results indicated that MS Amanda–score achieved the best performance for data sets with high-accuracy MS2, while the SEQUEST–score and Mascot–score, respectively, excel at CID–IT and Fusion HCD–IT data sets.
The use of Percolator depends on support vector machine (SVM) training and learning to discriminate between the correct and incorrect peptide-spectrum matches.17 While the Percolator had been individually applied for search engines such as SEQUEST, Mascot, and X!Tandem,19,35,36 to our knowledge, the comparison of performance of Percolator across different search engines has not yet been comprehensively conducted. Here, we compared the combinations of Percolator with each search engine, and the results were shown in Figure 6. Apparently, these three combinations achieved similar PSMs, distinct peptides, and protein groups, while SEQUEST–Percolator slightly outperformed Mascot–Percolator and MS Amanda–Percolator for the CID–IT data sets. Interestingly, although MS Amanda is designed for high-accuracy MS2 data, when Percolator was used, its performances for both high- and low-accuracy data sets are similar to those of the other two search engines, which is contrary to the findings when the score-based method is used. Even though MS Amanda is not optimal for CID–IT data, MS Amanda–Percolator achieved the better performance than Mascot or SEQUEST coupling with the other four filtering approaches (score-based, group-based, PeptideProphet, and LFDR), which once again indicated that Percolator is a better processing approach. This could be attributed to the 19 key features (Supplemental Table 1) considered by Percolator (v2.04), which greatly reduce the inherent preference by different search engines, improving the performance of peptide-spectrum matches and enabling the analysis of any MS data set with their best performance. This notion is demonstrated by another example in which the SEQUEST– and Mascot–Percolator approaches showed similar results when Fusion HCD–IT data sets are analyzed (Figure 6D), despite the fact that the Mascot–score approach appreciably outperformed the SEQUEST–score approach for the same data set, as described above.
As shown in the Venn diagrams in Figure 7, superb overlap among the three search engines coupled to Percolator was observed, 90.8% at the peptide level and 91.2% at the protein level. Moreover, only ~1% of distinct peptides were unique to each of these three combinations (Figure 7), and more than 96% of peptides or proteins were commonly identified between two of the combinations. Such excellent overlap by different search engines implies excellent reliability of the results. By comparison, previous studies using a combination of multiple search engines with other filtering approaches showed a much lower extent of overlap among search engines,37,38 rendering it difficult to interpret the identification data. Therefore, the Percolator approach minimizes the preference and bias by different searching algorithms and thereby permits more confident identification. Additionally, combining the results of multiple search engines, a common practice when extensive identification is desired, may not be necessary when Percolator is utilized.
Figure 7.
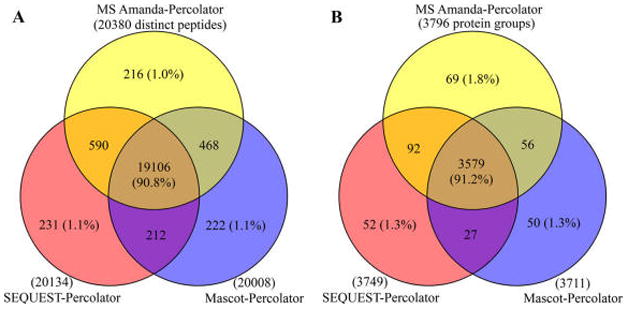
Venn diagrams for (A) distinct peptides and (B) protein groups identified by SEQUEST–Percolator, Mascot–Percolator, and MS Amanda–Percolator. The one LC–MS analysis in the Fusion HCD–OT Human data set was used. The exceptionally high peptide–protein overlap (>90%) among these three combinations indicates the high reliability of the results.
The Optimal Combinations for Specific Types of Data Sets
In this study, each data set has been analyzed by 15 different combinations (three search engines × five filtering approaches). The top six combinations in numbers of identification are presented for each data set in Table 2. The best identification number for each class (i.e., spectra, peptides, or protein group) in each data set was set as 100%. The data presented in Table 2 enables proteomics researchers to develop a fit-for-purpose data-processing approach based on the specific instruments and resources available. As shown in Table 2, combinations involving Percolator provided the best performance in all classes. For combinations without Percolator, SEQUEST–group gives the most IDs for the CID–IT data than the other combinations; Mascot–LFDR is the best for the Orbitrap Fusion HCD–IT and Q-Exactive HCD–OT data sets; MS Amanda–group gives more identifications for the data sets by Q-TOF and Velos HCD–OT, and MS Amanda–PeptideProphet gives more identifications for the Fusion HCD–OT data set. These results highlight the importance to optimize the combinations of search engines and filtering approaches individually when Percolator is not used.
Table 2.
Top Six Combinations with Percentages (Best Result of 100%) for PSM, Distinct Peptide, and Protein Group of Each MS Dataseta
| data sets | identifications | #1 | #2 | #3 | #4 | #5 | #6 |
|---|---|---|---|---|---|---|---|
| XL CID–IT yeast | PSM | S–P (100%) | M–P (95.6%) | MS–P (93.2%) | S–G (81.8%) | S–Pep (71.3%) | M–L (69.9%) |
| distinct peptide | S–P (100%) | M–P (96.7%) | MS–P (94.1%) | S–G (83.6%) | M–L (75.3%) | M–G (72.7%) | |
| protein group | S–P (100%) | M–P (98.5%) | MS–P (98.1%) | S–G (92.9%) | S–Pep (85.3%) | M–L (85.1%) | |
| Elite CID–IT human | PSM | S–P (100%) | MS–P (95.6%) | M–P (91.9%) | S–G (76.6%) | S–L (70.7%) | M–L (58.4%) |
| distinct peptide | S–P (100%) | MS–P (96.1%) | M–P (93.4%) | S–G (77.4%) | S–L (70.3%) | M–L (61.2%) | |
| protein group | S–P (100%) | MS–P (98.2%) | M–P (96.8%) | S–G (86.3%) | S–L (79.2%) | M–L (72.0%) | |
| Fusion CID–IT human | PSM | S–P (100%) | M–P (87.3%) | MS–P (85.6%) | S–G (71.0%) | S–Pep (67.8%) | M–L (52.7%) |
| distinct peptide | S–P (100%) | M–P (89.2%) | MS–P (87.3%) | S–G (74.2%) | S–Pep (69.9%) | M–L (56.9%) | |
| protein group | S–P (100%) | MS–P (94.0%) | M–P (94.0%) | S–G (89.1%) | S–Pep (85.4%) | M–L(74.6%) | |
| Fusion HCD–IT yeast | PSM | M–P (100%) | S–P (99.8%) | MS–P (96.1%) | M–L (94.4%) | M–Pep (88.1%) | S–L (71.1%) |
| distinct peptide | S–P (100%) | M–P (99.8%) | MS–P (96.3%) | M–L (94.5%) | M–Pep (89.0%) | S–G (71.7%) | |
| protein group | S–P (100%) | M–P (99.9%) | MS–P (99.5%) | M–L (97.7%) | M–Pep (95.9%) | S–G (92.9%) | |
| Q-TOF E. coli | PSM | MS–P (100%) | S–P (96.1%) | M–P (90.5%) | MS–G (89.2%) | MS–L (85.6%) | S–L (85.5%) |
| distinct peptide | MS–P (100%) | S–P (97.1%) | M–P (92.7%) | MS–G (88.9%) | MS–L (85.7%) | S–L (84.3%) | |
| protein group | MS–P (100%) | S–P (99.0%) | MS–G (97.5%) | S–G (96.3%) | M–P (95.4%) | MS–L (95.0%) | |
| Velos HCD–OT yeast | PSM | M–P (100%) | MS–P (99.4%) | S–P (98.0%) | MS–G (92.3%) | M–L (91.9%) | M–G (90.0%) |
| distinct peptide | M–P (100%) | MS–P (99.5%) | S–P (97.7%) | MS–G (94.5%) | M–G (93.6%) | M–L (93.4%) | |
| protein group | MS–P (100%) | M–P (99.7%) | MS–G (99.2%) | S–P (99.0%) | M–G (98.2%) | M–L (97.1%) | |
| QE HCD–OT human | PSM | MS–P (100%) | S–P (97.6%) | M–P (95.3%) | M–L (80.9%) | MS–G (78.2%) | S–L (78.0%) |
| distinct peptide | MS–P (100%) | S–P (98.9%) | M–P (95.9%) | M–L (81.8%) | S–L (78.8%) | MS–G (77.7%) | |
| protein group | MS–P (100%) | S–P (98.7%) | M–P (97.0%) | M–L (87.3%) | MS–G (87.1%) | S–L (85.7%) | |
| Fusion HCD–OT human | PSM | MS–P (100%) | M–P (98.1%) | S–P (97.4%) | MS–Pep (91.4%) | M–L (89.4%) | MS–L (89.3%) |
| distinct peptide | MS–P (100%) | M–P (99.0%) | S–P (98.7%) | MS–Pep (92.0%) | M–L (90.7%) | MS–L (89.6%) | |
| protein group | MS–P (100%) | S–P (98.8%) | M–P (98.5%) | MS–Pep (93.9%) | M–L (93.8%) | MS–L (93.5%) |
The search engines coupled with Percolator provided better performance than any other combinations. For combinations without Percolator, the best performers were labeled in the gray shades. S = SEQUEST; M= Mascot; MS = MS Amanda; P = Percolator; L = LFDR; G = group-based approach; Pep = PeptideProphet.
In this study, the Percolator showed overall best performances regardless the search engines employed. Recently, Kim et. al demonstrated that the database search algorithm MS–GF+ with the E-value filter method significantly identified more PSMs (17–38%) than Mascot–Percolator.39 Here, we performed the comparison of Mascot–Percolator and MS–GF+ (E-value) using the QE HCD–OT data set (n = three replicates), as the MS–GF+ algorithm was extensively trained with data generated from the Q-Exactive instrument.39 Moreover, MaxQuant7,40 was also a popular peptide and protein identification package, and PeptideProphet–iProphet41 gave the better performance than PeptideProphet alone. Thus, the newest version of MS–GF+ (beta v10282, released on December 19, 2014), MaxQuant (v1.5.2.8), and iProphet in the Trans-Proteomic Pipeline (TTP v4.8) were further selected for investigation, and the same search parameters described above were used. As shown in Supplemental Figure 4, MS–GF+ (E-value) identified by an average of 5.8% more PSMs but 4.4% fewer peptides and 3.8% fewer proteins than Mascot–Percolator, while none of these differences is statistically significant (p > 0.05 by paired t-test). Therefore, the two methods identified similar number of proteins for data analysis from the Q-Exactive, the presumably optimal type of data set for MS–GF+. MaxQuant and Mascot–PeptideProphet and Mascot–iProphet identified a similar number of protein groups, but both of them achieved fewer spectra and protein groups than the two methods mentioned above. Because Percolator works well for any types of data as discussed above, it is advisible to employ Percolator as a universal postprocessing approach. As a matter of fact, MS–GF+ coupling with Percolator has already been reported.42
Assessment of Quantitative Precision for Percolator-Associated Combinations
As discussed above, Percolator-associated combinations are the top performers and thus may enable more extensive proteomic identification, especially for low-abundance peptides and proteins. Because one of the most important tasks for proteomics is quantification, the impact of these combinations on protein quantitation should be evaluated as well; however, to our knowledge, such investigation has not been reported. Here, we compared the quantitative precision by Percolator-associated combinations versus the SEQUEST–score approach using the Fusion HCD–IT yeast data set (three replicates). Spectral counts (SpC) of proteins were used as the quantitative feature. The precision was expressed by coefficients of variation (CV) of SpC for the individual proteins in the three replicates. A total of 2903 and 3502 protein groups were commonly identified, respectively, by the SEQUEST–score and SEQUEST–Percolator combinations. The median CV for quantification of individual proteins by SEQUEST–Percolator (14.3 ± 0.09%, median ± median absolute deviation) was significantly lower than that by SEQUEST–score (17.3 ± 0.11%), with a p value of 2.2 × 10⁻¹⁶ by paired Wilcoxon ranked-sum test (Figure 8A). The distribution of CV versus relative protein abundance (the total spectral counts) of the 2816 proteins identified in both two combinations is shown in Figure 8B. For proteins identified by the SEQUEST–Percolator approach, 87.5% of proteins have CV values <30%, while only 72.8% of proteins fell under the same threshold for SEQUEST–score. As is clearly evident from Figure 8B, SEQUEST–Percolator achieved lower CV for lower-abundance proteins than did SEQUEST–score. Similar results were also observed when comparing the Mascot–Percolator or MS Amanda–Percolator methods against original-score-based methods (data not shown). This is likely because the increase of confidently identified distinct peptides per protein group by Percolator. Therefore, the use of Percolator greatly improves both the quality for both identification and quantification and, therefore, may serve as a valuable tool for quantitative proteomic analysis.
Figure 8.
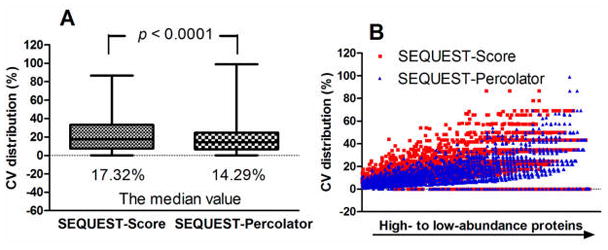
Coefficients of variations of the spectral counts for proteins identified by SEQUEST–score and SEQUEST–Percolator in the three replicates of Fusion HCD–IT yeast data set. (A) Box-and-whisker plot analysis was employed to show the spread of protein CVs around the median value (the horizontal line inside the box); the bottom and top of the boxes correspond to the top 25th and 75th percentile of the CV distribution, and whiskers correspond to the minimum and maximum values. the Wilcoxon rank-sum test (WRS) was performed to compare the two sets, and a p value of <0.0001 was achieved. (B) The distribution of CV vs protein abundance. Red squares and blue triangles indicate SEQUEST–score and SEQUEST–Percolator data spots, respectively.
In summary, an optimal data-processing strategy for MS data interpretation is not only critical for extensive identification but also for reliable proteomic quantification. To explore the optimal strategy for peptide and protein identification, we evaluated three popular search engines combined with five postprocessing approaches. This comprehensive investigation was carried out with eight data sets generated by multiple laboratories from various MS instruments and proteomes using both commercial software and an in-house algorithm. It was found Percolator-associated approaches showed consistently better performances in both the identification and the label-free quantification for all data sets regardless of the search engines and, therefore, is advisable for proteomic analysis. The second-best strategies (without Percolator) under different data types and search engines were also identified. The results obtained in this study are highly valuable for directing the design and optimization of proteomics experiments.
Data Sharing
We have provided all the new raw files associated with this paper for free downloading. The project, “Investigation of Search Engines and Postprocessing Algorithms (ID: 819)”, is presented at www.chorusproject.org.
Supplementary Material
Acknowledgments
This work was supported, in part, by the American Heart Association (AHA) award 12SDG9450036 (J.Q.), by a Center of Protein Therapeutics Industrial Award (J.Q.), and by NIH grants U54HD071594 and HL103411 (J.Q.) as well as R01DK081750 (Z.Y.).
Footnotes
Notes
The authors declare no competing financial interest.
The Supporting Information is available free of charge on the ACS Publications website at DOI: 10.1021/acs.jproteome.5b00536.
A list of the features used in Percolator v2.04 to train Percolator support vector machines. (PDF)
Figures showing the overlap of distinct peptides identified by different filtering approaches: score-based, group-based, LFDR, PeptideProphet, and Percolator coupled with Mascot (A) and MS Amanda (B), respectively; comparison of PSM, distinct peptide, and protein group identification at 1% protein FDR with respective SEQUEST, Mascot, and MS Amanda search engines coupled with score-based filtering approach; comparison of PSM, distinct peptide, and protein group identification at 1% protein FDR with respective SEQUEST-score and Mascot-score combinations; comparison of PSMs, distinct peptides, and protein groups at 1% protein FDR with respective MS-GF+ (E-value), Mascot-Percolator, Mascot-PeptideProphet/iProphet, and MaxQuant (Andromeda) approaches. (PDF)
References
- 1.Eng JK, McCormack AL, Yates JR. An approach to correlate tandem mass spectral data of peptides with amino acid sequences in a protein database. J Am Soc Mass Spectrom. 1994;5:976–989. doi: 10.1016/1044-0305(94)80016-2. [DOI] [PubMed] [Google Scholar]
- 2.Perkins DN, Pappin DJ, Creasy DM, Cottrell JS. Probability-based protein identification by searching sequence databases using mass spectrometry data. Electrophoresis. 1999;20:3551–3567. doi: 10.1002/(SICI)1522-2683(19991201)20:18<3551::AID-ELPS3551>3.0.CO;2-2. [DOI] [PubMed] [Google Scholar]
- 3.Colinge J, Masselot A, Giron M, Dessingy T, Magnin J. OLAV: towards high-throughput tandem mass spectrometry data identification. Proteomics. 2003;3:1454–1463. doi: 10.1002/pmic.200300485. [DOI] [PubMed] [Google Scholar]
- 4.Geer LY, Markey SP, Kowalak JA, Wagner L, Xu M, Maynard DM, Yang X, Shi W, Bryant SH. Open mass spectrometry search algorithm. J Proteome Res. 2004;3:958–964. doi: 10.1021/pr0499491. [DOI] [PubMed] [Google Scholar]
- 5.Craig R, Beavis RC. TANDEM: matching proteins with tandem mass spectra. Bioinformatics. 2004;20:1466–1467. doi: 10.1093/bioinformatics/bth092. [DOI] [PubMed] [Google Scholar]
- 6.Tabb DL, Fernando CG, Chambers MC. MyriMatch: highly accurate tandem mass spectral peptide identification by multivariate hypergeometric analysis. J Proteome Res. 2007;6:654–661. doi: 10.1021/pr0604054. [DOI] [PMC free article] [PubMed] [Google Scholar]
- 7.Cox J, Neuhauser N, Michalski A, Scheltema RA, Olsen JV, Mann M. Andromeda: a peptide search engine integrated into the MaxQuant environment. J Proteome Res. 2011;10:1794–1805. doi: 10.1021/pr101065j. [DOI] [PubMed] [Google Scholar]
- 8.Wenger CD, Coon JJ. A proteomics search algorithm specifically designed for high-resolution tandem mass spectra. J Proteome Res. 2013;12:1377–1386. doi: 10.1021/pr301024c. [DOI] [PMC free article] [PubMed] [Google Scholar]
- 9.Dorfer V, Pichler P, Stranzl T, Stadlmann J, Taus T, Winkler S, Mechtler K. MS Amanda, a universal identification algorithm optimized for high accuracy tandem mass spectra. J Proteome Res. 2014;13:3679–3684. doi: 10.1021/pr500202e. [DOI] [PMC free article] [PubMed] [Google Scholar]
- 10.Elias JE, Gygi SP. Target-decoy search strategy for increased confidence in large-scale protein identifications by mass spectrometry. Nat Methods. 2007;4:207–214. doi: 10.1038/nmeth1019. [DOI] [PubMed] [Google Scholar]
- 11.Keller A, Nesvizhskii AI, Kolker E, Aebersold R. Empirical statistical model to estimate the accuracy of peptide identifications made by MS/MS and database search. Anal Chem. 2002;74:5383–5392. doi: 10.1021/ac025747h. [DOI] [PubMed] [Google Scholar]
- 12.Kim S, Gupta N, Pevzner PA. Spectral probabilities and generating functions of tandem mass spectra: a strike against decoy databases. J Proteome Res. 2008;7:3354–3363. doi: 10.1021/pr8001244. [DOI] [PMC free article] [PubMed] [Google Scholar]
- 13.Renard BY, Timm W, Kirchner M, Steen JA, Hamprecht FA, Steen H. Estimating the confidence of peptide identifications without decoy databases. Anal Chem. 2010;82:4314–4318. doi: 10.1021/ac902892j. [DOI] [PubMed] [Google Scholar]
- 14.Choi H, Ghosh D, Nesvizhskii AI. Statistical validation of peptide identifications in large-scale proteomics using the target-decoy database search strategy and flexible mixture modeling. J Proteome Res. 2008;7:286–292. doi: 10.1021/pr7006818. [DOI] [PubMed] [Google Scholar]
- 15.Sadygov RG, Liu H, Yates JR. Statistical models for protein validation using tandem mass spectral data and protein amino acid sequence databases. Anal Chem. 2004;76:1664–1671. doi: 10.1021/ac035112y. [DOI] [PubMed] [Google Scholar]
- 16.Ulintz PJ, Zhu J, Qin ZS, Andrews PC. Improved classification of mass spectrometry database search results using newer machine learning approaches. Mol Cell Proteomics. 2006;5:497–509. doi: 10.1074/mcp.M500233-MCP200. [DOI] [PubMed] [Google Scholar]
- 17.Kall L, Canterbury JD, Weston J, Noble WS, MacCoss MJ. Semi-supervised learning for peptide identification from shotgun proteomics datasets. Nat Methods. 2007;4:923–925. doi: 10.1038/nmeth1113. [DOI] [PubMed] [Google Scholar]
- 18.Klammer AA, Reynolds SM, Bilmes JA, MacCoss MJ, Noble WS. Modeling peptide fragmentation with dynamic Bayesian networks for peptide identification. Bioinformatics. 2008;24:i348–356. doi: 10.1093/bioinformatics/btn189. [DOI] [PMC free article] [PubMed] [Google Scholar]
- 19.Spivak M, Weston J, Bottou L, Kall L, Noble WS. Improvements to the percolator algorithm for Peptide identification from shotgun proteomics data sets. J Proteome Res. 2009;8:3737–3745. doi: 10.1021/pr801109k. [DOI] [PMC free article] [PubMed] [Google Scholar]
- 20.Granholm V, Noble WS, Kall L. A cross-validation scheme for machine learning algorithms in shotgun proteomics. BMC Bioinf. 2012;13:S3. doi: 10.1186/1471-2105-13-S16-S3. [DOI] [PMC free article] [PubMed] [Google Scholar]
- 21.Choi H, Nesvizhskii AI. Semisupervised model-based validation of peptide identifications in mass spectrometry-based proteomics. J Proteome Res. 2008;7:254–265. doi: 10.1021/pr070542g. [DOI] [PubMed] [Google Scholar]
- 22.Searle BC, Emmons CJ, Head B. Improving Peptide and Protein Identification Rates Using a Novel Semi-Supervised Approach in Scaffold (Abstract (3141)). ASMS 61st Conference on Mass Spectrometry; Minnesota, United States. June 9–13, 2013. [Google Scholar]
- 23.Sheng Q, Dai J, Wu Y, Tang H, Zeng R. Build Summary: using a group-based approach to improve the sensitivity of peptide/ protein identification in shotgun proteomics. J Proteome Res. 2012;11:1494–1502. doi: 10.1021/pr200194p. [DOI] [PubMed] [Google Scholar]
- 24.Michalski A, Damoc E, Hauschild JP, Lange O, Wieghaus A, Makarov A, Nagaraj N, Cox J, Mann M, Horning S. Mass spectrometry-based proteomics using Q Exactive, a high-performance benchtop quadrupole Orbitrap mass spectrometer. Mol Cell Proteomics. 2011;10:M111.011015. doi: 10.1074/mcp.M111.011015. [DOI] [PMC free article] [PubMed] [Google Scholar]
- 25.Hebert AS, Richards AL, Bailey DJ, Ulbrich A, Coughlin EE, Westphall MS, Coon JJ. The one hour yeast proteome. Mol Cell Proteomics. 2014;13:339–347. doi: 10.1074/mcp.M113.034769. [DOI] [PMC free article] [PubMed] [Google Scholar]
- 26.Zhang X, Ma D, Caruso M, Lewis M, Qi Y, Yi Z. Quantitative phosphoproteomics reveals novel phosphorylation events in insulin signaling regulated by protein phosphatase 1 regulatory subunit 12A. J Proteomics. 2014;109C:63–75. doi: 10.1016/j.jprot.2014.06.010. [DOI] [PMC free article] [PubMed] [Google Scholar]
- 27.Tu C, Li J, Jiang X, Sheflin LG, Pfeffer BA, Behringer M, Fliesler SJ, Qu J. Ion-current-based proteomic profiling of the retina in a rat model of Smith-Lemli-Opitz syndrome. Mol Cell Proteomics. 2013;12:3583–3598. doi: 10.1074/mcp.M113.027847. [DOI] [PMC free article] [PubMed] [Google Scholar]
- 28.Duan X, Young R, Straubinger RM, Page B, Cao J, Wang H, Yu H, Canty JM, Qu J. A straightforward and highly efficient precipitation/on-pellet digestion procedure coupled with a long gradient nano-LC separation and Orbitrap mass spectrometry for label-free expression profiling of the swine heart mitochondrial proteome. J Proteome Res. 2009;8:2838–2850. doi: 10.1021/pr900001t. [DOI] [PMC free article] [PubMed] [Google Scholar]
- 29.Tu C, Mammen MJ, Li J, Shen X, Jiang X, Hu Q, Wang J, Sethi S, Qu J. Large-scale, ion-current-based proteomics investigation of bronchoalveolar lavage fluid in chronic obstructive pulmonary disease patients. J Proteome Res. 2014;13:627–639. doi: 10.1021/pr4007602. [DOI] [PMC free article] [PubMed] [Google Scholar]
- 30.Elias JE, Haas W, Faherty BK, Gygi SP. Comparative evaluation of mass spectrometry platforms used in large-scale proteomics investigations. Nat Methods. 2005;2:667–675. doi: 10.1038/nmeth785. [DOI] [PubMed] [Google Scholar]
- 31.Washburn MP, Wolters D, Yates JR., 3rd Large-scale analysis of the yeast proteome by multidimensional protein identification technology. Nat Biotechnol. 2001;19:242–247. doi: 10.1038/85686. [DOI] [PubMed] [Google Scholar]
- 32.Lange V, Picotti P, Domon B, Aebersold R. Selected reaction monitoring for quantitative proteomics: a tutorial. Mol Syst Biol. 2008;4:222. doi: 10.1038/msb.2008.61. [DOI] [PMC free article] [PubMed] [Google Scholar]
- 33.Tu C, Sheng Q, Li J, Shen X, Zhang M, Shyr Y, Qu J. ICan: An Optimized Ion-Current-Based Quantification Procedure with Enhanced Quantitative Accuracy and Sensitivity in Biomarker Discovery. J Proteome Res. 2014;13:5888–5897. doi: 10.1021/pr5008224. [DOI] [PMC free article] [PubMed] [Google Scholar]
- 34.Tu C, Li J, Sheng Q, Zhang M, Qu J. Systematic Assessment of Survey Scan and MS2-Based Abundance Strategies for Label-Free Quantitative Proteomics Using High-Resolution MS Data. J Proteome Res. 2014;13:2069–2079. doi: 10.1021/pr401206m. [DOI] [PMC free article] [PubMed] [Google Scholar]
- 35.Brosch M, Yu L, Hubbard T, Choudhary J. Accurate and sensitive peptide identification with Mascot Percolator. J Proteome Res. 2009;8:3176–3181. doi: 10.1021/pr800982s. [DOI] [PMC free article] [PubMed] [Google Scholar]
- 36.Xu M, Li Z, Li L. Combining percolator with X!Tandem for accurate and sensitive peptide identification. J Proteome Res. 2013;12:3026–3033. doi: 10.1021/pr4001256. [DOI] [PubMed] [Google Scholar]
- 37.Shteynberg D, Nesvizhskii AI, Moritz RL, Deutsch EW. Combining results of multiple search engines in proteomics. Mol Cell Proteomics. 2013;12:2383–2393. doi: 10.1074/mcp.R113.027797. [DOI] [PMC free article] [PubMed] [Google Scholar]
- 38.Searle BC, Turner M, Nesvizhskii AI. Improving sensitivity by probabilistically combining results from multiple MS/MS search methodologies. J Proteome Res. 2008;7:245–253. doi: 10.1021/pr070540w. [DOI] [PubMed] [Google Scholar]
- 39.Kim S, Pevzner PA. MS-GF+ makes progress towards a universal database search tool for proteomics. Nat Commun. 2014;5:5277. doi: 10.1038/ncomms6277. [DOI] [PMC free article] [PubMed] [Google Scholar]
- 40.Tyanova S, Temu T, Carlson A, Sinitcyn P, Mann M, Cox J. Visualization of LC-MS/MS proteomics data in MaxQuant. Proteomics. 2015;15:1453–1456. doi: 10.1002/pmic.201400449. [DOI] [PMC free article] [PubMed] [Google Scholar]
- 41.Shteynberg D, Deutsch EW, Lam H, Eng JK, Sun Z, Tasman N, Mendoza L, Moritz RL, Aebersold R, Nesvizhskii AI. iProphet: multi-level integrative analysis of shotgun proteomic data improves peptide and protein identification rates and error estimates. Mol Cell Proteomics. 2011;10:M111.007690. doi: 10.1074/mcp.M111.007690. [DOI] [PMC free article] [PubMed] [Google Scholar]
- 42.Granholm V, Kim S, Navarro JC, Sjolund E, Smith RD, Kall L. Fast and accurate database searches with MS-GF+Percolator. J Proteome Res. 2014;13:890–897. doi: 10.1021/pr400937n. [DOI] [PMC free article] [PubMed] [Google Scholar]
Associated Data
This section collects any data citations, data availability statements, or supplementary materials included in this article.