

Abstract
Objective: To compare Osterix and Nestin-Cre/Loxp system in studying the biological functions of murine osteoblastic cells including primary osteoblasts (OBs) and osteolineage mesenchymal progenitor cells (MPCs). Methods: We isolated primary osteoblasts (OBs) from neonatal Nestin-cre-R26-loxP-YFP (Nes-OBs) and Osterix-cre-R26-loxP-YFP (Osx-OBs) mice and bone marrow mesenchymal stromal cells (BMMSCs) from the adults (termed as Nes-BMMSCs and Osx-BMMSCs). Then we detected the percentage of YFP+ subpopulation in Nes/Osx-OBs and the percentage of CD45-YFP+ progenitor population in Nes/Osx-BMMSCs and sorted them out (termed as Nes/Osx-YFP+ OBs and Nes/Osx-CD45-YFP+ MPCs) by using the sorting machine. We also analyzed the expression of surface antigens on Nes/Osx-YFP+ OBs and Nes/Osx-CD45-YFP+ MPCs by Flow cytometry. PDGF-BB induced proliferation of Nes/Osx-YFP+ OBs and Nes/Osx-CD45-YFP+ MPCs was measured by H3-Thymidine incorporation assay. We then did OB maturation and mineralization assays of Nes/Osx-YFP+ OBs and CFU and multi-lineage differentiation assays of Nes/Osx-CD45-YFP+ MPCs. Results: YFP+% in Nes-OBs and Osx-OBs and CD45-YFP+% in Nes-BMMSCs and Osx-BMMSCs was respectively 5.56%±3.56% (n=5), 10.12%±2.7% (n=4), 1.29%±0.98% (n=13) and 16.38%±6.98% (n=17). Both Nes-YFP+ OBs and Osx-YFP+ OBs were positive for CD51. Nes/Osx-CD45-YFP+ MPCs were positive for CD51, CD105 and Sca1, and negative for CD31 and CD45. PDGFR expression in Osx-YFP+ OBs was a bit higher than that in Nes-YFP+ OBs, and slightly higher in Osx-CD45-YFP+ MPCs than in Nes-CD45-YFP+ MPCs. Proliferation ability of Nes/Osx-YFP+ OBs increased dramatically after stimulated with PDGF-BB for 48 h, while it was not statistically significant that PDGF-BB induced the increase of proliferation ability in either Nes-CD45-YFP+ MPCs or Osx-CD45-YFP+ MPCs. We observed that no significant difference of OB maturation and mineralization ability existed between Nes-YFP+ OBs and Osx-YFP+ OBs, and there was little difference of self-renewal and multi-lineage differentiation potential between Nes-CD45-YFP+ MPCs and Osx-CD45-YFP+ MPCs, either. Conclusion: Both Nestin and Osterix could be selected as useful markers for the osteoblastic cells, while Osterix was a prior choice due to larger number of Osterix-expressing cells than Nestin-expressing cells in distinct subpopulations of bone-forming cells.
Keywords: Osteoblasts, mesenchymal progenitor cells, Nestin, osterix, Cre/loxp
Introduction
Bone marrow mesenchymal stromal cells (BMMSCs) derived osteoblastic cells (OBCs), including osteoblast-lineage progenitors and mature osteoblasts, play a major role in the formation and homeostasis of skeleton system [1]. With the induction of microenvironmental factors such as mechanical stress [2], oxygen content [3] and various cytokines [4,5], osteoblastic progenitor cells can migrate to the bone-forming areas and differentiate into functional osteoblasts. Apart from their critical effect on the maintenance of bone homeostasis, increasing evidences demonstrate that osteoblastic cells can organize a hematopoietic microenvironment and support the hematopoietic development [6-9]. Schepers et al. [10] show that functionally altered OBCs exhibit effectively leukemic stem cell (LSC)-supporting ability instead of the ability to maintain normal hematopoietic stem cells (HSCs). Other studies reveal that osteoblasts are an important component of the B lymphocyte niche, which can regulate bone marrow B lymphopoiesis extrinsically [11].
Being essential in maintaining normal hematopoiesis and bone homeostasis, osteoblastic cells together with other multi-lineage progenitor populations and their progenies constitute the cellular component of BM mesenchymal stroma [12]. Thus BMMSCs are highly heterogeneous cell populations. Researchers are trying to identify and isolate a pure population of multipotent MSCs by using various surface marker combinations. However, the results are unclear or conflicting. For instance, platelet-derived growth factor receptor a (PDGFR-a) and stem cell antigen 1 (Sca-1) have recently been identified as selective markers of murine MSCs [13]. Nonetheless, Li et al. [14] suggest that low/negative expression of PDGFR-a on Lin-/CD45- BM cells can identify a cell population with very high MSC activities including fibroblastic colony-forming unit frequency and typical in vitro differentiation capacities. Recently, emerging genetic driver/reporter-murine lines have been used to trace specific stromal populations [6,15-17]. By using Nestin-GFP transgenic mice Mendez-Ferrer et al. [6] verify that CD45-Nes-GFP+ cells are MSCs, which can form multipotent and self-renewing mesenspheres, contribute to osteochondral lineages and maintain HSCs in the BM. Another study with genetic drivers demonstrates that Osterix, a marker for committed osteo-lineage progenitors, can trace distinct populations of primitive and definitive stromal progenitors during BM development [16].
Nestin, first identified as a marker of neural stem cells [18], has now become the best known marker for the multi-potential MSC population [6,19]. Co-expression of nestin with lineage-specific marker proteins is defined as the onset of cell lineage specification before terminal differentiation [19]. Studies suggest that Nestin+ MSCs, localized near mature osteoblasts, can differentiate into bone-forming cells and contribute to skeletal remodeling [6]. Osterix, a zinc-finger-containing transcription factor essential for osteoblast differentiation and bone formation, is specifically expressed in osteoblast lineage cells [20]. However, recent studies show that Osterix could trace multiple cell types besides osteoblast lineage [21]. By using Osx-Cre mouse, Liu et al. [22] demonstrate that Osx-Cre labeled embryonic progenitors could give rise to adult BM progenitors which contribute to the formation and maintenance of the BM stroma. Osx-Cre has been observed to target mainly osteoblast lineage cells during embryogenesis, while at the adult age it targets not only osteoblastic cells, but also stromal cells, adipocytes and perivascular cells in the BM [21]. On the other side, it is also reported that Osterix-expressing cells, perinatally contribute to osteolineage and BM stroma with characteristics of Nestin+ MSCs, while osteolineage-restricted and devoid of stromal contribution in the adult marrow [16].
Site-specific Cre/loxp recombination system is universally used in specific cell-targeting studies [21,23]. In the present study, we used two kinds of mouse strains to target osteoblastic cells by using Cre/loxp technology. One of the strains was Nestin-Cre-R26-loxP-YFP (Nes-YFP) mice and the other was Osterix-Cre-R26-loxP-YFP (Osx-YFP) mice. For the mouse strain of Nes-YFP, Cre locates downstream of Nestin promoter. Only the cells expressing Nestin are able to activate the expression of Cre recombinase. As a reporter of the expression of Cre recombinase, YFP could only be expressed in the cell population that is positive for Cre recombinase. Therefore, only the YFP+ cell population can be regarded as the Nestin-expressing cells [15,23,24]. Osterix-expressing cells can be identified in the counterpart of Osx-YFP mouse strain.
We observed that there was no significant difference of biological functions between osteoblastic cells derived from these two mouse strains. However, percentage of YFP positive cell population was much higher in osteoblastic cells isolated from Osx-YFP mice than those isolated from Nes-YFP mice. We concluded that both Nestin and Osterix could be used as cell-type specific markers in studying biological functions of osteoblastic cells, while Osterix was a prior choice due to higher percentage of Osterix-expressing cells than Nestin-expressing cells in distinct subpopulations of bone-forming cells.
Materials and methods
Mice
Nestin-Cre-R26-loxP-YFP (Nes-YFP) and Osterix-Cre-R26-loxP-YFP (Osx-YFP) mice were derived and maintained in the Biological Resource Center at the Medical College of Wisconsin. Animal protocols were approved by the Medical College of Wisconsin Institutional Animal Care and Use Committee.
Genotyping
We did genotyping to detect the expression of Cre and YFP in neonatal and adult mice from both Nes-YFP and Osx-YFP mouse breeders. Primers of Cre and YFP were as follows:
3’Cre770: 5’-GCATT GCTGT CACTT GGT CGT-3’; 5’Cre483: 5’-CGATG CAACG AGTGA TGAGG-3’; YFPRosa26R P1: 5’-AAAGTC GCTCTG AGTTGT ATA-3’; YFPRosa26R P2: 5’-GCGAAG AGTTTG TCCTCA ACC-3’; YFPRosa26R P3: 5’-GGAGCG GGAGAA ATGGAT ATG-3’; Mice expressing both Cre and YFP were used for isolating primary OBs and MPCs.
Isolation of primary OBs
New born mice (P2-P4) positive for both Cre and YFP were sacrificed for the isolation of primary OBs. Briefly, We dissected calvarias from euthanized pups, discarded the covered soft tissues, cut them into little pieces and digested with trypsin (0.05%, Corning) for 20 minutes and continually type I collagenase (1 mg/ml, Sigma) for 1 hour. The product of digestion was centrifuged (400 g, 5 min), seeded in 60 mm culture dishes and cultured in α-MEM (Corning) supplemented with 10% FBS (Hyclone), 0.2 mM glutamine, 0.1 mM pyruvate, 100 units/ml penicillin/streptomycin (Corning). After 3 days we observed that fusiform primary OBs grew out of bone chips. We passaged OBs 1 week later when they became confluent.
Flow cytometry analysis (FACS) and cell sorting of primary OBs
1×10⁵ primary OBs at P1 were harvested and incubated for 30 min with CD51-Phycoerythrin (PE) (BD pharmingen) and PDGFR-Allophycocyanin (APC) (eBioscience) at 4°C. After washed with PBS supplemented with 2% FBS, the cell samples were analysed by LSRII (BD, USA). By using FlowJo 7.6 we compared the percentage of YFP+ cell population in Nes-OBs (n=5) and Osx-OBs (n=4). Expression of CD51 and PDGFR was then compared between Nes-YFP+ OBs and Osx-YFP+ OBs. Rest of Nes/Osx-OBs were expanded and processed for the sorting of YFP+ population at passage 2 by using the sorting machine (BD, USA).
OB functional assays
2×10⁵ Nes/Osx-YFP+ OBs were seeded into each well of 6-well plates for OB functional study. After 5 days-cultured in OB differentiation-inducted medium (α-MEM, 10% FBS, 5 mM glycerophosphate, and 10 mg/ml ascorbic acid), we did Alkaline Phosphatase (ALP, Sigma, St Louis, MO) staining for both cell populations. In addition, calcium nodules were observed and counted after another 1 week culture.
RT-PCR
Total mRNA was purified from Nes/Osx-YFP+ OBs before and after 12 days of OB differentiation, processed for reverse transcription and real-time PCR respectively by using the RNeasy Plus Universal Mini Kit, miScript Reverse Transcription kit and miScript SYBR Green PCR kit (QIAGEN) according to the manufacturer’s instructions. Primers used for the PCR amplifications were as follows: actin F: 5’-CCACAGCTGAGAGGGAAATC-3’, actin R: 5’-CTTCTCCAGGGAGGAAGAGG)-3’, osteoprotegerin F: 5’-CTCCTTGCGCCACAGAATG-3’, osteoprotegerin R: 5’-TGGGCAACAGGGATGACA-3’, collagenI F: 5’-CACCCTCAAGAGCCTGAGTC-3’, collagenI R: 5’-GTTCGGGCTGATGTACCAGT-3’. Products of the real-time PCR were then processed for 1.5% agarose gel running.
Isolation of BMMSCs
To isolate MPCs, as Mendez-Ferrer [6] described, BM from femora, tibia and humeri of 10 weeks-old Osx/Nes-YFP mice were flushed into sterile PBS with 2% FBS. After lysed with Red cell lysis buffer (RCL), 1×10⁶ bone marrow mononuclear cells (BMMNCs) were used for in vivo Flow Cytometry analysis, others were cultured in Complete MesenCult® Medium (Stem Cell Technology Inc.). After 24 hours, non-adherent BMMNCs were removed by washing with PBS and adherent cells (BMMSCs) were processed for medium change every 3 days.
FACS and cell sorting of BMMSCs
For in vivo flow cytometry analysis, according to Winkler [25], 1×10⁶ BMMNCs were incubated with Lin (CD4, CD8, NK1.1, B220, Ter119, Mac1, Gr-1)-APC, CD45-Allophycocyanin/Cy7 (APC/Cy7), CD31-PE, Sca1-Phycoerythrin/Cy7 (PE/Cy7), CD51-biotin-PE-Texas Red/Cy5 (PE-TR/Cy5) (All these antibodies were from eBioscience) and then processed as mentioned above. When analysed with LSRII, Mesenchymal stem cell (MSC) subset was gated as Lin-CD45-CD31-Sca1+CD51+, osteoblastic-lineage cell (OBC) subset was gated as Lin-CD45-CD31-Sca1-CD51+, hematopoietic cell (HPC) subset was gated as Lin-CD45+ and endothelial cell (EC) subset was gated as Lin-CD45-CD31+. Percentage of YFP+ subpopulations in these four subsets was respectively detected in both Nes-BMMNCs and Osx-BMMNCs.
For in vitro flow cytometry analysis, Nes/Osx-BMMSCs (P1) were digested and respectively stained with CD31-PE/CD45-APC, CD51-PE/CD45-APC, CD105-PE/CD45-APC, Sca1-PE/CD45-APC and PDGFR-APC/CD45-PE. Percentage of CD45-YFP+ subpopulations was first compared between Nes-BMMSCs (n=13) and Osx-BMMSCs (n=17). Then we analysed the expression of CD31, CD51, CD105, Sca1 and PDGFR in both Nes-CD45-YFP+ MPCs and Osx-CD45-YFP+ MPCs.
Remaining Nes/Osx-BMMSCs were passaged and processed for the sorting of CD45-YFP+ subpopulations. Sorted Nes/Osx-CD45-YFP+ MPCs were expanded and used for the CFU, proliferation and multi-lineage differentiation assays.
Colony forming unit (CFU) assay
100 Nes/Osx-CD45-YFP+ MPCs were seeded into each well of 6-well plates at a concentration of 3 cells/cm2. Each cell population was processed for duplicate. After two weeks of culture, colonies formed from single cell were fixed in 4% paraformaldehyde. Then we performed Giemsa staining after washing with PBS for three times.
Multi-lineage differentiation assay
For osteogenesis and adipogenesis, Nes/Osx-CD45-YFP+ MPCs were seeded into 24-well plate with a density of 2×10⁴ per well. When became 80% confluence, 4 wells of each cell population was respectively changed with osteogenic differentiation medium (α-MEM supplemented with 10% FBS, 100 nM Dexamethasone, 50 µg/mL Ascorbic acid and 10 mM β-glycerophosphate) and adipogenic differentiation medium (α-MEM supplemented with 10% FBS, 10-6 M dexamethasone, 0.5 µM IBMX, 10 ng/ml (wt/vol) insulin). Another 4 wells of Nes/Osx-CD45-YFP+ MPCs were still cultured in Complete MesenCult® Medium as control groups. After 3 weeks of osteogenic differentiation and 2 weeks of adipogenic differentiation, both differentiation-inducted groups and control groups of these two cell populations were respectively fixed for ALP staining, Alizarin Red staining and Oil Red O staining (Sigma). For chondrogenesis, 1×10⁶ Nes/Osx-CD45-YFP+ MPCs were placed as cell pellets in a 15-ml polypropylene tube and cultured in the chondrogenic medium (high-glucose DMEM supplemented with 10% FBS, 10-7 M dexamethasone, 1% ITS, 50 µM ascorbate acid, 1 mM sodium pyruvate, 50 µg/ml proline and 20 ng/ml TGF-β3) for 4 weeks. The medium was also changed every 3 days. Chondrogenic differentiation was finally assessed by toluidine blue staining (Sigma).
Thymidine incorporation assay
Nes/Osx-YFP+ OBs and Nes/Osx-CD45-YFP+ MPCs were respectively seeded into 96-well plates with a density of 5000/well. 24 hours later, these cells were washed with PBS for 3 times and respectively cultured for 2 days with α-MEM (2% FBS) alone, α-MEM (2% FBS) with PDGF-BB (10 ng/ml, Peprotech.) and α-MEM (2% FBS) with PDGF-BB (50 ng/ml). Each group was processed for triplicate. Then 20 ul of 0.05 ui/ul 3H-Thymidine in complete α-MEM was added to each well. After incubated at 37°C, 5% CO2 for 16 hours, the cells were digested with 50 ul 0.05% Trypsine (Perkin Elmer) and harvested by harvester (Molecular devices). Radioactivity of each well was at last counted with 1450 microbeta-counter (Perkin Elmer).
Statistics
Data were evaluated by unpaired Student’s t test. Statistical analyses were performed with Graph Pad Prism 5. P < 0.05 was considered statistically significant.
Results
YFP+ cell populations present uniform morphology
Mice genotyped as positive for both YFP and Cre (NO. 1, 2 and 9 in Figure 1A) were sacrificed for the isolation of primary OBs and BMMSCs. Morphology of 7-day cultured OBs was shown in Figure 1Ba. We could observe that most of the cells were fusiform with quite large size. Cells in Figure 1Bb were the YFP+ subpopulation sorted from primary OBs at passage 2. Figure 1Bc showed the morphology of BMMSCs before sorting, in which we could observe different cell populations with oval, polygonand fusiform shapes. CD45-YFP+ MPCs sorted from BMMSCs exhibited fibroblast-like and radial arrangement in Figure 1Bd. According to the morphology characteristics of these cells we cultured and sorted, they might be the OB and MPC populations we needed for the following assays.
Figure 1.
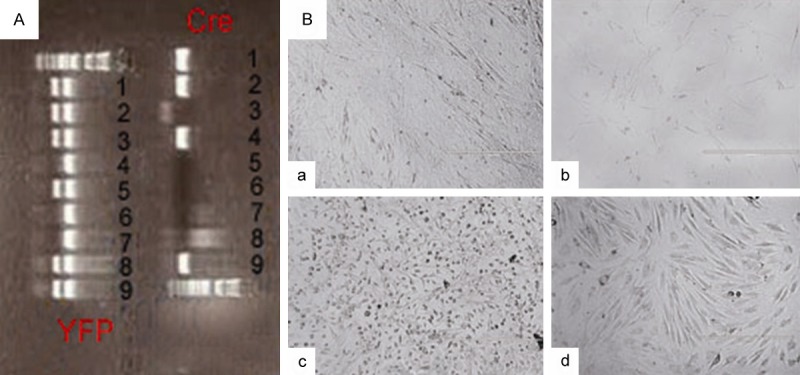
Morphology of OBs and BMMSCs isolated from Cretg/+YFPtg/+ neonatal and adult mice. (A) Genotyping result of 9 mice from the same litter. It showed the expression of Cre in mice of NO. 1, 2, 4, 9 and the expression of YFP in mice of NO. 1, 2, 3, 5, 8, 9, thus we used mice of NO. 1, 2, 9, which were positive for both Cre and YFP, for experiments. (B) Morphology of primary OBs (a) and BMMSCs (c) before sorting and the sorted YFP+ OBs (b) and CD45-YFP+ MPCs (d) (×100).
Percentage of YFP+ subpopulation in Nestin-tracing osteoblastic cells was lower than that in Osxterix-tracing osteoblastic cells
Nes/Osx-BMMNCs derived MSC (S5), OBC (S6), HPC (S2) and EC (S3) subsets, as shown in Figure 2A, were respectively gated as Lin-CD45-CD31-Sca1+CD51+, Lin-CD45-CD31-Sca1-CD51+, Lin-CD45+ and Lin-CD45-CD31+ in the in vivo FACS analysis. Results of FACS analysis showed that percentage of YFP+ subpopulation in MSC (Figure 2Ba) subset from Nes-BMMNCs (Figure 2Ba-d) was a bit higher than that in OBC (Figure 2Bb) and HPC (Figure 2Bc) subsets. However, the difference was not statistically significant (Figure 2Ci). For the subsets from Osx-BMMNCs (Figure 2Be-h), YFP+% in OBC (Figure 2Bf) subset was much higher than that in MSC (Figure 2Be) and HPC (Figure 2Bg) subsets (p<0.05 and p<0.01 respectively, Figure 2Cj). In addition, there was no YFP expression in EC (Figure 2Bd, 2Bh) subsets from both Nes-BMMNCs (Figure 2Bd) and Osx-BMMNCs (Figure 2Bh). We then compared YFP+% in MSC (Figure 2Dk), OBC (Figure 2Dl) and HPC (Figure 2Dm) subsets between Nes-BMMNCs and Osx-BMMNCs. The results revealed that percentage of YFP+ cell population in both MSC and OBC subpopulations from Osx-BMMNCs were notably higher than those from Nes-BMMNCs (p<0.05 for MSC subset and p<0.01 for OBC subset), while YFP+% in HPC subsets from Nes-BMMNCs and Osx-BMMNCs was similar and low. We also measured the percentage of YFP+ subpopulations in Nes/Osx-OBs, and that of CD45-YFP+ subsets in Nes/Osx-BMMSCs. The results showed that percentage of YFP+ cell populations in Nes-OBs and Osx-OBs was respectively 5.57%±3.55% (n=5) and 10.12%±2.7% (n=4) (P=0.042, Figure 3A, 3B), whereas CD45-YFP+ subpopulations respectively accounted for 1.66%±1.63% (n=13) and 16.39%±6.99% (n=17) in Nes-BMMSCs and Osx-BMMSCs (P<0.01, Figure 3C, 3D).
Figure 2.
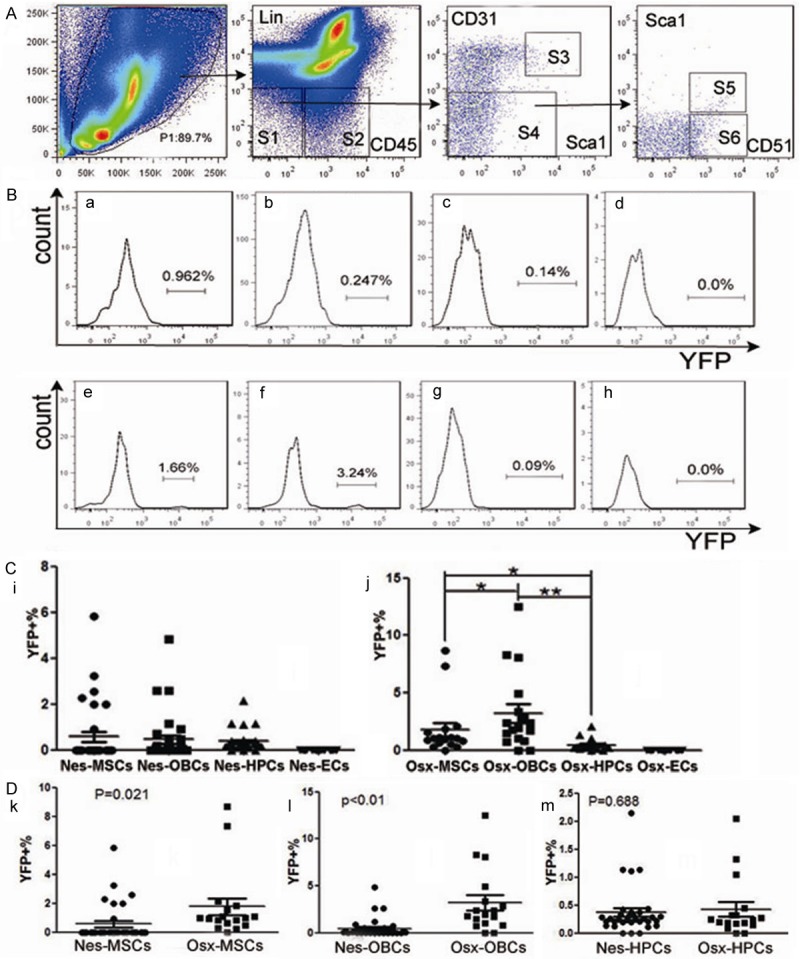
In vivo analysis of the percentage of YFP+ cell population in MSC, OBC, HPC and EC subsets from the BMMNCs of Nes-YFP and Osx-YFP adult mice by Flow cytometry. (A) Gating of MSC (S5: Lin-CD45-CD31-Sca1+CD51+), OBC (S6: Lin-CD45-CD31-Sca1-CD51+), HPC (S2: Lin-CD45+) and EC (S3: Lin-CD45-CD31+) subpopulations in BMMNCs derived from Nes-YFP (n=30) and Osx-YFP (n=17) adult mice. (B) FACS analysis of percentage of YFP+ cell population in MSC (a, e), OBC (b, f), HPC (c, g) and EC (d, h) subsets from Nes-BMMNCs (a-d) and Osx-BMMNCs (e-h). (C) Comparison of YFP+% among MSC, OBC, HPC and EC subpopulations in Nes-BMMNCs (i) and Osx-BMMNCs (j). “*”: p<0.05, “**”: p<0.01. (D) Comparison of YFP+% in cell populations of MSC (k), OBC (l) and HPC (m) between Nes-BMMNCs and Osx-BMMNCs.
Figure 3.
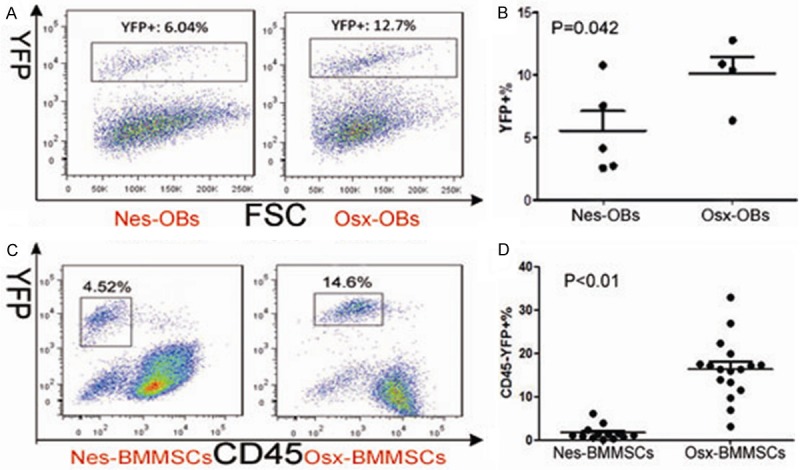
Percentage of YFP+ subpopulations in Nes/Osx-OBs and YFP+CD45-% in Nes/Osx-BMMSCs. (A) Gating of YFP+ cell population in Nes-OBs and Osx-OBs and (B) comparison of YFP+% between them. (C) Gating of CD45-YFP+ cell population in Nes-BMMSCs and Osx-BMMSCs and (D) comparison of CD45-YFP+% between them.
Expression of cell surface antigens was alike in Nes-YFP+ OBs and Osx-YFP+ OBs, and in Nes-CD45-YFP+ MPCs and Osx-CD45-YFP+ MPCs
By using flow cytometry we detected the expression of CD51 and PDGFR in Nes/Osx-YFP+ OBs, and the expression of CD31, CD51, CD105, PDGFR and Sca1 in Nes/Osx-CD45-YFP+ MPCs. As shown in Figure 4, both Nes-YFP+ OBs and Osx-YFP+ OBs were positive for CD51 (Figure 4Be, 4Bg), while PDGFR expression in Osx-YFP+ OBs (Figure 4Bh) was a little higher than that in Nes-YFP+ OBs (Figure 4Bf). Both Nes-CD45-YFP+ MPCs and Osx-CD45-YFP+ MPCs were positive for CD51, CD105 and Sca1, negative for CD31 and partly positive for PDGFR (Figure 4Ci-r). Compared to the expression of PDGFR in Nes-CD45-YFP+ MPCs, its expression was slightly higher in Osx-CD45-YFP+ MPCs. These results demonstrated that Nes/Osx-YFP+ OBs had an immunophenotype character of mature OBs, and surface antigens expression of Nes/Osx-CD45-YFP+ MPCs met the immunophenotype profile of MPCs.
Figure 4.
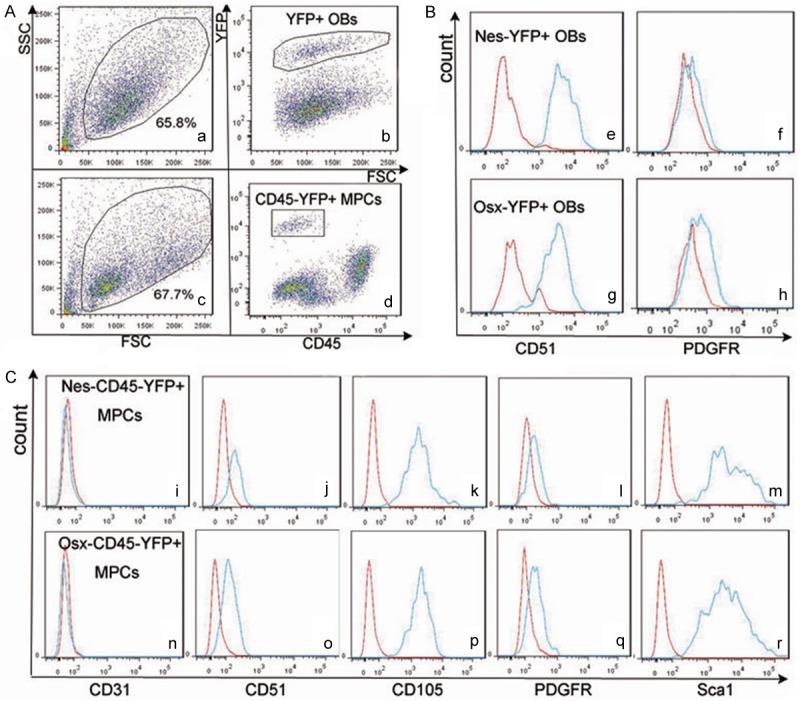
Expression of cell surface antigens in Nes/Osx-YFP+ OBs and Nes/ Osx-CD45-YFP+ MPCs. (A) Gating of YFP+ subpopulation (b) in primary OBs (a) and CD45-YFP+ subpopulation (d) in BMMSCs (c). (B) Expression of CD51 (e, g) and PDGFR (f, h) in Nes-YFP+ OBs (e, f) and Osx-YFP+ OBs (g, h); expression of CD31 (i, n), CD51 (j, o), CD105 (k, p), PDGFR (l, q) and Sca1 (m, r) in Nes-CD45-YFP+ MPCs (i-m) and Osx-CD45-YFP+ MPCs (n-r).
No significant difference of biological functions existed between Nes-YFP+ OBs and Osx-YFP+ OBs, and between Nes-CD45-YFP+ MPCs and Osx-CD45-YFP+ MPCs
Formation of calcium nodules could reflect the mineralization of primary OBs. OB maturation ability could be detected by ALP staining and expression of functional proteins including osteoprotegerin (OPG) and collagen I (ColI). We observed that high frequency of calcium nodules formed in both Nes-YFP+ OBs (Figure 5Aa) and Osx-YFP+ OBs (Figure 5Ab), and there was no obvious difference of calcium nodule frequency between these two populations. For ALP staining, both Nes-YFP+ OBs (Figure 5Ac) and Osx-YFP+ OBs (Figure 5Ad) were highly positive, and no significant difference was observed between them, either. RT-PCR results showed that neither OPG nor ColI was expressed in Nes-YFP+ OBs or Osx-YFP+ OBs before OB differentiation induction. However, after 12 days of induction expression of both OPG and ColI was observed and the expression level was similar in these two populations (Figure 5B).
Figure 5.
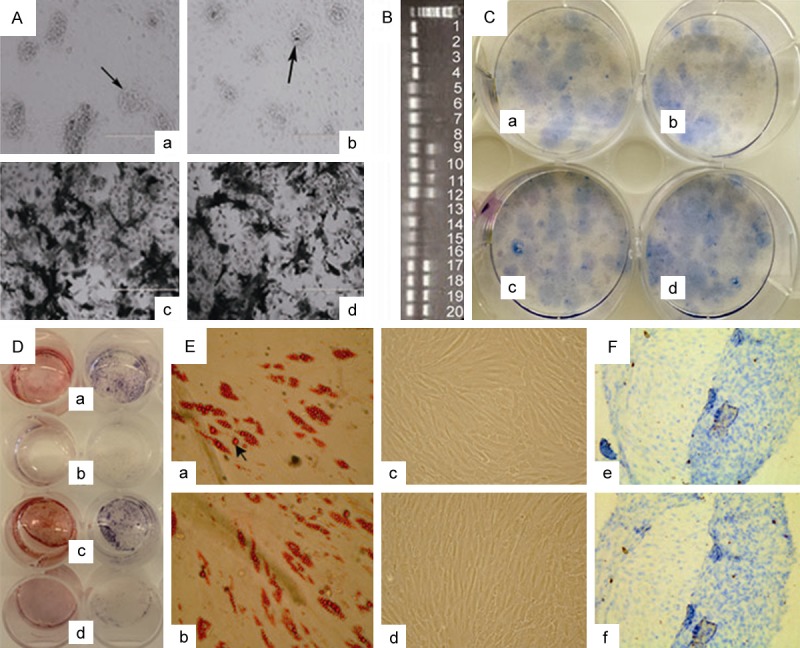
Maturation of Nes/Osx-YFP+ OBs, CFU and multi-lineage differentiation of Nes/Osx-CD45-YFP+ MPCs. (A) Formation of calcium nodules (a, b) and ALP staining (c, d) in Nes-YFP+ OBs (a, c) and Osx-YFP+ OBs (b, d). Black arrow: calcium nodules. (B) RT-PCR result of actin (NO. 1-4), OPN (NO. 5-12) and Cllagen I (NO. 13-20) expression in Nes-YFP+ OBs (N) and Osx-YFP+ OBs (O) before (d0) and after 12 days (d12) of osteoblast differentiation. (NO. 1: N-d0, 2: O-d0, 3: N-d12, 4: O-d12, 5-6: N-d0, 7-8: O-d0, 9-10: N-d12, 11-12: O-d12, 13-14: N-d0, 15-16: O-d0, 17-18: N-d12, 19-20: O-d12). (C) CFU frequency of Nes-CD45-YFP+ MPCs (a, b) and Osx-CD45-YFP+ MPCs (c, d). (D) Alizarin Red staining (left 4 wells of a-d) and ALP staining (right 4 wells of a-d) of osteogenic differentiation groups (a, c) and control groups (b, d) in Nes-CD45-YFP+ MPCs (a, b) and Osx-CD45-YFP+ MPCs (c, d). (E) Oil Red O staining of adipogenic differentiation groups (a, b) and control groups (c, d) in Nes-CD45-YFP+ MPCs (a, c) and Osx-CD45-YFP+ MPCs (b, d). Black arrow: lipid droplets. (F) Toluidine blue staining of chondrogenic differentiation in Nes-CD45-YFP+ MPCs (e) and Osx-CD45-YFP+ MPCs (f).
Result of CFU assay showed that colony frequency was markedly high (about 60 colonies per well) in both Nes-CD45-YFP+ MPCs (Figure 5Ca, 5Cb) and Osx-CD45-YFP+ MPCs (Figure 5Cc, 5Cd), and there was no significant difference between these two populations. After 3 weeks of osteogenic differentiation, both Nes-CD45-YFP+ MPCs (Figure 5Da) and Osx-CD45-YFP+ MPCs (Figure 5Dc) were positive for Alizarin Red (left 4 wells of Figure 5D) and ALP (right 4 wells of Figure 5D) staining, which exhibited negative in the corresponding control groups (Figure 5Db, 5Dd). And no obvious difference of osteogenesis was observed between the two inducted groups. For adipogenesis, we could observe the formation of lipid droplets by Oil Red O staining in both Nes-CD45-YFP+ MPCs (Figure 5Ea) and Osx-CD45-YFP+ MPCs (Figure 5Eb) after 2 weeks of induction and the droplet frequency was similar in these two inducted groups, whereas no lipid droplets displayed in the control groups (Figure 5Ec, 5Ed). After 4 weeks of chondrogenic differentiation, either Nes-CD45-YFP+ MPCs (Figure 5Fe) or Osx-CD45-YFP+ MPCs (Figure 5Ff) were positive for Toluidine blue staining.
PDGF-BB could stimulate the proliferation of Nes/Osx-YFP+ OBs and Nes/Osx -CD45-YFP+ MPCs
Compared to the control groups of Nes-YFP+ OBs and Osx-YFP+ OBs without stimulation of PDGF-BB, proliferation potential of them had dramatically increased after stimulated with PDGF-BB for 48 hours (p<0.05, Figure 6A). However, there was no significant difference of proliferation ability between groups stimulated with PDGF-BB at 10 ng/ml and at 50 ng/ml in either Nes-YFP+ OBs or Osx-YFP+ OBs. For Nes/Osx-CD45-YFP+ MPCs, proliferation capacity of which had also increased with the stimulation of PDGF-BB (10 ng/ml, 50 ng/ml), but it was not statistically significant (Figure 6B).
Figure 6.
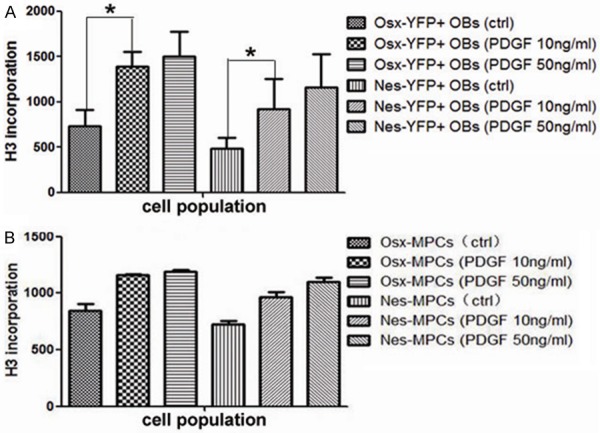
Proliferation ability of Nes/Osx-YFP+ OBs and Nes/Osx-CD45-YFP+ MPCs with or without PDGF-BB stimulation. A. Proliferation ability of Nes/Osx-YFP+ OBs with or without the stimulation of PDGF-BB. “*”: p<0.05. B. Proliferation ability of Nes/Osx-CD45-YFP+ MPCs with or without PDGF-BB stimulation.
Discussion
By using Cre/loxp technology we successfully isolated Nestin-expressing OBs (Nes-YFP+ OBs) and BMMSCs (Nes-CD45-YFP+ MPCs) from Nestin-Cre-R26-loxP-YFP mice and Osxterix-expressing OBs (Osx-YFP+ OBs) and BMMSCs (Osx-CD45-YFP+ MPCs) from Osterix-Cre-R26-loxP-YFP mice. Both Nes-YFP+ OBs and Osx-YFP+ OBs were highly positive for CD51, also known as integrin αV, which plays a critical role in the differentiation and mineralization of osteoblastic cells by acting as a bridge between extracellular matrix and the cytoskeleton [26-28]. CD45, a typical molecule ubiquitously expressed in hematopoietic cells instead of stromal cells [10], was used as a negative marker for MPCs in the present study. Mendez-Ferrer et al. [6] also demonstrated that Nestin-GFP+ subpopulation in the CD45- stromal cells possessed the features of MSCs. We sorted CD45-YFP+ subpopulation from Nes/Osx-BMMSCs and discovered that Nes/Osx-CD45-YFP+ MPCs were positive for CD51, CD105 and Sca1 and negative for CD31. This surface antigens-expressing trait met the immunophenotype characteristics of MSCs insofar as was consistent with most analogous studies [6,10,25,29]. Though low-level expression of PDGFR was observed in all the populations of Nes/Osx-YFP+ OBs and Nes/Osx-CD45-YFP+ MPCs, PDGFR expression in Osx-YFP+ OBs and Osx-CD45-YFP+ MPCs was correspondingly slightly higher than that in Nes-YFP+ OBs and Nes-CD45-YFP+ MPCs. This result in some sense suggested that Nestin-expressing osteoblastic cells were similar to Osterix-expressing osteoblastic cells, but they might have some different biological functions.
We detected YFP+% in different subpopulations of Nes/Osx-BMMNCs and observed that percentage of YFP positive cell population in HPC subpopulations of Nes-BMMNCs and Osx-BMMNCs were similarly low, and no YFP+ cells exhibited in EC subpopulations of either Nes-BMMNCs or Osx-BMMNCs. YFP+% in MSC and OBC subpopulations of Osx-BMMNCs were correspondingly higher than those of Nes-BMMNCs. Though there was no significant difference of YFP+% among MSC, OBC and HPC subpopulations from Nes-BMMNCs, YFP+% in OBC subpopulation from Osx-BMMNCs was dramatically higher than in both MSC and HPC subpopulations. This result demonstrated that there were more Osterix-expressing osteolineage multipotent progenitor cells than Nestin-expressing ones in BM. In addition, it revealed that CD45-YFP+% was still significantly higher in Osx-BMMSCs than in Nes-BMMSCs after adherent culture. Mendez-Ferrer et al. [6] also reported that there were significantly more abundant of Osterix-expressing osteoprogenitors than Nes-GFP+ MSCs in the trabecular bone. Furthermore, we observed that there was also higher percentage of YFP+ cells in primary Osx-OBs than in Nes-OBs. Thus we suggested that there were more Osterix-expressing osteoblastic cells than Nestin-expressing ones in the skeleton system. However, we were not sure whether they were completely different cell populations or not. Actually, some studies assumed that Nes-expressing osteoblastic cells were more relevant to the endochondral ossification during development rather than the skeletal remodeling process in adult, while Osx-expressing osteoblastic cells were critical for the whole process of bone growth [30].
Though Nestin has long been regarded as a marker of multi-lineage progenitor cells [6,19] and Osterix was well known to be a symbol of osteoblastic cells [20,22,31], results of CFU and multi-lineage differentiation assays revealed that there was no notable difference of self-renewal ability and multi-potential between Nes-YFP+CD45- MPCs and Osx-YFP+CD45- MPCs. Based on OB functional assays, maturation and mineralization capacity of Nes-YFP+ OBs and Osx-YFP+ OBs exhibited little difference, either. Thus we concluded that both Nestin and Osterix could be used as important markers targeting osteoblastic cells in future studies. Wong et al. [32] verified that there was no big change of nestin expression in MSCs during osteogenensis, while Nestin+ cells were on the other hand demonstrated to be heterogeneous cell populations in BM development and displayed different potential in different developmental stage [30,33]. For osterix, recent studies confirmed that it marked distinct types of cells during BM development except for osteoblastic cells [16,21]. Mizoguchi et al. [16] validated that osterix-expressing cells perinatally had characteristics of Nestin-expressing MPCs while in the adult marrow was osteolineage-restricted. However, Chen et al. [21] verified that osterix targeted multiple cell types besides osteoblast lineage in the BM of postnatal mice. Therefore, combining nestin or osterix with other cell type-specific surface proteins seems promising to identify osteoblastic cells, as Pinho et al. [34] suggested.
Plenty of researches demonstrated that PDGF could stimulate the growth of osteoblastic cells [4,35,36]. We observed in this study that proliferation capacity of both Nes-YFP+ OBs and Osx-YFP+ OBs apparently increased after stimulated with PDGF-BB for 48 hours. Proliferation potential of each group of Osx-YFP+ OBs (without PDGF-BB stimulation, stimulated with PDGF-BB at 10 ng/ml and 50 ng/ml) was correspondingly a little higher than that of each group of Nes-YFP+ OBs. This result was in coincidence with the expression of PDGFR in Nes-YFP+ OBs and Osx -YFP+ OBs, as shown previously. It indicated that PDGF-PDGFR signaling played a critical role in the growth of both populations of Nes/Osx-YFP+ OBs, albeit the unclear downstream molecular mechanism in this signaling pathway. However, increase of proliferation ability of Nes/Osx-YFP+CD45- MPCs was not statistically significant with the stimulation of PDGF-BB despite their weak expression of PDGFR. Thus we assumed that PDGF-PDGFR signaling pathway in YFP+CD45- MPCs might participate in other biological mechanisms apart from the proliferation process. For example, PDGF-BB could stimulate the migration and osteogenesis of MSCs during bone remolding, as Xie et al. [37] demonstrated. Hence, PDGF-BB had an essential effect on osteoblastic cells, but the effect varied in different cell populations or under different circumstances. Molecular mechanisms involved in the role of PDGF signaling in osteoblastic cells need to be further investigated.
So far, knowledge on the amount, location and relationship of different progenitor populations in BM is limited due to lack of unique markers for identification. In this study, we efficiently detected the biological characteristics of Nestin-expressing and Osterix-expressing osteoblastic cells by using genetic-driver/reporter mouse model. In the future, by combining the genetic-driver/reporter animal model with cell type specific proteins we will focus on more comprehensive analysis of the relationship of different progenitor populations and further investigate the interactions of microenvironment factors and the differentiation, proliferation and migration of osteoblastic cells.
Conclusion
Both Nestin and Osterix could be selected as useful markers for the osteoblastic cells since little difference of biological functions was observed between Nestin-expressing and Osterix-expressing osteoblastic cells. However, Osterix was a prior choice due to larger number of the latter than that of the former in distinct subpopulations of bone-forming cells.
Acknowledgements
We thank Jennifer Idsvoog for helping maintain our mouse colony. This work is supported in part by NIH grant R01 AI079087 (D.W.), by China Scholarship Council (<2014>3026) and by the National Natural Science Foundation of China (81130034).
Disclosure of conflict of interest
None.
Authors’ contribution
Xinlin Su contributed to research design, performed the research, analyzed the results and wrote the first draft of the manuscript. Mei Yu contributed to research design, and performed some important experiments. Guixing Qiu provided intellectual input and critically reviewed the study. Yongwei Zheng and Yuhong Chen performed some experiments. Renren Wen and Guoping Fu provided intellectual input and helped analyze the results. Wen Zhu, Jun Chen and Nan Wu provided intellectual input and critical reagents. Pei Ma and Weisheng Chen provided intellectual input. Zhihong Wu provided intellectual input, supervised the study and analyze the results. Demin Wang supervised the study, analyze the results and wrote the manuscript.
References
- 1.Nakashima K, Zhou X, Kunkel G, Zhang Z, Deng JM, Behringer RR, de Crombrugghe B. The novel zinc finger-containing transcription factor osterix is required for osteoblast differentiation and bone formation. Cell. 2002;108:17–29. doi: 10.1016/s0092-8674(01)00622-5. [DOI] [PubMed] [Google Scholar]
- 2.Chaudhuri O, Gu L, Klumpers D, Darnell M, Bencherif SA, Weaver JC, Huebsch N, Lee HP, Lippens E, Duda GN, Mooney DJ. Hydrogels with tunable stress relaxation regulate stem cell fate and activity. Nat Mater. 2015;15:326–34. doi: 10.1038/nmat4489. [DOI] [PMC free article] [PubMed] [Google Scholar]
- 3.Drager J, Harvey EJ, Barralet J. Hypoxia signalling manipulation for bone regeneration. Expert Rev Mol Med. 2015;17:e6. doi: 10.1017/erm.2015.4. [DOI] [PubMed] [Google Scholar]
- 4.Ng F, Boucher S, Koh S, Sastry KS, Chase L, Lakshmipathy U, Choong C, Yang Z, Vemuri MC, Rao MS, Tanavde V. PDGF, TGF-beta, and FGF signaling is important for differentiation and growth of mesenchymal stem cells (MSCs): transcriptional profiling can identify markers and signaling pathways important in differentiation of MSCs into adipogenic, chondrogenic, and osteogenic lineages. Blood. 2008;112:295–307. doi: 10.1182/blood-2007-07-103697. [DOI] [PubMed] [Google Scholar]
- 5.Tang Y, Wu X, Lei W, Pang L, Wan C, Shi Z, Zhao L, Nagy TR, Peng X, Hu J, Feng X, Van Hul W, Wan M, Cao X. TGF-beta1-induced migration of bone mesenchymal stem cells couples bone resorption with formation. Nat Med. 2009;15:757–765. doi: 10.1038/nm.1979. [DOI] [PMC free article] [PubMed] [Google Scholar]
- 6.Mendez-Ferrer S, Michurina TV, Ferraro F, Mazloom AR, Macarthur BD, Lira SA, Scadden DT, Ma’ayan A, Enikolopov GN, Frenette PS. Mesenchymal and haematopoietic stem cells form a unique bone marrow niche. Nature. 2010;466:829–834. doi: 10.1038/nature09262. [DOI] [PMC free article] [PubMed] [Google Scholar]
- 7.Nagasawa T. Microenvironmental niches in the bone marrow required for B-cell development. Nat Rev Immunol. 2006;6:107–116. doi: 10.1038/nri1780. [DOI] [PubMed] [Google Scholar]
- 8.Omatsu Y, Sugiyama T, Kohara H, Kondoh G, Fujii N, Kohno K, Nagasawa T. The essential functions of adipo-osteogenic progenitors as the hematopoietic stem and progenitor cell niche. Immunity. 2010;33:387–399. doi: 10.1016/j.immuni.2010.08.017. [DOI] [PubMed] [Google Scholar]
- 9.Sacchetti B, Funari A, Michienzi S, Di Cesare S, Piersanti S, Saggio I, Tagliafico E, Ferrari S, Robey PG, Riminucci M, Bianco P. Self-renewing osteoprogenitors in bone marrow sinusoids can organize a hematopoietic microenvironment. Cell. 2007;131:324–336. doi: 10.1016/j.cell.2007.08.025. [DOI] [PubMed] [Google Scholar]
- 10.Schepers K, Pietras EM, Reynaud D, Flach J, Binnewies M, Garg T, Wagers AJ, Hsiao EC, Passegue E. Myeloproliferative neoplasia remodels the endosteal bone marrow niche into a self-reinforcing leukemic niche. Cell Stem Cell. 2013;13:285–299. doi: 10.1016/j.stem.2013.06.009. [DOI] [PMC free article] [PubMed] [Google Scholar]
- 11.Wu JY, Purton LE, Rodda SJ, Chen M, Weinstein LS, McMahon AP, Scadden DT, Kronenberg HM. Osteoblastic regulation of B lymphopoiesis is mediated by Gs{alpha}-dependent signaling pathways. Proc Natl Acad Sci U S A. 2008;105:16976–16981. doi: 10.1073/pnas.0802898105. [DOI] [PMC free article] [PubMed] [Google Scholar]
- 12.Mendez-Ferrer S, Scadden DT, Sanchez-Aguilera A. Bone marrow stem cells: current and emerging concepts. Ann N Y Acad Sci. 2015;1335:32–44. doi: 10.1111/nyas.12641. [DOI] [PubMed] [Google Scholar]
- 13.Houlihan DD, Mabuchi Y, Morikawa S, Niibe K, Araki D, Suzuki S, Okano H, Matsuzaki Y. Isolation of mouse mesenchymal stem cells on the basis of expression of Sca-1 and PDGFRalpha. Nat Protoc. 2012;7:2103–2111. doi: 10.1038/nprot.2012.125. [DOI] [PubMed] [Google Scholar]
- 14.Li H, Ghazanfari R, Zacharaki D, Ditzel N, Isern J, Ekblom M, Mendez-Ferrer S, Kassem M, Scheding S. Low/negative expression of PDGFR-alpha identifies the candidate primary mesenchymal stromal cells in adult human bone marrow. Stem Cell Reports. 2014;3:965–974. doi: 10.1016/j.stemcr.2014.09.018. [DOI] [PMC free article] [PubMed] [Google Scholar]
- 15.Kawanami A, Matsushita T, Chan YY, Murakami S. Mice expressing GFP and CreER in osteochondro progenitor cells in the periosteum. Biochem Biophys Res Commun. 2009;386:477–482. doi: 10.1016/j.bbrc.2009.06.059. [DOI] [PMC free article] [PubMed] [Google Scholar]
- 16.Mizoguchi T, Pinho S, Ahmed J, Kunisaki Y, Hanoun M, Mendelson A, Ono N, Kronenberg HM, Frenette PS. Osterix marks distinct waves of primitive and definitive stromal progenitors during bone marrow development. Dev Cell. 2014;29:340–349. doi: 10.1016/j.devcel.2014.03.013. [DOI] [PMC free article] [PubMed] [Google Scholar]
- 17.Zhou BO, Yue R, Murphy MM, Peyer JG, Morrison SJ. Leptin-receptor-expressing mesenchymal stromal cells represent the main source of bone formed by adult bone marrow. Cell Stem Cell. 2014;15:154–168. doi: 10.1016/j.stem.2014.06.008. [DOI] [PMC free article] [PubMed] [Google Scholar]
- 18.Lendahl U, Zimmerman LB, McKay RD. CNS stem cells express a new class of intermediate filament protein. Cell. 1990;60:585–595. doi: 10.1016/0092-8674(90)90662-x. [DOI] [PubMed] [Google Scholar]
- 19.Wiese C, Rolletschek A, Kania G, Blyszczuk P, Tarasov KV, Tarasova Y, Wersto RP, Boheler KR, Wobus AM. Nestin expression--a property of multi-lineage progenitor cells? Cell Mol Life Sci. 2004;61:2510–2522. doi: 10.1007/s00018-004-4144-6. [DOI] [PubMed] [Google Scholar]
- 20.Zhou X, Zhang Z, Feng JQ, Dusevich VM, Sinha K, Zhang H, Darnay BG, de Crombrugghe B. Multiple functions of Osterix are required for bone growth and homeostasis in postnatal mice. Proc Natl Acad Sci U S A. 2010;107:12919–12924. doi: 10.1073/pnas.0912855107. [DOI] [PMC free article] [PubMed] [Google Scholar]
- 21.Chen J, Shi Y, Regan J, Karuppaiah K, Ornitz DM, Long F. Osx-Cre targets multiple cell types besides osteoblast lineage in postnatal mice. PLoS One. 2014;9:e85161. doi: 10.1371/journal.pone.0085161. [DOI] [PMC free article] [PubMed] [Google Scholar]
- 22.Liu Y, Strecker S, Wang L, Kronenberg MS, Wang W, Rowe DW, Maye P. Osterix-cre labeled progenitor cells contribute to the formation and maintenance of the bone marrow stroma. PLoS One. 2013;8:e71318. doi: 10.1371/journal.pone.0071318. [DOI] [PMC free article] [PubMed] [Google Scholar]
- 23.Soriano P. Generalized lacZ expression with the ROSA26 Cre reporter strain. Nat Genet. 1999;21:70–71. doi: 10.1038/5007. [DOI] [PubMed] [Google Scholar]
- 24.Srinivas S, Watanabe T, Lin CS, William CM, Tanabe Y, Jessell TM, Costantini F. Cre reporter strains produced by targeted insertion of EYFP and ECFP into the ROSA26 locus. BMC Dev Biol. 2001;1:4. doi: 10.1186/1471-213X-1-4. [DOI] [PMC free article] [PubMed] [Google Scholar]
- 25.Winkler IG, Barbier V, Wadley R, Zannettino AC, Williams S, Levesque JP. Positioning of bone marrow hematopoietic and stromal cells relative to blood flow in vivo: serially reconstituting hematopoietic stem cells reside in distinct nonperfused niches. Blood. 2010;116:375–385. doi: 10.1182/blood-2009-07-233437. [DOI] [PubMed] [Google Scholar]
- 26.Chen Q, Shou P, Zhang L, Xu C, Zheng C, Han Y, Li W, Huang Y, Zhang X, Shao C, Roberts AI, Rabson AB, Ren G, Zhang Y, Wang Y, Denhardt DT, Shi Y. An osteopontin-integrin interaction plays a critical role in directing adipogenesis and osteogenesis by mesenchymal stem cells. Stem Cells. 2014;32:327–337. doi: 10.1002/stem.1567. [DOI] [PMC free article] [PubMed] [Google Scholar]
- 27.Di Benedetto A, Brunetti G, Posa F, Ballini A, Grassi FR, Colaianni G, Colucci S, Rossi E, Cavalcanti-Adam EA, Lo Muzio L, Grano M, Mori G. Osteogenic differentiation of mesenchymal stem cells from dental bud: Role of integrins and cadherins. Stem Cell Res. 2015;15:618–628. doi: 10.1016/j.scr.2015.09.011. [DOI] [PubMed] [Google Scholar]
- 28.Kaneko K, Ito M, Naoe Y, Lacy-Hulbert A, Ikeda K. Integrin alphav in the mechanical response of osteoblast lineage cells. Biochem Biophys Res Commun. 2014;447:352–357. doi: 10.1016/j.bbrc.2014.04.006. [DOI] [PMC free article] [PubMed] [Google Scholar]
- 29.Chan CK, Seo EY, Chen JY, Lo D, McArdle A, Sinha R, Tevlin R, Seita J, Vincent-Tompkins J, Wearda T, Lu WJ, Senarath-Yapa K, Chung MT, Marecic O, Tran M, Yan KS, Upton R, Walmsley GG, Lee AS, Sahoo D, Kuo CJ, Weissman IL, Longaker MT. Identification and specification of the mouse skeletal stem cell. Cell. 2015;160:285–298. doi: 10.1016/j.cell.2014.12.002. [DOI] [PMC free article] [PubMed] [Google Scholar]
- 30.Xie L, Zeng X, Hu J, Chen Q. Characterization of Nestin, a Selective Marker for Bone Marrow Derived Mesenchymal Stem Cells. Stem Cells Int. 2015;2015:762098. doi: 10.1155/2015/762098. [DOI] [PMC free article] [PubMed] [Google Scholar]
- 31.Calvi LM, Adams GB, Weibrecht KW, Weber JM, Olson DP, Knight MC, Martin RP, Schipani E, Divieti P, Bringhurst FR, Milner LA, Kronenberg HM, Scadden DT. Osteoblastic cells regulate the haematopoietic stem cell niche. Nature. 2003;425:841–846. doi: 10.1038/nature02040. [DOI] [PubMed] [Google Scholar]
- 32.Wong A, Ghassemi E, Yellowley CE. Nestin expression in mesenchymal stromal cells: regulation by hypoxia and osteogenesis. BMC Vet Res. 2014;10:173. doi: 10.1186/s12917-014-0173-z. [DOI] [PMC free article] [PubMed] [Google Scholar]
- 33.Ono N, Ono W, Mizoguchi T, Nagasawa T, Frenette PS, Kronenberg HM. Vasculature-associated cells expressing nestin in developing bones encompass early cells in the osteoblast and endothelial lineage. Dev Cell. 2014;29:330–339. doi: 10.1016/j.devcel.2014.03.014. [DOI] [PMC free article] [PubMed] [Google Scholar]
- 34.Pinho S, Lacombe J, Hanoun M, Mizoguchi T, Bruns I, Kunisaki Y, Frenette PS. PDGFRalpha and CD51 mark human nestin+ sphereforming mesenchymal stem cells capable of hematopoietic progenitor cell expansion. J Exp Med. 2013;210:1351–1367. doi: 10.1084/jem.20122252. [DOI] [PMC free article] [PubMed] [Google Scholar]
- 35.Bornfeldt KE, Raines EW, Graves LM, Skinner MP, Krebs EG, Ross R. Platelet-derived growth factor. Distinct signal transduction pathways associated with migration versus proliferation. Ann N Y Acad Sci. 1995;766:416–430. doi: 10.1111/j.1749-6632.1995.tb26691.x. [DOI] [PubMed] [Google Scholar]
- 36.Kim SJ, Kim SY, Kwon CH, Kim YK. Differential effect of FGF and PDGF on cell proliferation and migration in osteoblastic cells. Growth Factors. 2007;25:77–86. doi: 10.1080/08977190701398977. [DOI] [PubMed] [Google Scholar]
- 37.Xie H, Cui Z, Wang L, Xia Z, Hu Y, Xian L, Li C, Xie L, Crane J, Wan M, Zhen G, Bian Q, Yu B, Chang W, Qiu T, Pickarski M, Duong le T, Windle JJ, Luo X, Liao E, Cao X. PDGF-BB secreted by preosteoclasts induces angiogenesis during coupling with osteogenesis. Nat Med. 2014;20:1270–1278. doi: 10.1038/nm.3668. [DOI] [PMC free article] [PubMed] [Google Scholar]