

ABSTRACT
Foot-and-mouth disease (FMD) virus (FMDV) circulates as multiple serotypes and strains in many regions of endemicity. In particular, the three Southern African Territories (SAT) serotypes are maintained effectively in their wildlife reservoir, the African buffalo, and individuals may harbor multiple SAT serotypes for extended periods in the pharyngeal region. However, the exact site and mechanism for persistence remain unclear. FMD in buffaloes offers a unique opportunity to study FMDV persistence, as transmission from carrier ruminants has convincingly been demonstrated for only this species. Following coinfection of naive African buffaloes with isolates of three SAT serotypes from field buffaloes, palatine tonsil swabs were the sample of choice for recovering infectious FMDV up to 400 days postinfection (dpi). Postmortem examination identified infectious virus for up to 185 dpi and viral genomes for up to 400 dpi in lymphoid tissues of the head and neck, focused mainly in germinal centers. Interestingly, viral persistence in vivo was not homogenous, and the SAT-1 isolate persisted longer than the SAT-2 and SAT-3 isolates. Coinfection and passage of these SAT isolates in goat and buffalo cell lines demonstrated a direct correlation between persistence and cell-killing capacity. These data suggest that FMDV persistence occurs in the germinal centers of lymphoid tissue but that the duration of persistence is related to virus replication and cell-killing capacity.
IMPORTANCE Foot-and-mouth disease virus (FMDV) causes a highly contagious acute vesicular disease in domestic livestock and wildlife species. African buffaloes (Syncerus caffer) are the primary carrier hosts of FMDV in African savannah ecosystems, where the disease is endemic. We have shown that the virus persists for up to 400 days in buffaloes and that there is competition between viruses during mixed infections. There was similar competition in cell culture: viruses that killed cells quickly persisted more efficiently in passaged cell cultures. These results may provide a mechanism for the dominance of particular viruses in an ecosystem.
INTRODUCTION
The picornavirus foot-and-mouth disease (FMD) virus (FMDV) continues to be a major burden for livestock owners in countries where the disease is endemic (1). Controlling transboundary diseases such as FMD at the source is therefore a shared interest between countries where the disease is endemic and disease-free countries (2). FMD in sub-Saharan Africa is unique: not only are the Southern African Territories (SAT) serotypes almost exclusively endemic, they are also maintained in wildlife (3). Therefore, FMD control in livestock is dependent in part on an understanding of the pathogenesis in and transmission from African buffaloes. SAT serotypes differ from each other with respect to their incidence. SAT-2 is the most widely distributed serotype and is also the serotype most often associated with outbreaks in livestock and wildlife, followed by SAT-1 and then SAT-3 (4–6). However, SAT-1 is the serotype most frequently isolated from buffaloes (Nick Knowles, personal communication). Isolates of different SAT serotypes are known to exist as mixed infections, with isolates of all three serotypes being detected on occasion from buffalo esophageal-pharyngeal fluid (OPF); similarly, there are field examples of mixed infections of type O and Asia-1 viruses in cattle (7, 8). It is unclear why certain FMDV serotypes exist in discrete geographical regions, while other serotypes, for example, type O, have a more global distribution (9). The geography of isolated host populations certainly plays a role; however, it is unclear whether viral competition or interference plays a role in virus distribution.
In Kruger National Park (KNP), the SAT serotypes are highly prevalent, and >98% of buffaloes develop antibodies to all three serotypes by the age of 2 years (10, 11). After the acute period of infection, FMDV can be recovered from OPF with a prevalence ranging from 40 to 60%, although virus recovery from OPF is intermittent and unreliable (7, 11, 12). This “carrier state” is considered unique to ruminants and is defined as the period after 28 days postinfection (dpi) in which infectious FMDV may be detected in OPF (13). The carrier state has been reported to last for up to 5 years in buffaloes, but the proportions of carriers under field and experimental conditions decline after 3 years of age (11, 14). The carrier state is controversial, and to date, there are no unequivocal reports of transmission from persistently infected domestic livestock. In contrast, transmission from carrier buffaloes to cattle has been demonstrated (15, 16). Nevertheless, the conditions for transmission from carrier buffaloes are not well understood and are difficult to replicate. In fact, most attempts to effect transmission from carrier buffaloes have failed, even under conditions of immunosuppression or viral coinfection (11, 12, 14, 17–19). In addition, the mechanism of persistence remains unclear, and the sites for persistence in buffaloes have not been identified. In carrier cattle, virus replication has been detected within the pharyngeal epithelium, and it has been proposed that FMDV persists through sustained low-level replication (20, 21). Virus particles have also been detected in lymphoid tissue germinal centers (GCs) in ruminants (22, 23). Although virus replication has not been demonstrated, GCs have been proposed to be a virus reservoir with the potential for immune-complexed virus to infect lymphoid cells that migrate through GCs to the peripheral epithelium.
Here we describe the dynamics of three SAT serotypes during coinfection in buffaloes: infectious FMDV and RNA were readily detected after acute infection, mainly in palatine tonsil swabs. However, detection occurred significantly less frequently over time. These data provide support for field observations that FMDV is cleared from buffaloes. Importantly, there were significant variations in the quantities of viral RNA detected for the different serotypes. Using FMD challenge viruses, we explored the correlation between killing capacity and viral dynamics in cell cultures of mixed infections. Here we demonstrated differential survival of SAT isolates during multiple passages in cell culture.
MATERIALS AND METHODS
Viruses.
The SAT viruses were isolated from buffaloes in KNP in primary pig kidney (PK) cells (1 passage) and propagated in IB-RS-2 cells (RS cells) (4 or 5 passages) to prepare challenge viruses KNP/196/91/1 PK1 RS5, KNP/19/89/2 PK1 RS4, and KNP/1/08/3 PK1 RS4 (4, 24).
In vivo experiments.
Challenge virus pathogenicity was confirmed in two Nguni cattle; each animal received 1 × 10⁴ 50% tissue culture infective doses (TCID50) of each serotype intradermolingually in three distinct sites, one site per serotype.
Nine female and seven male African buffaloes from FMDV-free herds were donated by Ezemvelo KZN Wildlife (25) and confirmed to be free of FMDV SAT antibodies by the OIE Regional Reference Laboratory. Buffaloes were then transferred to Skukuza, KNP, and housed in four experimental pens with four buffaloes each. Buffaloes were also coinfected with 6 × 10⁵ TCID50 of each serotype by intradermolingual challenge. Buffaloes were immobilized with etorphine hydrochloride and xylazine for challenge, veterinary examination, and sample collection (blood, OPF, and palatine tonsil swabs). OPF was diluted in 3 ml probang buffer and snap-frozen (26). Buffaloes were culled in groups of four at 35, 95, 185, and 400 dpi. Tissues were stored in RNAlater (Life Technologies) or snap-frozen in a 50% glycerol–phosphate-buffered saline (PBS) solution or OCT (Tissue-Tek). Tissues collected previously from three buffaloes, screened as negative for FMDV RNA by universal reverse transcription-quantitative PCR (qRT-PCR), served as controls.
Four FMDV antibody-free Drakensberger heifers were maintained in direct contact with buffaloes from day 35 postinfection on, sharing hay racks and water troughs in two pens. From days 35 to 95 postinfection, two heifers were placed into each pen containing six buffaloes each. From days 96 to 185 postinfection, each pen contained two heifers and four buffaloes. From days 186 to 400 postinfection, the four heifers and four remaining buffaloes were maintained in a single pen. Blood and OPF were collected from cattle at least monthly, coinciding with veterinary examinations. All experimental procedures with animals were approved by the ARC-Onderstepoort Veterinary Institute (ARC-OVI) Animal Ethics Committee (project number KNP-BC-02) according to national animal welfare standards and performed with the permission of the Department of Agriculture, Forestry and Fisheries (DAFF) (section 20 permit number 12/11/1/1a).
Palatine tonsil swabs.
The tonsil sinuses were swabbed individually by using nylon brushes (Cytotak Transwab) (27). Laryngoscopes used to depress the tongue were disinfected in citric acid and rinsed in PBS. Nylon brushes were transferred to 0.5 ml probang buffer and snap-frozen. At processing, cryotubes containing the brushes were vortexed and centrifuged for 5 min at 3,000 × g. The brushes were then removed, and the pellet was resuspended in the remaining sample before qRT-PCR or virus isolation (VI) was performed.
Physiological stress.
At 156 and 163 dpi, four of the buffaloes in one pen (in direct contact with two cattle) were treated with 4 mg Synacthen Depot (∼1.3 IU adrenocorticotropic hormone per kg of body weight; Novartis). The four buffaloes in the second pen, in contact with two cattle, served as controls. EDTA-treated blood was collected pretreatment and at 45 min posttreatment to determine cortisol levels (Coat-A-Count Cortisol radioimmunoassay; Siemens Medical Solutions Diagnostics) (28).
Laser capture microdissection, RNA extraction, and qRT-PCR.
Laser capture microdissection (LMD) was performed as described previously (22). Multiple GC, epithelium, or crypt epithelium samples were measured and then dissected (LMD7000 system; Leica). RNA was extracted from 1 mm2 of the dissected tissue sample by using RNeasy microkits (Qiagen) and processed by qRT-PCR.
RNA was extracted from OPF and tonsil swabs by using TRIzol and was extracted from plasma and VI-positive cell culture supernatants by using MagNA Pure LC total nucleic acid isolation kits (Roche). RNA was extracted from RNAlater-preserved tissues by using MagNA Pure LC RNA isolation kit III. cDNA was synthesized with random hexamers and TaqMan RT reagents (Applied Biosystems).
The pan-SAT PCR targeted 1D by using the WDA and VP1-AB primer set (29, 30). Challenge virus 1D/2A regions were targeted to generate RNA standards for serotype-specific qRT-PCR using primers as described previously (31). The serotype-specific 1D primer/probe combinations did not cross-react with 1 × 10¹² disparate RNA copies/μl and were able to detect 1 RNA copy/μl. The panreactive 3D qRT-PCR assay was used for validation (32). TaqMan universal PCR master mix (Applied Biosystems) was used for quantitative PCRs (qPCRs) on the MX3005P QPCR system (Stratagene). Numbers of copies per microliter were calculated by using the standard-curve method and MxPro software, and samples with no fluorescence above the threshold level after 50 cycles were considered negative (31). 28S was used as a housekeeping gene for LMD and was detected by using the 28S primers/probe and RNA standards for buffalo 28S, adapted from methods described previously (22). For RNAlater-treated tissues, input RNA was normalized to 50 ng/μl (NanoDrop 8000; Thermo Scientific) and expressed as FMDV copy numbers per microgram of total RNA.
Virus isolation.
Virus was isolated from OPF and tonsil swabs in RS cells and from tissue samples in ZZ-R 127 cells as described previously (33, 34). Samples with no cell death after 3 passages were considered negative. Culture supernatants were analyzed by serotype-specific qRT-PCR.
Assays for FMDV-specific antibodies.
Antibody responses were assessed by a liquid-phase blocking enzyme-linked immunosorbent assay (ELISA) (LPBE) (35) and a virus neutralization test (VNT) (13).
Interferon assay.
A human MxA promoter driving a chloramphenicol acetyltransferase (CAT) cDNA (Mx-CAT) reporter assay was used to determine the levels of biologically active type I interferon (IFN) in serum samples, as described previously (36).
Leukocyte count.
Total EDTA-treated whole-blood leukocyte counts were analyzed on a T-890 instrument (Beckman Coulter).
Cell killing assay and buffalo kidney cell line.
The capacity of FMDV to kill ZZ-R127 and buffalo kidney (BK) cells was determined by adapting a previously described method (37). The primary BK cell line was established from a Hluhluwe-iMfolozi Park buffalo. The killing assay was performed in 96-well plates seeded with 104 cells. Eight hours later, the cells were infected with serial dilutions of challenge virus previously plaque titrated in the specific cell line (38). Isolates of all three serotypes were evaluated on the same plate, and noninfected rows were included as controls. Cells were stained with methylene blue at different times postinfection. Complete killing was confirmed by microscopy, and results of triplicate experiments were expressed as the mean number of PFU for killing as a function of time.
In vitro coinfection assays.
T25 flasks containing ZZ-R 127 or BK cells were coinfected with all three challenge viruses, each at a multiplicity of infection (MOI) of 2. Coinfections with SAT-1 at an MOI of 1 and SAT-2 and SAT-3 at an MOI of 2 or coinfections of SAT-1 at an MOI of 0.5 and SAT-2 and SAT-3 at an MOI of 2 were run in parallel. Single infections at an MOI of 2 and noninfected flasks served as controls. Complete cell death was observed in 24 h in all cases; 5 μl of the supernatant was passaged into a fresh flask, and cultures were maintained up to passage 10. Supernatants from each passage were analyzed by serotype-specific qRT-PCR. Results of triplicate experiments were expressed as the number of serotype-specific FMDV copies per milliliter of cell culture supernatant.
Statistical analysis.
The probability of detecting infectious FMDV or viral RNA in OPF or tonsil swabs was analyzed by using a generalized linear mixed model with binomial errors and a logit link function. The probability of detecting FMDV in tissues and FMDV RNA in LMD samples was analyzed by using generalized linear models with binomial errors and a logit link function. Killing assays and coinfection in cell culture were analyzed by using linear models, with the data for each cell type/virus being analyzed independently. For VNT titers, a linear mixed model was used. All analyses were implemented in R version 3.1.0 (39), using the packages nlme (40), MASS (41), and multcomp (42).
RESULTS
Acute response to coinfection with multiple FMDVs.
FMDV-challenged Nguni cattle developed extensive lesions on the tongue, buccal cavity, and feet. In contrast, lesions in buffaloes did not extend beyond the trauma caused by needle inoculation despite receiving 60-fold more virus. Buffaloes were hypersalivating, and nasal discharges were observed at 1 dpi.
Despite the absence of vesicles, all buffaloes had detectable viral RNA of all three serotypes by qRT-PCR (data not shown). SAT-1, SAT-2, and SAT-3 RNAs were detected over at least 1 to 7, 3 to 5, and 1 to 3 days, respectively. FMDV challenge stimulated an IFN response, although peak serum IFN titers in buffaloes were highly variable (peak titers from 3 to 97 IU/ml). Circulating IFN (>1 IU/ml) lasted at least 5 days in the majority of buffaloes and up to 6 days in challenged cattle (n = 2; peak titers of 21.6 and 26.6 IU/ml, respectively). Similar to data reported previously for cattle (43), FMDV-challenged buffaloes did not develop leucopenia during acute infection (data not shown).
All 16 buffaloes seroconverted to all serotypes with VNT titers of ≥45 from days 6 to 11 postinfection. High titers were maintained until study termination, except for buffalo 60, whose titer for SAT-3 was <45 after 8 dpi; SAT-3 titers were not significantly different between day 35 and later time points for all other animals. Surprisingly, after 35 dpi, SAT-1 and SAT-2 titers continued to increase (P < 0.05) (data not shown).
Persistence of FMDV occurs in germinal centers of lymphoid tissue in buffaloes.
Viral RNA was detected from days 29 to 35 postinfection in OPF or palatine tonsil swabs in all buffaloes by pan-SAT diagnostic PCR. In order to compare persistence between serotypes, samples from 8 buffaloes at between 35 and 185 dpi and from 4 buffaloes at up to 400 dpi were analyzed by serotype-specific qRT-PCR (Fig. 1) and VI (Fig. 2). The proportion of FMDV RNA-positive samples decreased over time and at rates that differed significantly among serotypes: samples at later time points were more likely to be positive for SAT-1 (P < 0.001) (Fig. 1). No SAT-2 RNA was detectable after 172 dpi, and no SAT-3 RNA was detected after 214 dpi; in contrast, SAT-1 RNA was still detectable at 400 dpi (Fig. 1). Significantly more SAT-1 RNA copies per milliliter were detected in swabs than in OPF at 35 dpi (P < 0.001) and 80 dpi (P = 0.001) (data not shown), but there were no significant differences in copy numbers between sample types at later time points.
FIG 1.
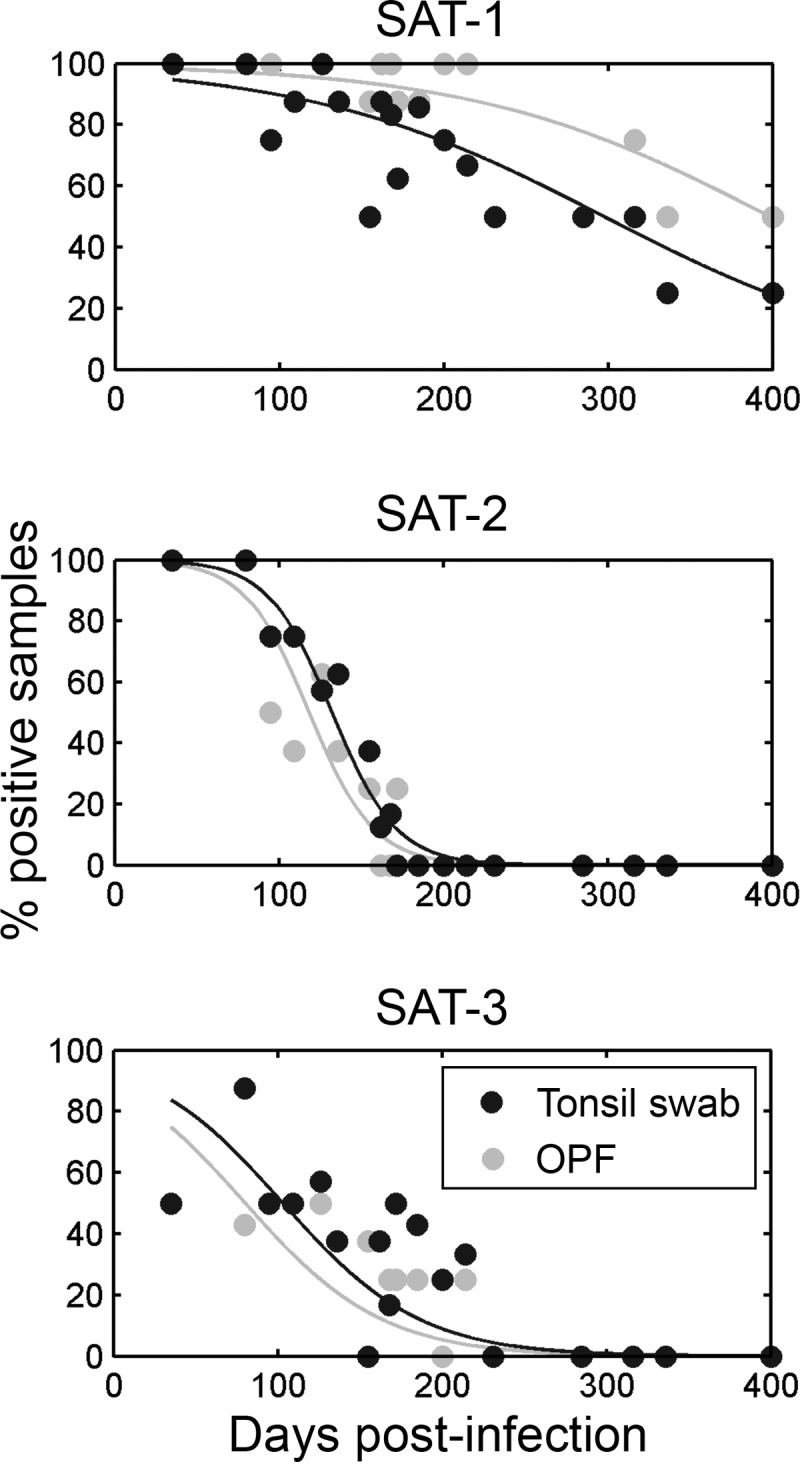
Summary plots of qRT-PCR data from buffalo palatine tonsil swabs and OPF. The lines represent the estimated probability of a positive result, and the proportion of positive samples decreased over time at rates that differed significantly between serotypes (P < 0.001).
FIG 2.

(a and b) VI from buffalo tonsil swabs (a) and OPF (b). Significantly more tonsil swabs than OPF samples were positive by VI (P < 0.001). Significantly more SAT-1 than SAT-2 or SAT-3 was isolated (P < 0.001). (c) VI from buffalo tissues. RPLN, retropharyngeal lymph node; MLN, mandibular lymph node; DSP, dorsal soft palate. Only 1 sample was positive at 185 dpi, and no tissues were positive at 400 dpi. Significantly more SAT-1 than SAT-2 and SAT-3 was isolated (P < 0.001).
Significantly more swabs than OPF samples were positive for infectious virus (P < 0.001) (Fig. 2a and b), and similarly to RNA detection, the proportion of positive samples declined significantly over time (P < 0.001) (Fig. 2a and b). Supernatants from VI-positive cultures of tissue samples were screened by serotype-specific qRT-PCR, and significantly more SAT-1 RNA was isolated than SAT-2 and SAT-3 RNAs (P < 0.001) (Fig. 2c).
Specifically, buffalo retropharyngeal lymph node, mandibular lymph node, lingual tonsil, pharyngeal tonsil, dorsal soft palate (DSP), and palatine tonsil tissue samples were screened for infectious virus, and VI-positive cultures were assayed by serotype-specific qRT-PCR (Fig. 3a). Virus was readily isolated from tissue samples at 35 and 95 dpi. However, only one tissue sample was VI positive at 185 dpi (pharyngeal tonsil; SAT-1), and no tissues were VI positive at 400 dpi. The frequency of SAT-1 detection was higher than that of SAT-2 and SAT-3 detection (P < 0.001), and there were no differences between tissue types. In order to compare viral RNA persistence, whole-tissue and laser-microdissected GC or epithelium samples were analyzed by serotype-specific qRT-PCR (Fig. 3). SAT-1 and SAT-2 RNAs were readily detected in oropharyngeal tissue samples at 35 and 95 dpi, but only two samples were positive for SAT-3 RNA. SAT-2 RNA was not readily detected at 185 and 400 dpi, whereas SAT-1 RNA was detected but was essentially limited at 400 dpi to palatine, pharyngeal tonsil, and DSP samples. These tissues were therefore targeted for LMD at 35, 95, 185, and 400 dpi (Fig. 3). There was no difference between tissue types in the probability of detecting viral RNA; however, detection of all serotypes by LMD decreased over time (P < 0.001), suggesting that the virus, irrespective of the serotype, was cleared from tissues. The detections of different serotypes by LMD were compared, and more samples were positive for SAT-1 RNA than for SAT-2 or SAT-3 RNA (P < 0.05). Detection of FMDV in GCs was compared to that in epithelium samples; significantly more GCs than epithelium samples were positive for SAT-1 (P < 0.03). Similarly, more GCs than epithelium samples were positive for SAT-2 (P < 0.007); there was no difference for SAT-3.
FIG 3.

FMDV RNA persistence in buffalo tissues. (a) Tissues were analyzed by serotype-specific qRT-PCR (n = 4) (lines represent the mean). One mandibular lymph node was not collected at 35 and 400 dpi. Spleen samples were excluded after 35 dpi. SAT-3 RNA was not readily detected and SAT-2 RNA was infrequently detected after 95 dpi. SAT-1 RNA was detectable up to 400 dpi but was essentially limited to palatine tonsil, pharyngeal tonsil, and DSP samples. (b) Laser-microdissected GC and epithelium samples from the palatine tonsil, pharyngeal tonsil, or DSP were analyzed by serotype-specific qRT-PCR (four buffaloes at each time point; one pharyngeal tonsil was not collected at 400 dpi). There was no difference between tissue types in the probability of detecting viral RNA; however, detection decreased over time for all three serotypes (P < 0.001). Samples were more likely to be positive for SAT-1 RNA than for SAT-2 or SAT-3 RNA (P < 0.05). There were significantly more SAT-1-positive GC samples than epithelium samples (P < 0.03); furthermore, there were more SAT-2-positive GC samples than epithelium samples (P < 0.007).
Transmission of FMDV during the persistent infection stage in buffaloes.
Despite direct contact for 365 days, four Drakensberger heifers did not seroconvert (VNT and liquid-phase blocking ELISA), even though virus was readily isolated from buffaloes throughout this period. At 156 and 163 dpi, four buffaloes (buffaloes X1, X2, X3, and 26) in contact with two heifers were treated with an adrenocorticotrophic hormone analogue in order to replicate a stress response (plasma cortisol levels of 13.7 to 49.8 and 38.6 to 73.1 nmol/liter pretreatment and 189.6 to 243.7 and 181.3 to 270.4 nmol/liter posttreatment). Treatment did not result in FMDV transmission.
Correlation between killing capacity and viral dynamics of the three challenge viruses in cultured cells.
Since SAT-1 dominated coinfection in vivo, we investigated whether viral factors play a role in persistence in vitro. For this purpose, coinfection and killing assays were undertaken in ZZ-R 127 cells, which express αvβ6, αvβ3, and β1 integrins, and in BK cells, which express αvβ3 and β1 integrins (data not shown). Persistence during coinfection was broadly reflected by virulence, as assessed by cell-killing capacity (Fig. 4). The SAT-1 challenge virus possessed the greatest capacity to kill ZZ-R 127 cells (P < 0.001) and outcompeted SAT-2 and SAT-3 during coinfection (Fig. 4c). Following coinfection with SAT-2 and SAT-3, each at an MOI of 2, and SAT-1, at an MOI of either 2 or 1, competition influenced viral dynamics to such an extent that SAT-2 RNA was undetectable by qRT-PCR by passage 7 and SAT-3 was undetectable by passage 10 (data not shown). A similar correlation between viral fitness during coinfection and BK cell-killing capacity was observed (Fig. 4d). Although SAT-3 was able to infect BK cells, RNA copy numbers were low compared to those for ZZ-R 127 cell infection and compared to the copy numbers achieved by SAT-1 and SAT-2. The decreased viral fitness of SAT-3 on BK cells was reflected by viral RNA extinction by passage 3 following coinfection with SAT-2 at an MOI of 2 and SAT-1 at an MOI of 2, 1, or 0.5 (data not shown).
FIG 4.

Virulence and fitness in vitro. (a and b) Killing assays. Each value represents the mean PFU with the standard deviation from triplicate assays for the time needed to kill 104 cells. (a) Challenge virus killing assays on ZZ-R 127 cells. SAT-1 killed cells more rapidly than did SAT-2 and SAT-3 (P < 0.001). (b) Challenge virus killing assays on BK cells. SAT-1 and SAT-2 killed cells more rapidly than did SAT-3 (P < 0.001). (c and d) Viral fitness assessed during coinfection assays. Results are expressed as the number of RNA copies per milliliter from triplicate experiments, and lines represent the mean. (c) ZZ-R 127 cells were coinfected with challenge viruses. SAT-1 (MOI = 0.5) outcompeted SAT-2 and SAT-3 at an MOI of 2. (d) BK cells coinfected with challenge viruses. SAT-1 (MOI = 0.5) and SAT-2 (MOI = 2) outcompeted SAT-3 (MOI = 2). (e and f) Numbers of FMDV copies per milliliter in cell culture supernatants harvested from ZZ-R 127 (e) or BK (f) cells after single infection with the challenge virus at an MOI of 2.
DISCUSSION
Here we demonstrated that African buffaloes are resistant to clinical FMD; however, buffaloes were viremic for up to 7 days, and infection induced IFN and rapid neutralizing antibody responses. The incidence of clinical FMD in African buffaloes is low, and it is accepted that, unlike cattle, most naturally infected buffaloes do not develop obvious clinical signs (10, 17). There are unequivocal cases of extensive vesicles and debilitating FMD in buffalo (44, 45). The reasons for these discrepancies in disease severity are unclear, and the occurrence of vesicles may depend on the interplay between virus, host, and environmental factors. Considering the association between clinical signs of disease and infectiousness (34, 46) and our failed attempts to effect transmission from carrier buffaloes, an understanding of why FMD is occasionally severe in buffalo and whether this results in transmission is an important area of investigation.
Despite mild disease, FMDV was isolated from 15 of the 16 buffaloes after 34 dpi. Palatine tonsil swabs were the sample of choice for recovering infectious virus. However, FMDV isolation and RNA detection were irregular in both tonsil swabs and OPF, with samples intermittently being positive for the different serotypes. There is a need for improved methods to assess the spectrum of FMDV circulating in livestock and wildlife for vaccine selection, especially when considering the challenging sampling logistics. Due to the relative ease of isolating virus from tonsil swabs compared to traditional sampling techniques, we have demonstrated that improvements are possible; however, further refinement is required to overcome intermittent recovery. Over 50% of ruminants and ∼60% of African buffaloes exposed to FMDV reportedly become carriers (7, 12, 47, 48). Our data suggest that these figures may be substantially higher using refined sampling techniques, and delayed viral clearance may be normal.
FMDV was readily isolated from buffalo lymphoid and oropharyngeal tissues at 35 and 95 dpi, with 23 of the 48 tissues being positive. We incorrectly anticipated that high neutralizing antibody titers at these time points would hinder recovery (49). Similarly, FMDV has successfully been isolated from lymphoid tissues from carrier sheep and cattle (50, 51). Our results, and previously reported data for competent carrier species, are contrary to thorough VI data reported for pigs: no virus could be isolated from 1,140 tissue samples harvested at 28 to 100 dpi despite viral RNA and capsid protein persisting in lymphoid tissue GCs (52). Viral RNA and protein localization after the resolution of viremia in cattle has also been described; similar to the swine data, FMDV RNA and capsid protein were restricted to GCs in animals with negative OPF, and no signal was detected in the epithelium (22). FMDV nonstructural proteins were not detectable in lymphoid or oropharyngeal tissue in pigs and noncarrier cattle (22, 52). In contrast, during FMDV persistence in cattle, cells containing nonstructural proteins have been detected in pharyngeal tissue within the epithelium and subjacent lymphoid tissue (21).
FMDV RNA persisted in buffalo lymphoid and oropharyngeal tissues, with significantly more GC samples than epithelium samples being positive for SAT-1 and SAT-2. Interestingly, FMDV RNA detection decreased over time for all three serotypes in LMD samples, consistent with the clearance of virus and RNA from tonsil swab samples, OPF, and tissue over time. The VI data for tissues was most striking, with only a single tissue, a pharyngeal tonsil, being positive for infectious virus at 185 dpi and no samples being positive at 400 dpi. Therefore, there is a progressive reduction in virus titers over time, consistent with a delayed clearance despite the induction of high titers of neutralizing antibodies soon after initial infection and antibody titers increasing significantly after 35 dpi, probably due to constant antigenic boost. Similarly, Stenfeldt et al. (52) reported declines in FMDV RNA and antigen levels in porcine tissue over time, with clearance being reported by 100 dpi, and in addition, viral RNA was cleared from OPF and tonsil swab samples. The retention of virus on follicular dendritic cells (FDCs) may play a key role in the delayed clearance in vivo. Our data, in addition to data from reported previously for cattle, sheep, and pigs, may represent a juncture in understanding FMDV persistence (22, 23, 52). Clearly, trapping of viral protein and RNA within lymphoid tissue follicles is a common sequel to infection, even in species, such as pigs, in which the carrier state has not been described. In addition, it is unclear how virus in lymph node tissue remains infectious despite the presence of neutralizing antibody. Recently, a pathway was described whereby FDCs protect antigen by recycling complement receptor 2-bound complement C3d-coated immune complexes (ICs) in nondegradative endosomal compartments for months (53, 54). This pathway enables FDCs to protect and present antigen in its native form. Furthermore, the context of FMDV pathogenesis, specifically the structure of FMDV antibody/complement ICs in different species and the ability of immune cells from different species to support productive replication following the uptake of FMDV ICs (55), warrants further investigation.
Data from buffalo SAT coinfections demonstrated that viral factors play a role in persistence: SAT-1 dominated chronic FMD in buffaloes. SAT-1 dominance in vivo was broadly reflected by in vitro killing (virulence) and coinfection (fitness) assays in goat and buffalo cell lines. Competition between serotypes was significant, and under certain conditions, SAT-2 and SAT-3 challenge viruses were undetectable at later passages by qRT-PCR. Serial cell passage of mixed type O and Asia 1 infection was reported previously, with virus ratios up to passage 10 calculated by using an antigen ELISA (56). Virus extinction was not reported, and the two serotypes were shown to cycle equally through time. Interestingly, mixed infection with type O and Asia 1 in cattle has been described, with both viruses coexisting for an extended period of time (8). Therefore, coinfections with different FMDV serotypes may have distinct consequences.
When reviewing the literature, clarity on terminology is required to draw conclusions between studies. The capacity of viruses to kill cells in vitro may be termed virulence. However, virulence in vivo may or may not be related to cell-killing capacity in vitro. Using buffalo-derived viruses, we demonstrated a correlation in vitro between viral fitness and cell-killing capacity. Based on these data, one could propose that during acute infection, tissue reservoirs are established before infection is controlled by the host's immune response, most probably in GCs. Also, the presence of live virus in tissue samples after acute infection suggests that there is ongoing virus replication. If there is a limited population of cells available in vivo to sustain virus replication, then viruses that replicate and kill these cells quickly will persist more readily. This could explain the results of the buffalo coinfection studies here and why SAT-1 clearance was delayed compared to SAT-2 and SAT-3 clearance.
The relationship between FMDV fitness and cell killing (described as virulence) has been explored previously in vitro, with conflicting results. Increased virulence and fitness have been reported for FMDV following passage in BHK-21 cells (37), and a correlation between virulence and fitness has been demonstrated in vivo for a number of other virus-host systems (57, 58). Herrera et al. (37) described the behavior of an FMDV clone with a history of serial plaque transfer in BHK-21 cells, which also deviated from the correlation between viral fitness and virulence. During passage, the clone attained a very low fitness value relative to that of the parental virus, yet its virulence for BHK-21 cells was significantly higher than that of the reference virus. Although buffaloes were challenged with isolates of the SAT serotypes at distinct sites, it is possible that viral competition or interference played a role in persistence. FMDV has been used as a model system in vitro to study competition-colonization dynamics of RNA viruses (59–61). In cell cultures coinfected with colonizers (highly virulent FMDV clones) and competitors (less-virulent clones), the colonizers were outcompeted by the competitors, which led to attenuation of the viral population. Our in vivo studies of FMDV in a natural host clearly demonstrated differential survival of viruses after mixed infection, a similar pattern of virus dominance was observed in vitro, and the viruses that killed cells most quickly outcompeted other viruses.
ACKNOWLEDGMENTS
We are indebted to Dave Cooper and Ezemvelo KZN Wildlife for donating the African buffaloes. We thank Ferran Jori and Andre Ganswindt for assistance with physiological stress experiments. We thank Nick Knowles for advice on contents.
N.J. was funded as a Wellcome Trust Intermediate Clinical Fellow, and we acknowledge funding from the Biotechnology and Biological Sciences Research Council (BBS/E/I/00001523 and BBS/E/I/00001717). B.C. is a Jenner Investigator.
None of the authors of this paper has a financial or personal relationship with other people or organizations that could inappropriately influence or bias the content of the paper.
REFERENCES
- 1.Jemberu WT, Mourits MC, Woldehanna T, Hogeveen H. 2014. Economic impact of foot and mouth disease outbreaks on smallholder farmers in Ethiopia. Prev Vet Med 116:26–36. doi: 10.1016/j.prevetmed.2014.06.004. [DOI] [PubMed] [Google Scholar]
- 2.FAO/OIE. 2012. The global foot and mouth disease control strategy: strengthening animal health systems through improved control of major diseases. OIE, Paris, France. [Google Scholar]
- 3.Thomson GR. 1995. Overview of foot and mouth disease in southern Africa. Rev Sci Tech 14:503–520. [DOI] [PubMed] [Google Scholar]
- 4.Bastos AD, Haydon DT, Sangare O, Boshoff CI, Edrich JL, Thomson GR. 2003. The implications of virus diversity within the SAT 2 serotype for control of foot-and-mouth disease in sub-Saharan Africa. J Gen Virol 84:1595–1606. doi: 10.1099/vir.0.18859-0. [DOI] [PubMed] [Google Scholar]
- 5.Hall MD, Knowles NJ, Wadsworth J, Rambaut A, Woolhouse ME. 2013. Reconstructing geographical movements and host species transitions of foot-and-mouth disease virus serotype SAT 2. mBio 4:e00591-13. doi: 10.1128/mBio.00591-13. [DOI] [PMC free article] [PubMed] [Google Scholar]
- 6.Dyason E. 2010. Summary of foot-and-mouth disease outbreaks reported in and around the Kruger National Park, South Africa, between 1970 and 2009. J S Afr Vet Assoc 81:201–206. [DOI] [PubMed] [Google Scholar]
- 7.Hedger RS. 1972. Foot-and-mouth disease and the African buffalo (Syncerus caffer). J Comp Pathol 82:19–28. doi: 10.1016/0021-9975(72)90022-9. [DOI] [PubMed] [Google Scholar]
- 8.Woodbury EL, Samuel AR, Knowles NJ, Hafez SM, Kitching RP. 1994. Analysis of mixed foot-and-mouth disease virus infections in Saudi Arabia: prolonged circulation of an exotic serotype. Epidemiol Infect 112:201–211. doi: 10.1017/S0950268800057575. [DOI] [PMC free article] [PubMed] [Google Scholar]
- 9.Cottral GE, Gailiunas P. 1971. Experimental multiple infection of animals with foot-and-mouth disease virus. Proc Annu Meet U S Anim Health Assoc 75:441–465. [Google Scholar]
- 10.Thomson GR, Vosloo W, Esterhuysen JJ, Bengis RG. 1992. Maintenance of foot and mouth disease viruses in buffalo (Syncerus caffer Sparrman, 1779) in southern Africa. Rev Sci Tech 11:1097–1107. [DOI] [PubMed] [Google Scholar]
- 11.Thomson GR. 1996. The role of carrier animals in the transmission of foot and mouth disease. OIE comprehensive reports on technical items presented to the international committee or to regional commissions, p 87–103. OIE, Paris, France. [Google Scholar]
- 12.Anderson EC, Doughty WJ, Anderson J, Paling R. 1979. The pathogenesis of foot-and-mouth disease in the African buffalo (Syncerus caffer) and the role of this species in the epidemiology of the disease in Kenya. J Comp Pathol 89:541–549. doi: 10.1016/0021-9975(79)90045-8. [DOI] [PubMed] [Google Scholar]
- 13.OIE. 2012. Foot and mouth disease, chapter 2.1.5. In OIE terrestrial manual, 7th ed, vol 1 OIE, Paris, France: http://www.oie.int/fileadmin/Home/eng/Health_standards/tahm/2.01.05_FMD.pdf. [Google Scholar]
- 14.Bengis RG, Thomson GR, Hedger RS, De Vos V, Pini A. 1986. Foot-and-mouth disease and the African buffalo (Syncerus caffer). 1. Carriers as a source of infection for cattle. Onderstepoort J Vet Res 53:69–73. [PubMed] [Google Scholar]
- 15.Dawe PS, Sorensen K, Ferris NP, Barnett IT, Armstrong RM, Knowles NJ. 1994. Experimental transmission of foot-and-mouth disease virus from carrier African buffalo (Syncerus caffer) to cattle in Zimbabwe. Vet Rec 134:211–215. doi: 10.1136/vr.134.9.211. [DOI] [PubMed] [Google Scholar]
- 16.Vosloo W, Bastos AD, Kirkbride E, Esterhuysen JJ, van Rensburg DJ, Bengis RG, Keet DW, Thomson GR. 1996. Persistent infection of African buffalo (Syncerus caffer) with SAT-type foot-and-mouth disease viruses: rate of fixation of mutations, antigenic change and interspecies transmission. J Gen Virol 77:1457–1467. doi: 10.1099/0022-1317-77-7-1457. [DOI] [PubMed] [Google Scholar]
- 17.Gainaru MD, Thomson GR, Bengis RG, Esterhuysen JJ, Bruce W, Pini A. 1986. Foot-and-mouth disease and the African buffalo (Syncerus caffer). II. Virus excretion and transmission during acute infection. Onderstepoort J Vet Res 53:75–85. [PubMed] [Google Scholar]
- 18.McVicar JW, McKercher PD, Graves JH. 1977. The influence of infectious bovine rhino-tracheitis virus on the foot and mouth disease carrier state. U S Anim Health Assoc Proc 80:254–261. [PubMed] [Google Scholar]
- 19.Condy JB, Hedger RS. 1974. The survival of foot-and-mouth disease virus in African buffalo with non-transference of infection to domestic cattle. Res Vet Sci 16:182–185. [PubMed] [Google Scholar]
- 20.Zhang ZD, Kitching RP. 2001. The localization of persistent foot and mouth disease virus in the epithelial cells of the soft palate and pharynx. J Comp Pathol 124:89–94. doi: 10.1053/jcpa.2000.0431. [DOI] [PubMed] [Google Scholar]
- 21.Arzt J, Juleff N, Zhang Z, Rodriguez LL. 2011. The pathogenesis of foot-and-mouth disease. I. Viral pathways in cattle. Transbound Emerg Dis 58:291–304. doi: 10.1111/j.1865-1682.2011.01204.x. [DOI] [PubMed] [Google Scholar]
- 22.Juleff N, Windsor M, Reid E, Seago J, Zhang Z, Monaghan P, Morrison IW, Charleston B. 2008. Foot-and-mouth disease virus persists in the light zone of germinal centres. PLoS One 3:e3434. doi: 10.1371/journal.pone.0003434. [DOI] [PMC free article] [PubMed] [Google Scholar]
- 23.Juleff ND, Maree FF, Waters R, Bengis RG, Charleston B. 2012. The importance of FMDV localisation in lymphoid tissue. Vet Immunol Immunopathol 148:145–148. doi: 10.1016/j.vetimm.2011.05.013. [DOI] [PubMed] [Google Scholar]
- 24.Bastos AD, Haydon DT, Forsberg R, Knowles NJ, Anderson EC, Bengis RG, Nel LH, Thomson GR. 2001. Genetic heterogeneity of SAT-1 type foot-and-mouth disease viruses in southern Africa. Arch Virol 146:1537–1551. doi: 10.1007/s007050170077. [DOI] [PubMed] [Google Scholar]
- 25.Esterhuysen JJ, Thomson GR, Flammand JR, Bengis RG. 1985. Buffalo in the northern Natal game parks show no serological evidence of infection with foot-and-mouth disease virus. Onderstepoort J Vet Res 52:63–66. [PubMed] [Google Scholar]
- 26.Kitching RP, Donaldson AI. 1987. Collection and transportation of specimens for vesicular virus investigation. Rev Sci Tech 6:263–272. [Google Scholar]
- 27.Casteleyn C, Breugelmans S, Simoens P, Van den Broeck W. 2011. The tonsils revisited: review of the anatomical localization and histological characteristics of the tonsils of domestic and laboratory animals. Clin Dev Immunol 2011:472460. doi: 10.1155/2011/472460. [DOI] [PMC free article] [PubMed] [Google Scholar]
- 28.Ganswindt A, Tordiffe ASW, Stam E, Howitt MJ, Jori F. 2012. Determining adrenocortical activity as a measure of stress in African buffalo (Syncerus caffer) based on faecal analysis. Afr Zool 47:261–269. doi: 10.3377/004.047.0211. [DOI] [Google Scholar]
- 29.Bastos AD. 1998. Detection and characterization of foot-and-mouth disease virus in sub-Saharan Africa. Onderstepoort J Vet Res 65:37–47. [PubMed] [Google Scholar]
- 30.Beck E, Strohmaier K. 1987. Subtyping of European foot-and-mouth disease virus strains by nucleotide sequence determination. J Virol 61:1621–1629. [DOI] [PMC free article] [PubMed] [Google Scholar]
- 31.Quan M, Murphy CM, Zhang Z, Alexandersen S. 2004. Determinants of early foot-and-mouth disease virus dynamics in pigs. J Comp Pathol 131:294–307. doi: 10.1016/j.jcpa.2004.05.002. [DOI] [PubMed] [Google Scholar]
- 32.King DP, Ferris NP, Shaw AE, Reid SM, Hutchings GH, Giuffre AC, Robida JM, Callahan JD, Nelson WM, Beckham TR. 2006. Detection of foot-and-mouth disease virus: comparative diagnostic sensitivity of two independent real-time reverse transcription-polymerase chain reaction assays. J Vet Diagn Invest 18:93–97. doi: 10.1177/104063870601800114. [DOI] [PubMed] [Google Scholar]
- 33.Brehm KE, Ferris NP, Lenk M, Riebe R, Haas B. 2009. Highly sensitive fetal goat tongue cell line for detection and isolation of foot-and-mouth disease virus. J Clin Microbiol 47:3156–3160. doi: 10.1128/JCM.00510-09. [DOI] [PMC free article] [PubMed] [Google Scholar]
- 34.Charleston B, Bankowski BM, Gubbins S, Chase-Topping ME, Schley D, Howey R, Barnett PV, Gibson D, Juleff ND, Woolhouse ME. 2011. Relationship between clinical signs and transmission of an infectious disease and the implications for control. Science 332:726–729. doi: 10.1126/science.1199884. [DOI] [PMC free article] [PubMed] [Google Scholar]
- 35.Ferris NP, Kitching RP, Oxtoby JM, Philpot RM, Rendle R. 1990. Use of inactivated foot-and-mouth disease virus antigen in liquid-phase blocking ELISA. J Virol Methods 29:33–41. doi: 10.1016/0166-0934(90)90005-Z. [DOI] [PubMed] [Google Scholar]
- 36.Fray MD, Mann GE, Charleston B. 2001. Validation of an Mx/CAT reporter gene assay for the quantification of bovine type-I interferon. J Immunol Methods 249:235–244. doi: 10.1016/S0022-1759(00)00359-8. [DOI] [PubMed] [Google Scholar]
- 37.Herrera M, Garcia-Arriaza J, Pariente N, Escarmis C, Domingo E. 2007. Molecular basis for a lack of correlation between viral fitness and cell killing capacity. PLoS Pathog 3:e53. doi: 10.1371/journal.ppat.0030053. [DOI] [PMC free article] [PubMed] [Google Scholar]
- 38.Seago J, Juleff N, Moffat K, Berryman S, Christie JM, Charleston B, Jackson T. 2013. An infectious recombinant foot-and-mouth disease virus expressing a fluorescent marker protein. J Gen Virol 94:1517–1527. doi: 10.1099/vir.0.052308-0. [DOI] [PMC free article] [PubMed] [Google Scholar]
- 39.R Core Team. 2014. A language and environment for statistical computing. R Foundation for Statistical Computing, Vienna, Austria: http://www.R-project.org/. [Google Scholar]
- 40.Pinheiro J, Bates D, DebRoy S, Sarkar D, Team RC . 2014. nlme: linear and nonlinear mixed effects models. R package version 3.1-117. R Foundation for Statistical Computing, Vienna, Austria. [Google Scholar]
- 41.Venables WN, Ripley BD. 2002. Modern applied statistics with S, 4th ed Springer, New York, NY. [Google Scholar]
- 42.Hothorn T, Bretz F, Westfall P. 2008. Simultaneous inference in general parametric models. Biom J 50:346–363. doi: 10.1002/bimj.200810425. [DOI] [PubMed] [Google Scholar]
- 43.Windsor MA, Carr BV, Bankowski B, Gibson D, Reid E, Hamblin P, Gubbins S, Juleff N, Charleston B. 2011. Cattle remain immunocompetent during the acute phase of foot-and-mouth disease virus infection. Vet Res 42:108. doi: 10.1186/1297-9716-42-108. [DOI] [PMC free article] [PubMed] [Google Scholar]
- 44.Young E, Hedger RS, Howell PG. 1972. Clinical foot-and-mouth disease in the African buffalo (Syncerus caffer). Onderstepoort J Vet Res 39:181–184. [PubMed] [Google Scholar]
- 45.Vosloo W, de Klerk LM, Boshoff CI, Botha B, Dwarka RM, Keet D, Haydon DT. 2007. Characterisation of a SAT-1 outbreak of foot-and-mouth disease in captive African buffalo (Syncerus caffer): clinical symptoms, genetic characterisation and phylogenetic comparison of outbreak isolates. Vet Microbiol 120:226–240. doi: 10.1016/j.vetmic.2006.11.002. [DOI] [PubMed] [Google Scholar]
- 46.Chase-Topping ME, Handel I, Bankowski BM, Juleff ND, Gibson D, Cox SJ, Windsor MA, Reid E, Doel C, Howey R, Barnett PV, Woolhouse ME, Charleston B. 2013. Understanding foot-and-mouth disease virus transmission biology: identification of the indicators of infectiousness. Vet Res 44:46. doi: 10.1186/1297-9716-44-46. [DOI] [PMC free article] [PubMed] [Google Scholar]
- 47.Alexandersen S, Zhang Z, Donaldson AI, Garland AJM. 2003. The pathogenesis and diagnosis of foot-and-mouth disease. J Comp Pathol 129:1–36. doi: 10.1016/S0021-9975(03)00041-0. [DOI] [PubMed] [Google Scholar]
- 48.Stenfeldt C, Belsham GJ. 2012. Detection of foot-and-mouth disease virus RNA in pharyngeal epithelium biopsy samples obtained from infected cattle: investigation of possible sites of virus replication and persistence. Vet Microbiol 154:230–239. doi: 10.1016/j.vetmic.2011.07.007. [DOI] [PubMed] [Google Scholar]
- 49.Pega J, Bucafusco D, Di Giacomo S, Schammas JM, Malacari D, Capozzo AV, Arzt J, Perez-Beascoechea C, Maradei E, Rodriguez LL, Borca MV, Perez-Filgueira M. 2013. Early adaptive immune responses in the respiratory tract of foot-and-mouth disease virus-infected cattle. J Virol 87:2489–2495. doi: 10.1128/JVI.02879-12. [DOI] [PMC free article] [PubMed] [Google Scholar]
- 50.Cottral GE. 1969. Persistence of foot-and-mouth disease virus in animals, their products and the environment. Bull Off Int Epizoot 71:549–568. [PubMed] [Google Scholar]
- 51.Burrows R. 1968. The persistence of foot-and mouth disease virus in sheep. J Hyg (Lond) 66:633–640. doi: 10.1017/S0022172400028369. [DOI] [PMC free article] [PubMed] [Google Scholar]
- 52.Stenfeldt C, Pacheco JM, Smoliga GR, Bishop E, Pauszek SJ, Hartwig EJ, Rodriguez LL, Arzt J. 18 June 2014. Detection of foot-and-mouth disease virus RNA and capsid protein in lymphoid tissues of convalescent pigs does not indicate existence of a carrier state. Transbound Emerg Dis doi: 10.1111/tbed.12235. [DOI] [PubMed] [Google Scholar]
- 53.Heesters BA, Chatterjee P, Kim YA, Gonzalez SF, Kuligowski MP, Kirchhausen T, Carroll MC. 2013. Endocytosis and recycling of immune complexes by follicular dendritic cells enhances B cell antigen binding and activation. Immunity 38:1164–1175. doi: 10.1016/j.immuni.2013.02.023. [DOI] [PMC free article] [PubMed] [Google Scholar]
- 54.Heesters BA, Myers RC, Carroll MC. 2014. Follicular dendritic cells: dynamic antigen libraries. Nat Rev Immunol 14:495–504. doi: 10.1038/nri3689. [DOI] [PubMed] [Google Scholar]
- 55.Habiela M, Seago J, Perez-Martin E, Waters R, Windsor M, Salguero FJ, Wood J, Charleston B, Juleff N. 2014. Laboratory animal models to study foot-and-mouth disease: a review with emphasis on natural and vaccine induced immunity. J Gen Virol 95(Part 11):2329–2345. doi: 10.1099/vir.0.068270-0. [DOI] [PMC free article] [PubMed] [Google Scholar]
- 56.Woodbury EL, Samuel AR, Knowles NJ. 1995. Serial passage in tissue culture of mixed foot-and-mouth disease virus serotypes. Arch Virol 140:783–787. doi: 10.1007/BF01309966. [DOI] [PubMed] [Google Scholar]
- 57.Marks H, van Duijse JJ, Zuidema D, van Hulten MC, Vlak JM. 2005. Fitness and virulence of an ancestral white spot syndrome virus isolate from shrimp. Virus Res 110:9–20. doi: 10.1016/j.virusres.2005.01.002. [DOI] [PubMed] [Google Scholar]
- 58.Frolov I, Agapov E, Hoffman TA Jr, Pragai BM, Lippa M, Schlesinger S, Rice CM. 1999. Selection of RNA replicons capable of persistent noncytopathic replication in mammalian cells. J Virol 73:3854–3865. [DOI] [PMC free article] [PubMed] [Google Scholar]
- 59.Ojosnegros S, Beerenwinkel N, Antal T, Nowak MA, Escarmis C, Domingo E. 2010. Competition-colonization dynamics in an RNA virus. Proc Natl Acad Sci U S A 107:2108–2112. doi: 10.1073/pnas.0909787107. [DOI] [PMC free article] [PubMed] [Google Scholar]
- 60.Ojosnegros S, Delgado-Eckert E, Beerenwinkel N. 2012. Competition-colonization trade-off promotes coexistence of low-virulence viral strains. J R Soc Interface 9:2244–2254. doi: 10.1098/rsif.2012.0160. [DOI] [PMC free article] [PubMed] [Google Scholar]
- 61.Ojosnegros S, Beerenwinkel N, Domingo E. 2010. Competition-colonization dynamics: an ecology approach to quasispecies dynamics and virulence evolution in RNA viruses. Commun Integr Biol 3:333–336. doi: 10.4161/cib.3.4.11658. [DOI] [PMC free article] [PubMed] [Google Scholar]