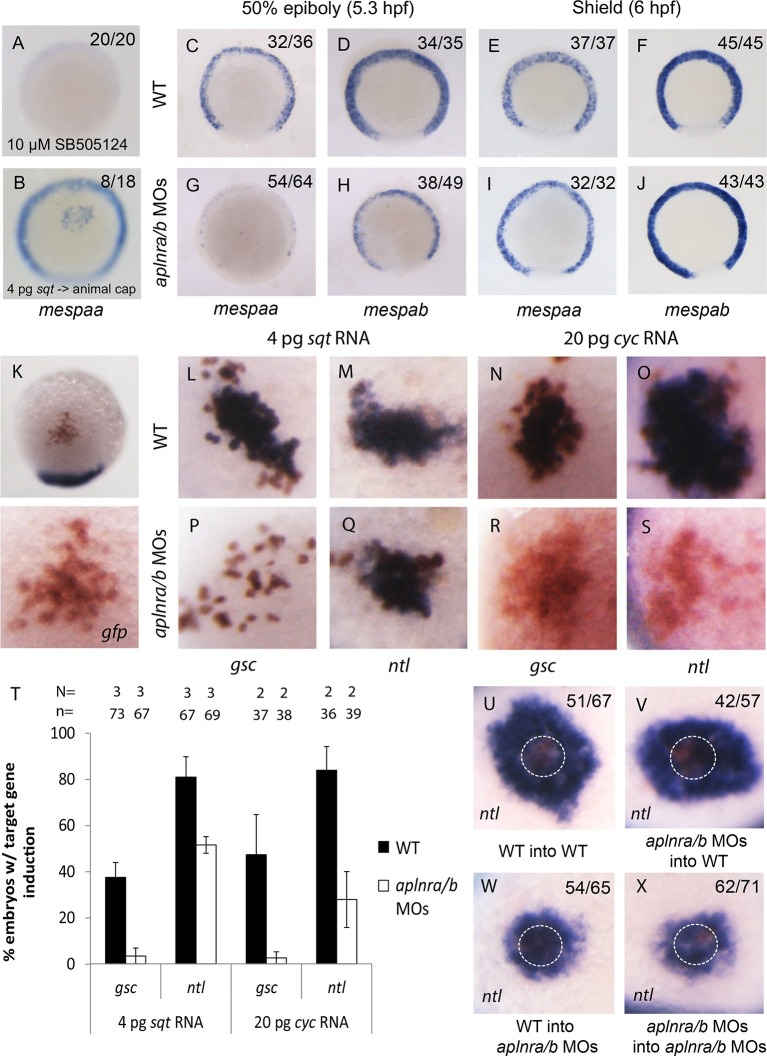
Figure 4. Loss of aplnr results in a delay in mesp gene expression and the attenuation of Sqt and Cyc activity in a non-cell autonomous manner by aplnr.
(A) Animal view of mespaa expression at 50% epiboly (5.25 hpf) in embryos treated with 10 μM of SB505124 from 4–5.25 hpf. Animal cap view with dorsal to the bottom. (B) Animal view of mespaa expression at 50% epiboly (5.25 hpf) in embryos in which cells expressing 4 pg of sqt RNA were transplanted into the animal cap. Animal cap view with dorsal to the bottom. (C–J) Expression of mespaa and mespab at 50% epiboly (5.3 hpf) (C,D,G,H) and the shield stage (6 hpf) (E,F,I,J) in WT and aplnra/b morphant embryos when examined by WISH. Embryos are viewed from the animal pole with dorsal at the bottom. (K) Animal cap transplant of GFP expressing control cells detected by WISH. (L–T) Animal cap transplants of sqt or cyc overexpressing cells into WT (L–O) or aplnra/b morphant embryos (P–S) at 5.5 hpf. gsc and ntl expression is displayed in blue and gfp expressing donor cells are marked in brown. Both donor cells and hosts are of the same background (WT into WT or morphant into morphant). Embryos are viewed from the animal pole with dorsal at the bottom. Data are represented as means ± SEM. (U–X) Animal cap transplants of cells expressing high levels of sqt RNA at 5.5 hpf. ntl expression is visualized in blue and gfp expressing donor cells are brown. Four different combinations of donor/host cells were examined, WT into WT (donor into host) (U), aplnra/b morphant into WT (V), WT into aplnra/b morphant (W) and aplnra/b morphant into morphant (X). Donor cells are circled in white. Embryos are viewed from the animal pole with dorsal at the bottom.
DOI: http://dx.doi.org/10.7554/eLife.13758.010


