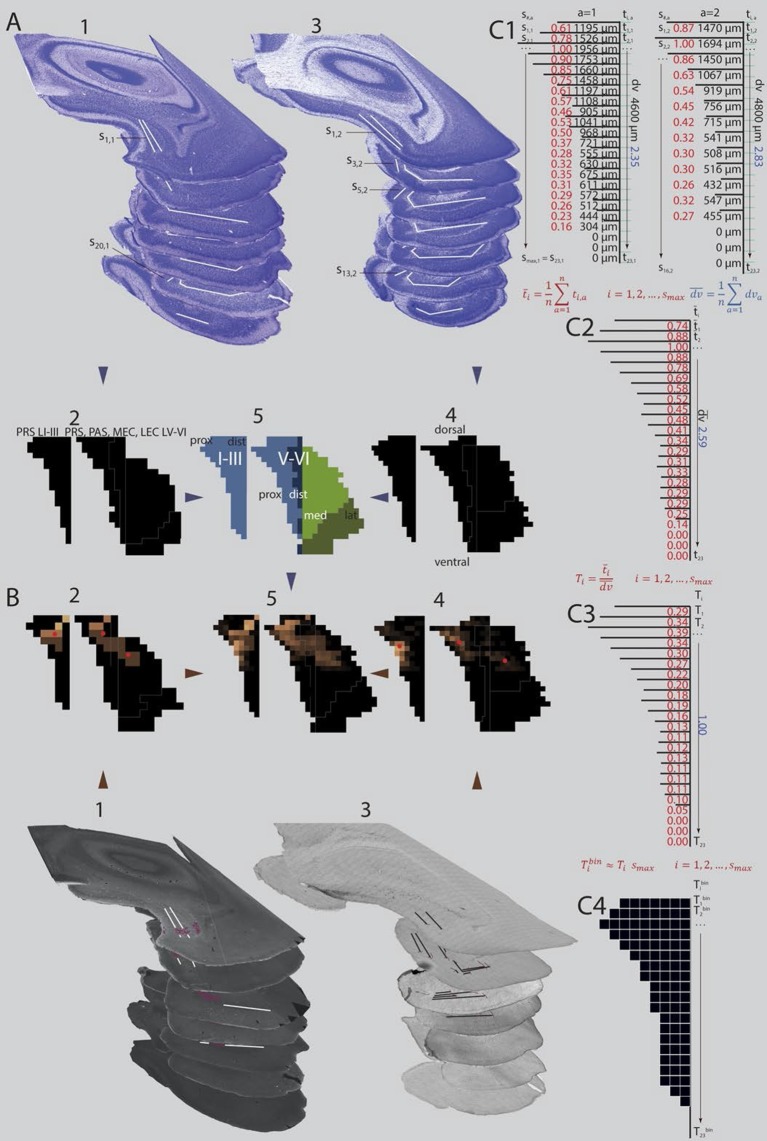
Figure 4. Standardized representation of location of labeled axons in PHR.
(A) Extents of PrS, deep layers of PaS and deep layers of EC were measured in the horizontal plane (1; Nissl stained sections from case 18427, 3; Nissl stained sections from case 18589). In every section, the extents of PrS, PaS, MEC and LEC along the transverse axis were measured. Based on the measurements of all sections in all brains (2 and 4) we binned the PHR along the dorsoventral and transverse axis and made an average representation of PHR (5; left: layers I and III of PrS (light blue), right: layers V-VI of PrS (light blue), PaS (dark blue), MEC (light green) and LEC (dark green). Dorsal, ventral, proximal (prox), distal (dist), medial (med), lateral (lat) indicates dorsoventral and transverse axis of the flatmaps. s#,a refers to individual measurements of layers I and III of PrS in C1. (B) Locations of labeled fibers were obtained by measuring the distance between the plexus and the borders of the field in which the plexus was located (1; case 18427, note that we inserted magenta labeled structures to illustrate labeled fibers and their respective positions on the flatmaps). The measurements were performed in every section containing a plexus. The bins between the boundaries of each plexus were given a value ranging from 1 to 3 reflecting weak to dense labeling respectively (color coded in 2, 1 = brown; 2 = orange; 3 = bright yellow). Bins outside the plexus boundaries were given the value 0 (black, no plexus). In experiments in which we observed single labeled axons or a sparse plexus, we measured the distance from each labeled axon to one of the borders of the field in which the plexus was located (3; case 18589; repeating patterns in top sections are artefacts due to stitching of digitized images). We inserted magenta labeled fibers and their respective positions on the flatmaps). We gave each bin in the flatmap a value corresponding to the number of labeled single axons (4; bins not containing any labeled fibers: black; bins with the highest number of labeled axons: bright yellow). For all flatmaps, the centers of mass for layers I and III in PrS, layers V-VI of PrS and PaS combined and layers V-VI of MEC and LEC combined were calculated (red dots). To compare groups of injections, flatmaps of individual injections were normalized to the highest valued bin, transformed to the average flatmap and added together (5; see methods for further details). (C) Binning of layers I and III of PrS along the dorsoventral and along the transverse axis. The example is based on animals 18427 (left) and 18589 (right; both shown Figure 4A and B). All subdivisions are binned according to the same algorithm. First the transverse measurements (s#,a, visualized by black lines in C1) and the dorsoventral measurement () in all sections in all animals were normalized to the longest measurement of the respective subdivision in the particular animal (red (transverse) and blue (dorsoventral) numbers in C1). Next, we binned the dorsoventral axis of each PHR subdivision (represented by turquois lines in C1) in the same amounts of bins as the maximum number of sections containing PHR in a single series (; 23 in the example) and calculated the transverse extends of each row of bins in each animal (, numbers not shown). Thereafter, we calculated the means of the normalized transverse measurements across all animals for each bin (, red numbers in C2), and the mean across all animals of the normalized dorsoventral extend of PHR (; blue number in C2). The ratio of the mean transverse extends and the mean dorsoventral extend was calculated such that each dorsoventral level was expressed as a value relative to the dorsoventral extent of PHR (; red numbers in C3). Finally, the number of bins along the transverse axis for each dorsoventral level () was calculated (C4).

