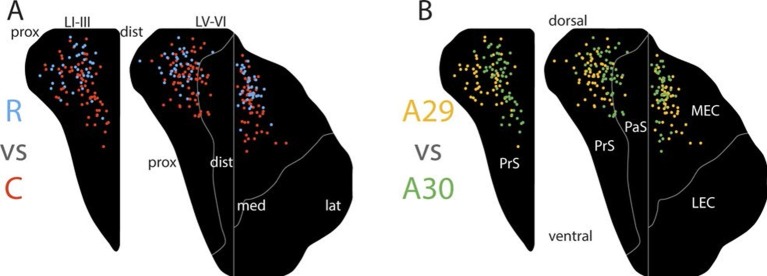
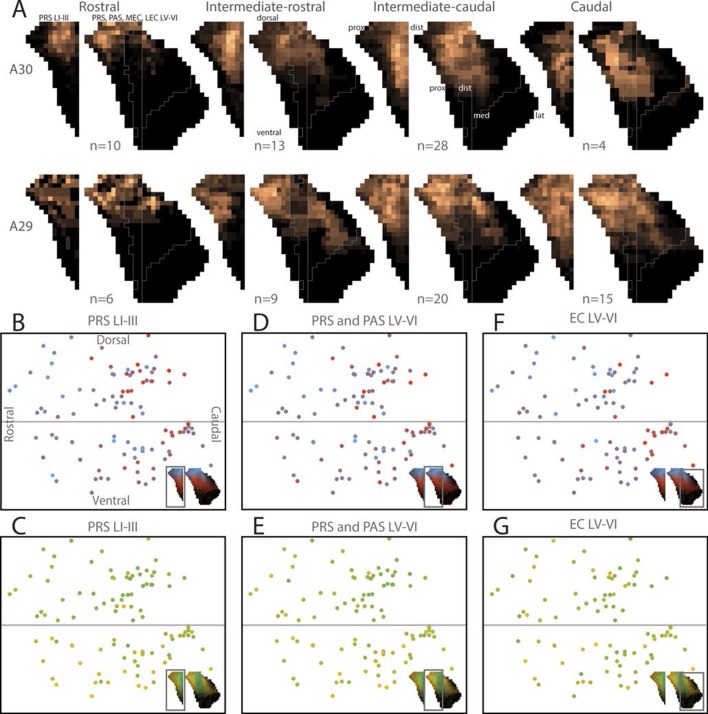
Figure 5. Topographical organization of projections.
The position of the centers of mass of labelling in layers I and III of PrS, layers V-VI of PrS and PaS and layers V-VI of MEC and LEC is plotted. Each dot is color coded with respect to the rostrocaudal (A) or dorsoventral position (B) of the injections in RSC (rostral half; blue, caudal half; red, A29; yellow, A30; green). In layers I and III of PrS more caudally placed injections result in projections located more ventral compared to rostrally placed injections (A; p<0.001), while ventrally placed injections result in projections located more proximal compared to dorsally placed injections (B; p<0.001). In layers V-VI of PrS and PaS caudally placed injections result in projections located more ventral compared with rostrally placed injections (A; p<0.001), while ventral and rostrally placed injections result in projections located significantly more proximal compared with dorsally and caudally placed injections (B; ventral: p<0.001, caudal: p=0.033). In MEC and LEC layers V-VI, caudal and ventrally placed injections result in projections located significantly more ventral compared to rostral and dorsally placed injections (A; caudal: p<0.001, ventral: p=0.032), while ventrally placed injections result in projections located significantly more lateral compared to dorsally placed injections (B; p=0.020). Multiple regression was used for all statistical tests (Figure 5—source data 1–12). For flatmaps of the projection patterns see Figure 5—figure supplement 1.
DOI: http://dx.doi.org/10.7554/eLife.13925.009


