Abstract
Ex-vivo hemilarynx experiments allow the visualization and quantification of three-dimensional dynamics of the medial vocal fold surface. For three excised human male larynges, the vibrational output, the glottal flow resistance, and the sound pressure during sustained phonation were analyzed as a function of vocal fold adduction for varying subglottal pressure. Empirical eigenfunctions, displacements, and velocities were investigated along the vocal fold surface. For two larynges, an increase of adduction level resulted in an increase of the glottal flow resistance at equal subglottal pressures. This caused an increase of lateral and vertical oscillation amplitudes and velocity indicating an improved energy transfer from the airflow to the vocal folds. In contrast, the third larynx exhibited an amplitude decrease for rising adduction accompanying reduction of the flow resistance. By evaluating the empirical eigenfunctions, this reduced flow resistance was assigned to an unbalanced oscillation pattern with predominantly lateral amplitudes. The results suggest that adduction facilitates the phonatory process by increasing the glottal flow resistance and enhancing the vibrational amplitudes. However, this interrelation only holds for a maintained balanced ratio between vertical and lateral displacements. Indeed, a balanced vertical-lateral oscillation pattern may be more beneficial to phonation than strong periodicity with predominantly lateral vibrations.
I. INTRODUCTION
The oscillation of the vocal folds is a primary characteristic of voice production.1 The oscillations extend primarily in the medio-lateral and vertical directions.2,3 During phonation, vocal fold movement is similar to a wave motion of the vocal fold surface starting inferiorly and continuing along the medial surface toward the superior surface of the vocal folds.4,5 In-vivo and ex-vivo analysis of the full larynx during phonation mainly permits observation, imaging, and quantification of the superior surface of the vocal folds and the vocal fold edges.6–8 Although such studies yield detailed quantitative information about vocal fold dynamics,9–13 several crucial aspects of vocal dynamics, such as mucosal wave propagation along the medial surface and the convergent-divergent shape change of the glottal duct, can barely be captured from the top view.14–16
The hemilarynx methodology was developed to yield optical access to the entire surface dynamics of the vocal folds during phonation. It especially enables the visualization of the medial surface. Experiments using the hemilarynx setup include ex-vivo human17 and animal18 models, in-vivo animal models,19 and in vitro synthetic models.20–22 In such setups, one vocal fold is removed and replaced by a glass plate or prism, yielding a direct view of the entire surface of the remaining vocal fold.
Using an ex-vivo larynx setup, Jiang and Titze18 performed the first methodological study of the hemilarynx as a substitute for the full larynx. They demonstrated the validity of the results and also the potential to access the medial surface dynamics of the vocal fold. Later, Berry et al.5 quantitatively analyzed the dynamics of nine markers placed along one coronal cross-section of the medial surface of the vocal fold. In addition to the absolute displacement values, they performed a spatio-temporal analysis to calculate the empirical eigenfunctions (EEFs) of the reconstructed vocal fold dynamics. They showed that only two spatial eigenmodes were necessary to capture the major characteristics for periodic vocal fold oscillations. Moreover, the analysis of the eigenmodes suggested the physical mechanism of convergent-divergent shape changes of the glottal duct to facilitate the energy transfer from the airflow to the vocal fold tissues, which thus enabled sustained vocal fold oscillation.
These initial studies utilized ex-vivo canine larynges, whereas subsequent investigations utilized ex-vivo human larynges. Döllinger and Berry23 improved the ex-vivo hemilarynx methodology by mounting a grid of 30 sutures along the entire medial surface of the vocal fold. They also improved the calibration technique, yielding a decrease in the calibration error by more than two-thirds of the original value.23 Based on this improved setup, several studies were performed. The three-dimensional (3D) motions of the entire vocal fold surface were visualized and quantified for normal vibrations.24 Mucosal wave propagation was reported for normal vocal fold dynamics.17 Spatio-temporal analysis confirmed theoretical assumptions regarding the convergent-divergent shape change of the glottal flow duct during normal vibration.25 It was found that the convergent-divergent glottal shape change is generated by the largest EEF (EEF1), whereas the in-phase lateral movement of the vocal folds was captured within the second largest EEF (EEF2). This again supported the basic physical mechanisms for sustained vocal fold oscillation.26
In addition to the basic investigations of normal phonation, the improved ex-vivo hemilarynx setup permits systematic variation of the elongation and adduction forces by pulling inferiorly at the thyroid cartilage and anteriorly at the muscular process (MP) of the arytenoid cartilage, respectively. First attempts were reported by Döllinger and Berry.24
In studies with full larynx setups, the adduction of the vocal folds showed a large influence on the quality of the voice signal.27–29 From an aerodynamic point of view, a high degree of adduction results in large glottal flow resistance which was demonstrated by Alipour and colleagues with ex-vivo full larynx models of different animal species.30,31 That is, the higher the adduction, the higher is the force input or energy transfer into the vocal folds.
In this context28,30,32 and in more general studies of the phonatory process, full synthetic33 and biological3 larynx models are used most commonly. However, except for numerical models,34–36 a supplementary investigation of the medial surface dynamics is nearly impossible. Therefore, in this work, we performed ex-vivo experiments with three human cadaver hemilarynges. In particular, we correlated vocal fold adduction with the glottal flow resistance and with the medial surface vocal fold dynamics.
The goal of our study was to gain insights into the functional chain linking the subglottal pressure with the intraglottal aerodynamics and the resulting vocal fold dynamics, all as a function of glottal adduction. To achieve this goal, relations between glottal flow, subglottal pressure, and structural vocal fold dynamics were analyzed as a function of adduction.
Our hypotheses are that: (1) the vocal fold adduction is a key parameter for the control of the energy transfer from the airflow to the vocal folds; (2) the dynamic shape characteristics of vocal fold oscillation determine the efficiency of the energy transfer; and (3) EEF analysis allows the identification of specific characteristics of the vocal fold oscillations.
As compared with previous work, the major innovative aspect of this study is the analysis and correlation of the aerodynamic influence of vocal fold adduction on the oscillatory behavior of the medial surface of the vocal folds, as identified and visualized through EEF analysis.
II. METHODS
A. Ex-vivo hemilarynx setup
The ex-vivo and in-vivo hemilarynx setup has been established over the past 20 yrs. Its aim is to study vocal fold dynamics5,18,19,37 and the influence of the supraglottal tract on vocal fold dynamics.38,39 For convenience, the applied ex-vivo setup described in detail previously17,23,24 is briefly outlined below.
Hemilarynx experiments were performed ex-vivo with three human cadaver larynges. For each larynx, one vocal fold was removed to expose the entire surface of the remaining vocal fold, Fig. 1(a). The trachea was mounted on a stainless-steel cylindrical tube. A glass plate was attached at the top of the tube located at the glottal mid-line replacing the removed vocal fold. To prevent anterior and posterior air leakage between the larynx cartilage and the glass-plate, silicone grease, and gauze strips were applied. Additionally, the larynx position was fixed and slightly pushed against the glass plate.
FIG. 1.
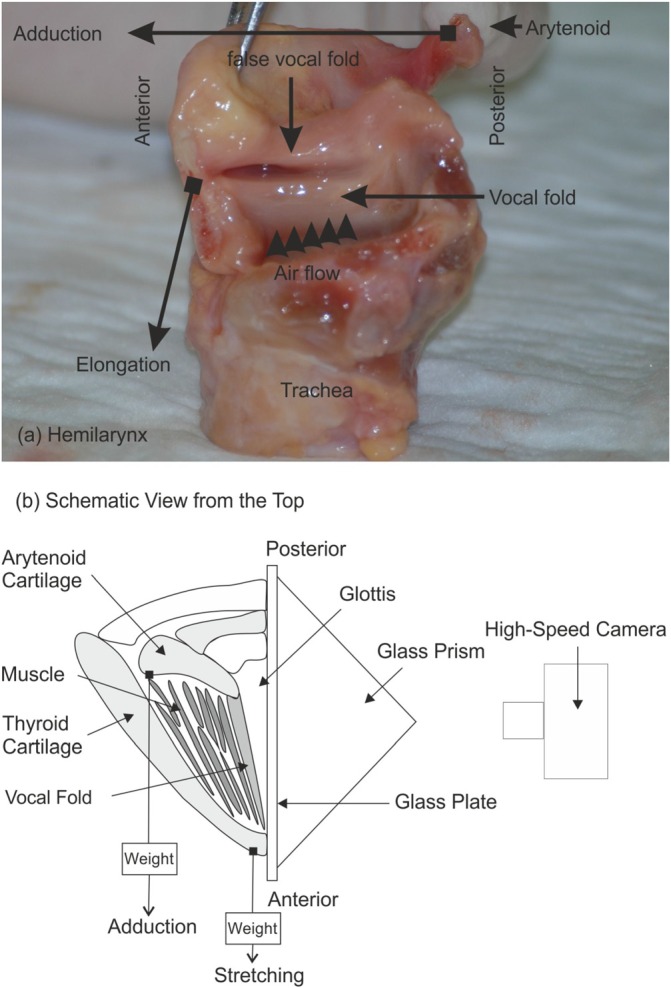
(Color online) (a) Photograph of a human hemilarynx. The adduction and elongation forces are indicated schematically by black arrows with their points of attack marked by filled squares. The false vocal fold was additionally removed for our experiments. (b) Schematic of the entire experimental setup.
To modify the degree of vocal fold adduction, a suture pierced the arytenoid cartilage at the MP to attach varying weights (MP10 = 10 g, MP50 = 50 g, MP100 = 100 g), Fig. 1. The purpose of this suture was designed to simulate the action of the lateral cricoarytenoid muscle. Another suture with a constant weight (10 g) was attached anteriorly at the thyroid cartilage (Fig. 1) to provide slight longitudinal tension in the vocal fold to permit vibrations. The purpose of this suture was designed to simulate the action of the cricothyroid muscle. Self-sustained vibrations were induced by air pressure forces generated by a humidified (Teleflex – Hudson RCI Concha Therm III, Servo-Controlled Heater Morrisville, NC, USA) and heated (37 °C) airflow, which passed through the trachea and through the hemiglottis. In this setup, the hemiglottis refers to the gap that is enclosed by the glass plate and the remaining vocal fold. Its oscillatory motion was recorded using a Photron Fastcam-Ultima APX high-speed digital camera (Photron Limited, Tokyo, Japan); settings are given in Table I.
TABLE I.
Description of larynges and high-speed camera settings.
| Recordings | Larynx 1 (L1) | Larynx 2 (L2) | Larynx 3 (L3) |
|---|---|---|---|
| Sex | m | m | m |
| Age (yr) | 35 | 73 | 39 |
| Vocal fold side | left | left | right |
| Frame rate (fps) | 2000 | 4000 | 4000 |
| Pixel res. | 1024 × 1024 | 512 × 512 | 512 × 512 |
| Sequence (ms) | 110 | 110 | 110 |
| lE(%) (Ref. 23) | 6.1 ± 0.8 | 2.6 ± 0.4 | 3.8 ± 0.9 |
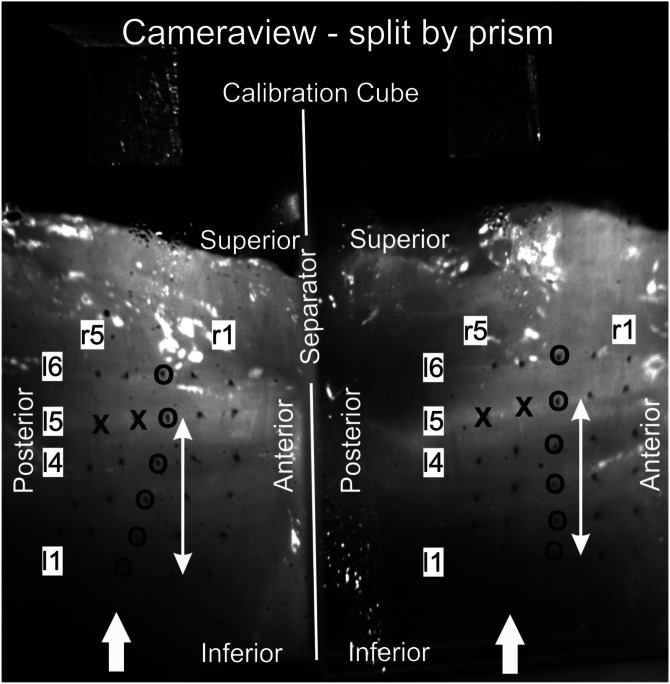
To track the movements of the medial surface of the vocal fold, 30 surgical microsutures (diameter 0.034 mm) were sewed into the mucosal epithelium, Fig. 2.24 The sutures were arranged in five vertical rows: r1 (anterior) to r5 (posterior). Each vertical row consisted of six sutures: l1 (inferior) to l6 (top), Fig. 2. The first four horizontal lines (l1 to l4) starting inferiorly were placed along the medial surface. The fifth horizontal line (l5) was placed close to the vocal fold edge; the sixth line (l6) was just above the vocal fold edge. The distance between two neighboring sutures was calculated as 1.96 ± 0.3 mm. To avoid any disturbance of the natural dynamics of the vocal fold, an experienced phonosurgeon sewed the sutures to penetrate only the mucosal epithelium and not the superficial layer.5 Tracking of the sutures in the high-speed movies was performed semi-automatically on a sub-pixel basis. The user roughly marked the dark suture, which had dimensions of approximately 3 × 3 pixels and was easily detectable on the brighter tissue, by a mouse-click. Then the software calculated the center of mass of the dark pixels as the exact suture position.
FIG. 2.
Camera view showing one frame for larynx L1. Because of the prism, the camera picture is split, generating two perspectives of the vocal fold surface. The suture grid containing five vertical suture rows (r1–r5) with six horizontal lines (l1–l6) is given. Sutures used for verifying adduction are marked by x. The sutures along column r3, which are used for visualizing the EEFs, are marked by o. The white arrows aside r3 indicate the distance between sutures l1 and l5 (approximately 8 mm) for which the mucosal wave phase delay is computed. The white arrows at the bottom indicate the airflow direction.
For calibration (i.e., computing the physical coordinates in metric units), a brass cube with edge length 5.0 mm was glued to the glass plate superior to the vocal fold, Fig. 2.23 On the other side of the glass plate, a right-angle prism was attached to yield two different visual perspectives of the medial surface (Fig. 2) of the vocal fold, simulating the recording situation with two cameras. Together with the calibration cube, this procedure permitted the reconstruction of the 3D coordinates of the mounted sutures.23 The computation of the physical coordinates of the sutures was performed using a previously described linear transformation method.23 For this method, a root mean-square linearization error (lE) can be computed to determine the accuracy of the experimental results. This lE error was determined as approximately 5%, which ensured sufficient accuracy.23,25
B. Data acquisition
Three male human cadaver larynges were investigated during sustained phonation, Table I. The larynges were harvested at autopsy from the medical school at UCLA not later than 24 h after the person died. The larynges were then quick frozen (liquid nitrogen) and stored at −80 °C. The day before the experiment, the larynges were placed in physiological saline solution, stored in a refrigerator at (4 °C) and slowly thawed overnight. The next morning, the larynges were prepared just before the experiments, which lasted approximately 1 h. The experiments were approved by the local ethics committee.
In total, 30 experiments were performed to analyze changes in the vocal fold oscillatory pattern due to varying adduction levels of the vocal folds (MP10 = 10 g-low, MP50 = 50 g-medium, MP100 = 100 g-high). In the experiments, the subglottal pressure PS was varied in the range 0.9 kPa ≤ PS ≤ 4.3 kPa, which is in the physiological range.33 The elongation force was kept constant at a low level at 10 g. Adduction and elongation forces were induced by applying weights, as described in Sec. II A. The applied forces were in the range reported elsewhere.25,28
High-speed image data, sound pressure level (SPL) (ELV SPM 120 ELV Elektronik AG, Leer, Germany) at a distance of 30 cm above the larynx and inclined by 45° to the flow axis, and subglottal pressure (PS) in kPa at 8 cm below the vocal folds (Dwyer, Michigan City, IN, USA, Series 475 Mark III Handheld Digital Manometer) were recorded. After semi-automated suture tracking had been implemented for both prism perspectives, the 3D suture trajectories were computed for 110 ms of sustained phonation at constant PS.
To exclude outliers and artifacts, a pre-processing step was performed prior to data analysis. Sutures exhibiting only noisy behavior (displacements ≤2 pixels) or sutures disappearing during the oscillation cycle were excluded from further analysis. On average, five sutures (17%) per recording were excluded. For the trajectories of the remaining sutures, noise components were filtered by performing a principal component analysis. Oscillatory components were only considered when the associated EEFs captured at least 2% of the dynamic variance.25 Using the filtered trajectories, a phase-averaged oscillation cycle was computed for which local parameters (i.e., displacements and velocities) for individual sutures were calculated.
C. Data analysis
Pre-analysis: To examine whether the vocal fold actually adducted as adduction forces increased, the lateral coordinates of the two most posterior sutures close to the vocal fold edge r4l5 and r5l5 (marked x in Fig. 2) were computed after placing the weights. Lateral distances to the glass plate are given in Table II. The distances become smaller from MP10 to MP50 to MP100, indicating that the vocal folds move closer to the glass plate with increasing adduction forces. This confirms the correct function of the simulated adduction for all three larynges. Moreover, the decrease in distance as a percentage for MP50 and MP100 toward MP10 is given. It shows that for MP50, the effect is rather small and reaches 1%–21%. However, for MP100 the adduction effect is much more obvious and reduces the distances of the vocal fold to the glass plate to 6%–47%. Furthermore, the distances between vocal fold and glass plate are always smaller for MP100 than for MP50.
TABLE II.
Verification of adduction for increasing adduction forces. For all three larynges, the distances of the posterior positioned sutures (see Fig. 2) around the vocal fold edge decrease for increasing weights, i.e., the vocal fold gets closer to the glass plate. This verifies the increasing adduction due to increasing weights. Negative percentages show the decrease of distance in comparison to 10 g.
| Larynx | Sutures | Distances [mm] to glass plate for adduction forces at MP | ||
|---|---|---|---|---|
| 10 g | 50 g | 100 g | ||
| L1 | r4l5 | 1.83 | 1.81 (−1%) | 1.13 (−38%) |
| r5l5 | 1.82 | 1.77 (−3%) | 1.05 (−42%) | |
| L2 | r4l5 | 1.27 | 1.16 (−9%) | 1.04 (−18%) |
| r5l5 | 1.54 | 1.48 (−4%) | 1.45 (−6%) | |
| L3 | r4l5 | 2.05 | 1.61 (−21%) | 1.09 (−47%) |
| r5l5 | 2.21 | 1.88 (−15%) | 1.46 (−34%) | |
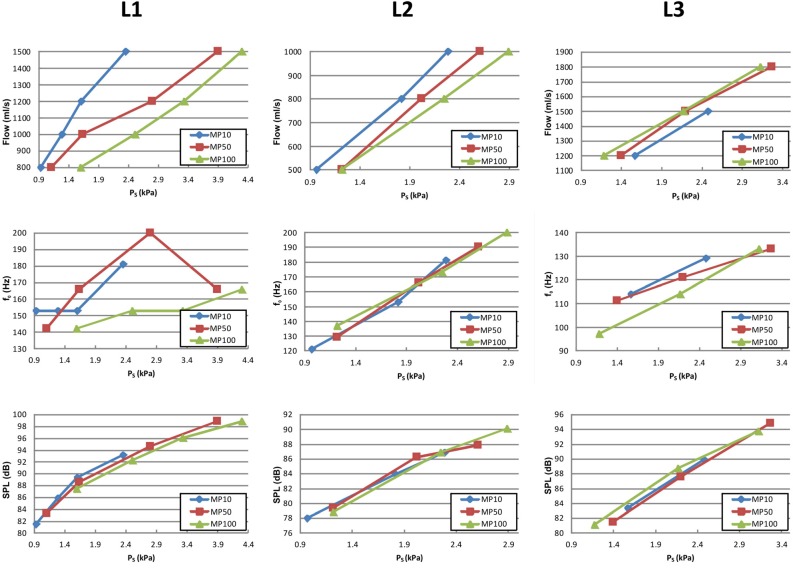
To ensure that there was no airflow leakage within the setup, the relation between subglottal pressure and applied airflow was tested. Because of the linear correlation between these two parameters, as displayed in the top row of Fig. 3, which has also been reported by Alipour and colleagues,28,30,32,40 flow leakage in the setup was ruled out for all three larynges. The control variable for the succeeding measurements was subglottal pressure PS, which was kept constant during each experimental run. In the following, the parameters being analyzed are introduced.
FIG. 3.
(Color online) The global variables airflow (top line), f0 (middle line), and SPL (bottom line) as a function of the applied subglottal pressure PS are given for the three larynges (columns) and three different adduction levels (MP10, MP50, and MP100).
Global parameters: Direct current (DC) airflow (liquid column manometer) and SPL were measured. Fundamental frequencies (f0) of the vocal fold oscillations were computed on the basis of the high-speed video data. The laryngeal flow resistance was determined using the definitions of van den Berg (RB)41,42 and Alipour (RA)30,32 and colleagues. Whereas RB is equal to the ratio between the transglottal pressure difference and the mean glottal flow rate, Alipour and colleagues proposed the flow resistance RA as a derivative of the subglottal pressure with respect to the mean flow rate. In the context of vocal fold adduction, different studies reported similar systematic results for both definitions of glottal flow resistance, i.e., increased glottal adduction resulted in increased flow resistance.30,32 However, when investigating the impact of the ventricular folds, different behaviors for RA and RB were reported: Whereas Alipour et al.40 found increased flow resistance RA in the presence of the ventricular folds compared with configurations without ventricular vocal folds, Zhang et al.43 reported a decrease of glottal flow resistance RB. In a later study, Zheng et al.42 showed that these different findings, for small flow rates, result from the different definitions of RA and RB.
Local parameters were determined on the basis of the high-speed video data. The three local parameters, maximal lateral and vertical displacements and the maximal velocity, were computed over all sutures. Here, displacement means the actual distance moved by the sutures in the corresponding direction. Displacements in the longitudinal direction of the vocal folds were not considered, since they are in the range of random noise and therefore have been shown to be negligible.25 The mucosal wave propagation from inferior to superior was investigated and will be shown along the vertical suture row r3; sutures are highlighted by o in Fig. 2. For assessing mucosal wave propagation along the medial surface, phase delays in degrees (0°–360°) for reaching minimal lateral displacement values (i.e., time step when the suture is closest to the glass plate) were computed between the lowest suture (l1) and the suture at the vocal fold edge (l5) covering a vertical distance of approximately 8 mm; distance is indicated by the white arrow aside suture row r3 in Fig. 2. The higher the degree values, the longer the time delay and the slower the mucosal wave propagation along the medial surface (i.e., from suture l1 to suture l5). For computing the mucosal phase delay, we concentrated on the medially positioned vertical suture row r3 where the dynamics are most distinctive.17,44 Considering only one vertical suture row (i.e., r3) is also justified by previous work that had shown that along the medial surface only a negligible anterior-posterior mucosal wave phase delay of the lateral dynamics is present (i.e., straight wavefront).17
EEFs: Because of the large amount of data, EEF analysis and visualization over the three different adduction levels will be restricted to high PS values with equal airflow (see Table III) where the dynamics are most distinct. For presenting the EEFs, the vertical row r3 (Fig. 2) is chosen where dynamics were found to be largest.24 Also, as seen before, the EEF geometry and shape are qualitatively similar along vertical suture rows.25 Further, only EEFs with at least 10% of the total energy were analyzed, resulting in up to three EEFs (EEF1, EEF2, and EEF3) per single test case. The evaluation contains the angle of the moving direction and the absolute displacement of each suture in addition to the shape and the relative energy captured by each EEF.
TABLE III.
Applied subglottal pressure values PS for each adduction level (MP10, MP50, and MP100) over all larynges (L1, L2, and L3) for the shown mucosal wave phase delay (Fig. 7), trajectories (Fig. 8), and EEFs (Figs. 9–11).
| Adduction level (g) | L1 - PS (kPa) | L2 - PS (kPa) | L3 - PS (kPa) |
|---|---|---|---|
| MP10 | 2.36 | 2.29 | 2.48 |
| MP50 | 3.90 | 2.61 | 2.20 |
| MP100 | 4.30 | 2.89 | 2.17 |
| Airflow (ml/s) | 1500 | 1000 | 1500 |
III. RESULTS
Parameter changes due to increased adduction are presented in this section. As mentioned previously, the subglottal pressure PS was chosen as the control parameter in the experiments.
Global parameters (Fig. 3): The subglottal pressure PS for sustained phonation varied between 0.97 and 4.30 kPa, corresponding to flow rates between 500 and 1800 ml/s. The relationship between PS and airflow was linear for all three larynges. None of the three larynges exhibited full glottal closure, i.e., minimal glottal diameter varied between 0.8 and 1.6 mm. With increasing adduction, larynges L1 and L2 show the same qualitative behavior: At equal PS, the flow rate decreases with increasing adduction level (compare the blue-diamonds, red-squares, and green-triangle curves). In contrast, for larynx L3 the flow rate rises with increasing adduction level, which is opposite the behavior observed in larynges L1 and L2.
Fundamental frequency was found to be in the range of 97–200 Hz, which begins in the physiological range and ends with fundamental frequencies slightly higher than normal male phonation.33 For seven out of nine test cases, the fundamental frequency increases linearly with increasing PS, except for two of the series for L1 (MP10 and MP50). No systematic influence of increasing adduction on f0 can be detected for larynges L1 and L2. However, for larynx L3, f0 tends to decrease at higher adduction levels.
The SPL ranged between 78.0 and 98.8 dB. It increased almost linearly with increasing PS for all three larynges. Concerning the increasing adduction force, no systematic effects for SPL are observable. The SPL curves are quasi-superposed for all three adduction levels.
The devolution for glottal flow resistance as a function of the subglottal pressure and the adduction level is displayed in Fig. 4 showing RB and in Fig. 5 showing RA.
FIG. 4.
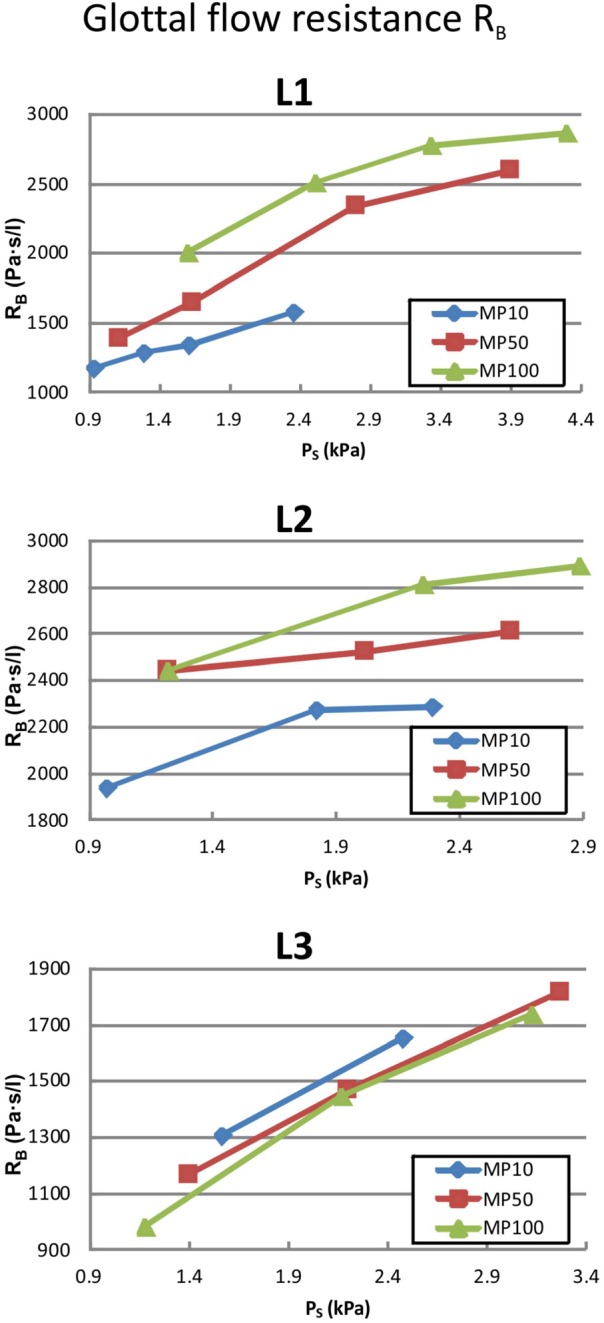
(Color online) The glottal flow resistance RB defined by van den Berg et al. (Ref. 41) as a function of the applied subglottal pressure PS are given for the three larynges and three different adduction levels (MP10, MP50, and MP100).
FIG. 5.
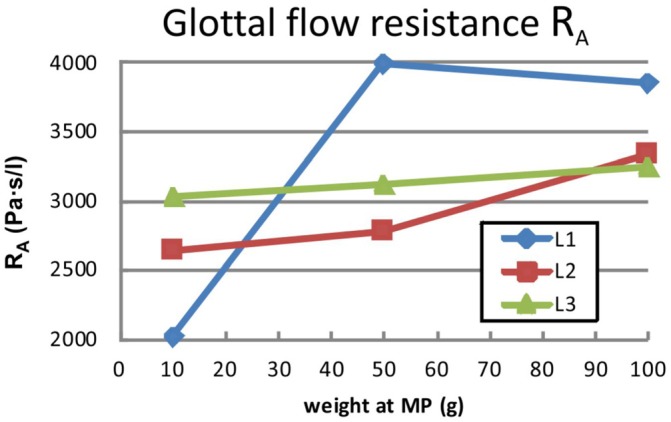
(Color online) The glottal flow resistances RA defined by Alipour et al. (Ref. 30) as a function of the three different adduction levels (MP10, MP50, and MP100) and three larynges are given.
According to the definition by van den Berg et al.,41 the flow resistance RB increases with an increase in subglottal pressure PS. Additionally, for larynges L1 and L2, the resistance also increases with an increase in adduction level. In contrast, for L3, RB shows the opposite behavior and decreases with rising adduction level. The absolute values of RB are found to be smaller for L3 than L1 and L2. Because of the linear dependence that exists between flow rate and subglottal pressure, the flow resistance RA for a given adduction level is represented by one value. As Fig. 5 shows, the basic trend of RA is equal to the trend of RB for larynges L1 and L2, Fig. 4, i.e., flow resistance increases with adduction. However, for larynx L3, RA also rises for increasing adduction levels in contrast to RB. The absolute values of RB are found to be smaller than the RA values for all three larynges.
In summary, for global parameters, L1 and L2 show similar basic behavior, whereas L3 responds differently, especially with increasing adduction levels.
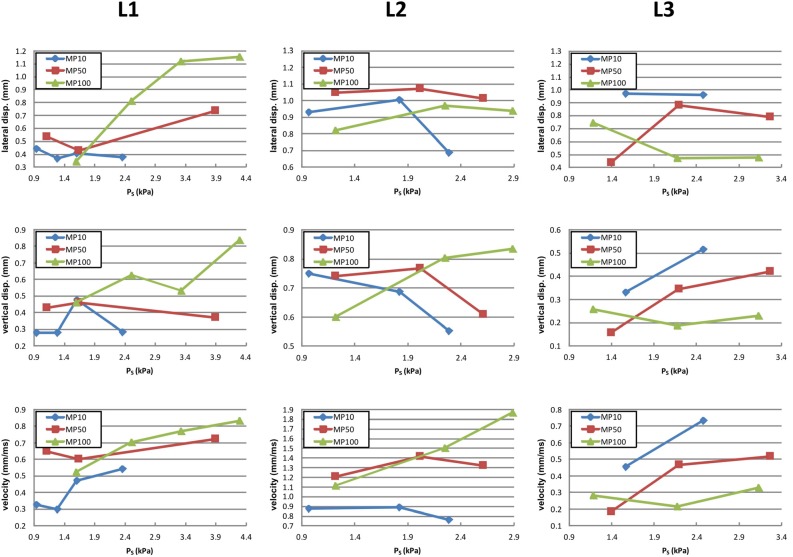
Local parameters are given in Fig. 6. For all three larynges, the lateral (up to 1.2 mm) and vertical displacements (up to 0.85 mm), and the absolute velocities (0.2–1.9 mm/ms) are in physiological ranges. L3 shows the smallest vertical displacements. L2 exhibits the largest velocities by a factor of two compared with L1 and L3.
FIG. 6.
(Color online) The local variables lateral displacements (top row), vertical displacements (middle row), and velocities (bottom row) as a function of the applied subglottal pressure PS are given for the three larynges (columns) and three different adduction levels (MP10, MP50, and MP100).
For all three larynges, the lateral displacement is more dominant than the vertical component. In the case of L3, the lateral motion is much more pronounced compared to larynges L1 and L2. This can be shown by computing the ratio between lateral and vertical displacements, which is higher for L3 (1.9 ≤ lateral/vertical ≤ 2.9) than for L1 (0.8 ≤ lateral/vertical ≤ 2.1) and L2 (1.2 ≤ lateral/vertical ≤ 1.7).
For all three larynges, no systematic trend for lateral and vertical displacements as a function of PS could be found. However, velocity tends to increase with increase in PS.
For increasing adduction, the basic trend of local parameters is similar for larynges L1 and L2. The displacements in both directions and the velocity tend to increase with the rising adduction level, especially for high PS values. Again, L3 shows the opposite behavior: the higher the adduction, the smaller the dynamic values, i.e., maximum amplitudes and velocities are always found at the lowest adduction level MP10.
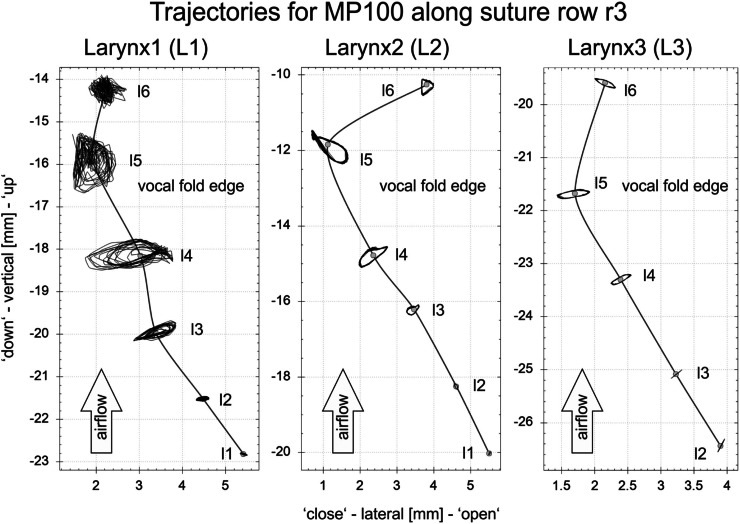
For each larynx, the dynamic phase delay of the mucosal wave propagation along suture row r3 (between l1 and l5, see Fig. 2) along the medial surface is given as a function of the adduction level, see Fig. 7. The corresponding PS and airflow are given in Table III. For L1 and L2, the phase delay increases at higher adduction levels, reflecting a decrease in the propagation velocity of the mucosal wave. In contrast, for L3, the phase delay remains almost constant at around 170°, corresponding to an unchanging wave propagation velocity at different adduction levels. The corresponding trajectories for the adduction level MP100 along suture row r3 are given in Fig. 8. Larynges L2 and L3 show almost perfect periodicity, whereas the trajectories for L1 are more perturbed. Finally, L3 exhibits almost exclusively lateral motion, in contrast to L1 and L2, both of which also have a significant vertical component.
FIG. 7.
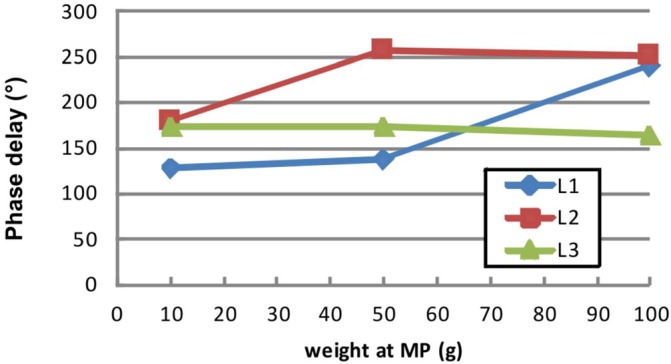
(Color online) The phase delay of the mucosal wave propagation along the medial surface are shown for high PS values (see Table III) at three different adduction levels for the three larynges.
FIG. 8.
The trajectories along the middle suture row (r3) for all three larynges are given for the adduction level MP100. Corresponding PS values as given in Table III. For L3, suture l1 showed only noisy behavior and was therefore excluded for analysis. Trajectories represent the motion of the complete analyzed 110 ms interval (L1: 18 cycles; L2: 22 cycles, L3: 15 cycles).
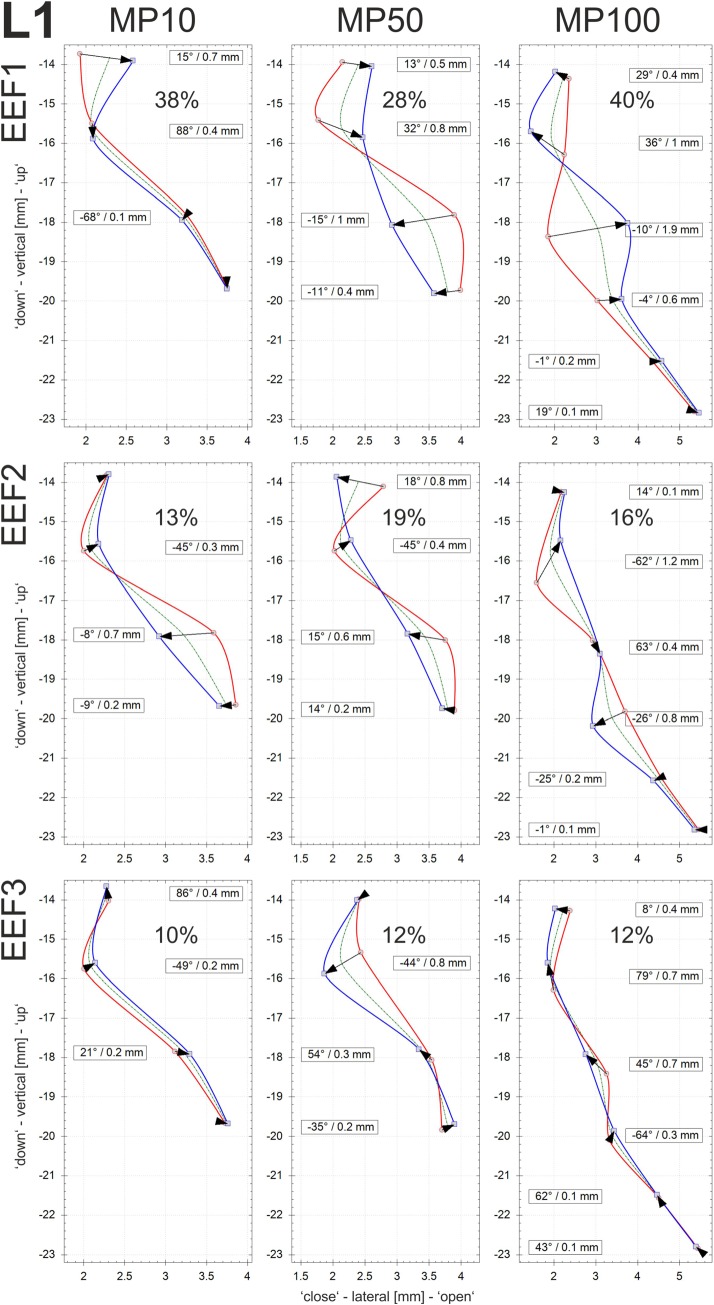
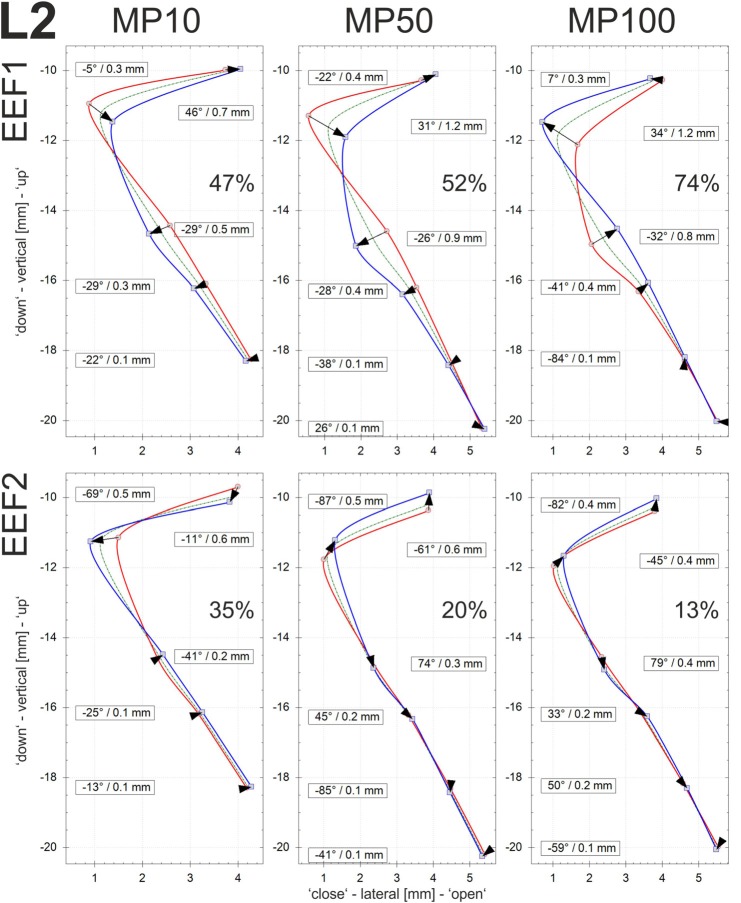
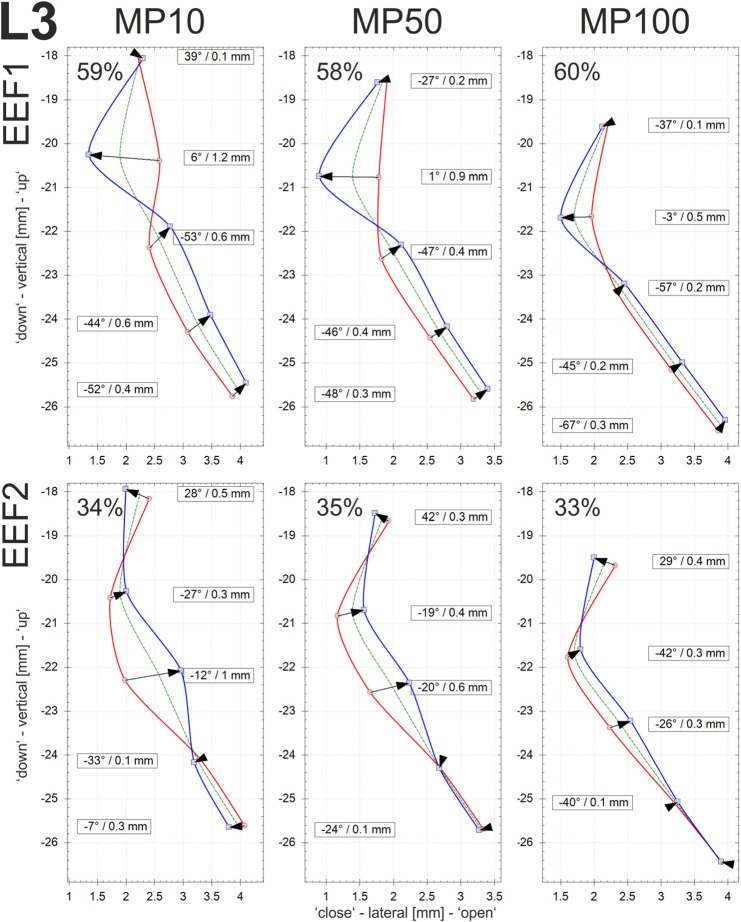
EEFs: The EEFs of the vocal fold dynamics were determined for the three different adduction levels (MP10, MP50, and MP100). The calculations were performed on the basis of the displacements of sutures in the centrally located vertical row r3; see Fig. 2. In Figs. 9, 10, and 11, the EEFs for larynges L1, L2m and L3, respectively, are displayed. The EEFs correspond to the test cases with PS values as given in Table III, i.e., high PS with equal airflow. Furthermore, only EEFs with an energy level of more than 10% of the entire dynamic energy are discussed. According to Fig. 8, the flow direction is upwardly directed. The glass plate of the setup is located upright at position zero of the x axis.
FIG. 9.
(Color online) Larynx1: The three largest eigenfunctions for each of the three adduction levels (MP10, MP50, and MP100) are given along the middle suture row (r3). The PS values (see Table III) are raised for increasing adduction at equal airflow. For MP10 and MP50 only sutures l3 (bottom)–l6 (top) are given, due to the very small displacements at l1 and l2.
FIG. 10.
(Color online) Larynx2: The two largest eigenfunctions for each of the three adduction levels (MP10, MP50, and MP100) are given along the middle suture row (r3). The PS values (see Table III) are raised for increasing adduction at equal airflow. For MP10 only sutures l2 (bottom)–l6 (top) are given, due to the very small displacements at l1.
FIG. 11.
(Color online) Larynx3: The two largest eigenfunctions for each of the three adduction levels (MP10, MP50, and MP100) are given along the middle suture row (r3). The PS values (see Table III) decreased for increasing adduction at equal airflow. Only sutures l2 (bottom)–l6 (top) are given, due to the very small displacements at l1.
Figures 9, 10, and 11 are composed as follows: the mean vocal fold surface position (Offset: dashed green line), the minimal displacement (Min curves: solid red line connecting the arrow tails), the maximal displacement (Max curves: solid blue line connecting the arrowheads), and the displacement vector of the EEF (black arrows) at the corresponding sutures. The contour of the vocal fold surface between the sutures is interpolated by cubic B-splines, since these functions tend to minimize the curvature and are therefore appropriate for interpolating tissue surfaces.45 Furthermore, the numerical values of the angle and the length of the displacement vector are depicted for each suture having displacements of more than 0.1 mm.
The displacement of a suture is defined by the length of displacement and the angle of the moving direction, with 0° representing horizontal motion. Thus, angles with large absolute degree values reflect a high vertical component in the EEF. The higher the absolute degree value, the larger the vertical component. The angles determine the spatial shape of the EEF and its contribution to the entire dynamics. Higher absolute degree values reflect an alternating divergent-convergent shape and dynamics of the medial surface. Angles close to zero are approximately orthogonal to the glass plate, which indicates that these dynamics primarily govern the lateral movement of the vocal fold, which is responsible for modulating the glottal airflow and producing the acoustic signal.24 The signs of the angles reflect movement in a particular coordinate system (“+” in the second and fourth quadrants; “-” in the first and third quadrants). The amount of energy governed by a given EEF (in %) reflects the percentage of the total energy represented by this EEF. For all three larynges, the vocal fold edge is near the second highest suture, where the offset curve exhibits a location closest to the glass plate.
EEF1: The largest eigenfunction (EEF1) is given in the first row in Figs. 9, 10, and 11 corresponding to larynges L1, L2, and L3, respectively. For all three larynges, it shows qualitatively the same behavior. The vocal fold dynamics exhibit a distinctive convergent-divergent shape change of the glottal duct during motion between maximum and minimum positions. This is characterized by the Fig. 8-shape of the area enclosed by the Max and Min curves of EEF1. Thereby, the Min (connecting arrow tails) and Max (connecting arrowheads) curves cross each other slightly below the vocal fold edge near the second highest suture.
Concerning the direction of motion in EEF1, L1 and L2 show significantly higher vertical components than L3, represented by higher absolute values of the angle of the displacement vector, especially near the vocal fold edge. The energy level within EEF1 differs between the three larynges: whereas for L2 (47%–74%) and L3 (58%–60%) the energy level is fairly high, the energy level for L1 (28%–40%) is significantly lower in EEF1.
For increasing adduction levels accompanied with increasing PS for equal airflow, the Fig. 8-shape of the enclosed area in EEF1 becomes more developed for L1 and L2, i.e., the lateral displacement components clearly increase. In contrast, for L3, the lateral components become smaller with increasing adduction levels, i.e., the Fig. 8-shape becomes more compressed.
EEF2: The energy levels of EEF2 are much lower for L1 and L2 (≤20%, with one exception) than for L3 (≥33%). For L1 and L2, the vertical components are fairly high, being in the same range as or even larger than for EEF1. For L3, EEF2 is characterized by predominantly lateral displacement, which is again in contrast to L1 and L2.
For increasing adduction level, the absolute displacements in all suture positions decrease for L2 and L3. Furthermore, for L2, an energy shift from EEF2 (35% → 13%) to EEF1 (47% → 74%) occurs whereas the energy levels of EFF1 (≈59%) and EEF2 (≈34%) for L3 remain constant. For larynx L1, no systematic trend concerning EFF2 could be established.
EEF3: Only for L1 does EEF3 contain more than 10% of the entire dynamic energy, Fig. 9. Comparable to the EEFs accounting for more variance, it exhibits vertical and lateral components. With an increase in the adduction level, the energy percentage increases slightly from 10% to 12%, which is also visible in slightly increased displacement values (0.2 mm → 0.7 mm).
The distribution of the entire energy captured by EEFs with more than 2% is reflected in the trajectories given in Fig. 8. The least periodicity (L1) is reflected by a low energy portion of the two largest EEFs, between 47% and 56%. In contrast, L2 reaches 72%–87% of the entire energy in the two largest EEFs; as a result, the trajectories are much more periodic. L3 shows the highest periodicity, being reflected in energy levels of 93% in the two largest EEFs.
IV. DISCUSSION
Global parameters: First, it should be mentioned that basic phonatory relations were reproduced. An increase in subglottal pressure resulted in an increase in the fundamental frequency, as demonstrated by Alipour et al.30,46,47 and Jiang and Titze.18 Furthermore, higher airflow, f0, and SPL were found with increasing PS values.39
Based on a preliminary, single ex-vivo hemilarynx study, Döllinger & Berry24 hypothesized that subglottal pressure and flow rate were not significantly influenced by increasing (posterior) vocal fold adduction (levels at 10, 20, and 50 g). However, the present study of three human excised larynges with a larger range of applied adduction forces (10, 50, 100 g) showed a large impact. In fact, for larynges L1 and L2, the results yielded a decrease in flow rate at equal subglottal pressure for increasing adduction level (Fig. 3). This relationship is consistent with results presented by Alipour and colleagues,30,32 who performed experiments with excised animal larynges in a full larynx setup. The effect is caused by an increase in the glottal flow resistance computed as RB (Fig. 4), and also RA (Fig. 5). From an aerodynamic point of view, a high degree of adduction causes a high flow resistance and therefore a high energy transfer from the glottal flow to the vocal fold tissues. This yields a large transglottal pressure drop. As a consequence, high subglottal pressures can be generated at relatively low flow rates for L1 and L2 (compare Fig. 3). Considering the limited lung volume for glottal flow generation, a high adduction level is desirable for effective and economic phonation.
In contrast, the results for larynx L3 show the opposite behavior. On increasing the adduction level, the flow resistance RB tends to decrease, as shown in Fig. 4. Thus, at equal subglottal pressure, the glottal flow rate rises for larger adduction levels, as displayed in Fig. 3, which reduces the efficiency of the phonation process. Considering the glottal flow resistance RA based on Alipour et al.,30 it also shows a slightly increasing tendency for rising adduction levels. However, as RA is defined as a derivative of the subglottal flow with respect to the flow rate, flow resistance generated by non-vibrating vocal folds (absolute prephonatory resistance offset) in the low subglottal pressure range is not taken into account by RA. Therefore, the authors suggest that RB might better describe the relationship between subglottal pressure and flow rate.
Although the adduction has a large impact on the flow-pressure relationship, its influence on the fundamental frequency and the generated SPL is negligible and non-systematic. Similar findings for SPL were presented by Alipour et al.28 However, on performing a spectral analysis of the generated sound, they found an enhancement of the sound intensity of higher harmonics, especially the second harmonic. This spectral analysis was not possible with our acoustic data due to the high ambient noise level.48
Local parameters: Displacement and velocity values (Fig. 6) are in similar ranges to earlier ex-vivo17,18 and in-vivo canine19 hemilarynx studies, in-vivo human investigations,12 and synthetic models.22 The displacement ratios (lateral/vertical amplitudes) for L1 and L2 are up to 2.1, as seen in other studies.25 In contrast, for L3 (where the ratio is up to 2.9), lateral components are much more pronounced. Similar to Boessenecker et al.,17 an increase in subglottal pressure resulted in increased vocal fold velocities. In contrast to assumptions by Boessenecker et al.,17 vocal fold adduction forces appear to influence the absolute values of vocal fold displacements and velocities, especially at high PS. For L1 and L2 the dynamical amplitudes increase, whereas for L3 the dynamic amplitudes decrease. This behavior of L3 might be related to increased tissue stiffness induced by the applied adduction forces,25 or just greater than normal overall (vertical) stiffness of the vocal tissue in principle.
For assessing mucosal wave propagation, phase delays in the range of 129° to 257° were found between the vocal fold edge (l5) and the most inferior suture l1 (approx. 8 mm below l5). Hence, the phase delays correspond to values of 16°/mm to 32°/mm. Similarly high lateral phase delays were found at ≈182° (equals 23°/mm) before.17 Even higher phase delays were reported for canines, see Table I in Titze et al.49 They computed phase delays between 24°/mm and 61°/mm where the phase delay was determined over a distance of 2 mm around the vocal fold edge in ex-vivo canine models. Also, for an in-vivo canine model,37 phase delay values between 25°/mm and 59°/mm (equals 101°–234° for a distance of approx. 4 mm) were computed when converting their values (Table V) to ours. Additionally, phase delay values reported in our study coincide with values found for synthetic (24°/mm–30°/mm)22 and computational (8°/mm–32°/mm)50 multi-layer models of human vocal folds. In summary, our computed phase delay values are in the lower region of canines and match previous results for excised humans, synthetic, and computational models. It has to be mentioned that there are also studies reporting mucosal wave phase delays below 100°.51 However, the actual and exact positions and distances where these values were obtained were not given.
EEFs: Several previous studies have shown that the primary power of the method of EEFs is derived from its data reduction capability (e.g., it is equivalent to principal components analysis in statistics). That is, by reducing complex vibratory motion to essential dynamics, fundamental laryngeal vibration patterns are often revealed.19,24,52,53 For example, previously the method of empirical functions demonstrated physical mechanisms for transferring energy from the glottal airflow to the vocal fold tissues,5,24,26,52 and for distinguishing aerodynamically and acoustically induced vocal fold vibrations.54
As displayed in Fig. 8, the trajectories of larynges L1 and L2 exhibit superposed vertical and lateral motion during vibration. Decomposing the oscillatory motion, the two largest EEFs of L1 and L2 describe a balanced vertical-lateral oscillation (Figs. 9 and 10) whose amplitudes increase with increasing adduction. This is accompanied by increased PS for equal airflow rates. Qualitatively, the characteristics of the increasing vertical-lateral motion are described by stronger prominence of the Fig. 8-shape of EEF1, defined by the Min and Max amplitude contours as also reported previously.25,52
For larynx L1, the vertical-lateral balanced vibration is a result of the superposition of EEF1 and EEF2 for all three adduction levels. An increasing adduction level for constant airflow (whereby PS raises) results in increasing amplitudes in both the lateral and vertical directions, which is most pronounced in the higher range of subglottal pressure, as depicted in Fig. 6. Furthermore, the amplitude increase for L1 becomes apparent in both EEF1 and EEF2, Fig. 9. In contrast, for larynx L2, the balanced vertical-lateral motion is mainly included in EEF1 whereas EEF2 describes mainly the lateral vibratory motion. In this case, the stronger characteristic of a balanced vertical-lateral motion is generated by an energy transfer from EEF2 to EEF1 during the adduction increase. The reason for the differences in the EEFs of L1 and L2 might be the less periodic oscillation of L1, which results in a homogeneous energy distribution in EEF1 and EEF2. However, this aperiodicity in the case of L1 did not influence the efficiency of the fluid-structure interaction between the glottal flow and the vocal fold tissues because the flow-pressure relationships for L1 and L2 are systematically equivalent.
In comparison with L1 and L2, EEF1 and EEF2 of larynx L3 exhibit primarily lateral vibrational components. This is most obvious when comparing the diagrams of vertical and lateral amplitudes in Fig. 6. For both of the EEFs, the amplitudes decrease at constant airflow with increasing adduction and decreasing PS, reflecting the decreasing energy transfer from the glottal flow to the vocal fold tissues.
Hence the authors suggest that an effective energy transfer might be favored by a balanced vertical-lateral oscillation pattern which produces the distinctive convergent-divergent shape change in the glottal duct.26,55,56 Furthermore, this seems to be valid also in cases of slightly aperiodic (L1) but still balanced vertical-lateral oscillations of the vocal fold. In cases with an overemphasis of just a single direction of motion (whether lateral or vertical, as seen for L3), the energy transfer might be disturbed, resulting in a low efficiency of the fluid-structure interaction between the airflow and vocal fold tissue. As a result, the effort to sustain phonation may increase significantly.
A. Limitations
Although this study gave additional insights into the phonatory process, especially regarding the medial surface dynamics of the vocal folds, there are several limitations that will need to be considered in future work:
-
(1)
Detailed effects of changed laryngeal control parameters on the acoustic signal (e.g., jitter, shimmer, harmonic-to-noise ratio (HNR), or spectral patterns) as shown elsewhere,28 were not investigated. This is because our experiments were not conducted in a soundproof booth, hence yielding an ambient noise level that was too high to allow further meaningful evaluation of the acoustic signal.48
-
(2)
Due to the challenge of performing ex-vivo hemilarynx experiments and the limited availability of human larynges, only three larynges were investigated. To further substantiate the conclusions drawn here, we suggest that the number of larynges studied be increased to at least ten to allow for statistical analysis. This could be achieved by using ex-vivo animal or synthetic models.
-
(3)
The influence of an increased elongation level was not considered. Further, influences of vocal fold adduction and elongation on aerodynamic parameters, such as phonation onset, as reported for elongation,57 were not investigated.
-
(4)
Owing to the limited number of runs for the different adduction levels, no statistical analysis was possible and only trends could be reported. However, both theoretical and experimental studies suggest possible nonlinear effects, especially for elongation.27 Hence, in future studies, more runs for each stimulation level should be considered.
-
(5)
The current data do not allow the determination of an optimal adduction level for the most effective phonation. Therefore, more adduction levels should be investigated with respect to sound production.
-
(6)
Potential age and gender influences and vocal tract influences were not investigated.
-
(7)
An unavoidable limitation is that left–right asymmetric conditions (as investigated in numerical58–60 and full larynx57 models), realistic vocal fold collision, and realistic subglottal and supraglottal loading could not be simulated using the hemilarynx methodology.
V. CONCLUSION
This study investigated quantitative global and local vocal fold dynamics as a function of vocal fold adduction within a hemilarynx setup with three excised human larynges. Induced effects on the tracheal airflow, the glottal aerodynamics, and the medial vocal fold surface dynamics were visualized by EEF analysis. Despite the incomplete phonatory glottal closure for all three larynges, qualitative and quantitative dynamic characteristics were found similar to previous hemilarynx studies where full glottal closure during phonation was achieved.17,37
For two larynges, the study suggests that, on the one hand, the increase of the adduction level at constant flow rates raises the subglottal pressure PS, Fig. 3 top row, see larynges L1 and L2. On the other hand, by keeping the subglottal pressure constant and increasing the vocal fold adduction, the airflow decreases.
Both interrelations are caused by the increase of the glottal flow resistance (Figs. 4 and 5) due to the reduction of the glottal flow path. The increase of flow resistance generates a larger energy transfer from the airflow to the vocal folds. This energy transfer results in the rise of the dynamic amplitudes of the vocal fold oscillation (Fig. 6). Therefore, at constant excitation (Ps or airflow), higher adduction levels enhance the response of the glottal system (i.e., larger oscillation of the vocal folds) by generating economic and efficient laryngeal conditions.
The analysis of the vocal fold oscillation by EEFs exposed a balanced vertical-lateral oscillation pattern producing the characteristic convergent-divergent shape change of the glottal duct. This oscillatory pattern tended to become stronger by enhancing the adduction level. Hence, we suggest that, depending on the excitation strength, the adduction control during phonation maintains a balanced lateral-vertical oscillation pattern.
Furthermore, the results indicate that the balanced lateral-vertical oscillatory pattern of the vocal folds (although exhibiting less periodicity as seen for L1) might be more important, for yielding an efficient phonation, than a high level of periodicity of the oscillations with unbalanced oscillatory pattern, as seen for L3. It is hypothesized that certain muscle dysfunctions (e.g., muscle tension dysphonia or vocal hyperfunction) might generate overly-dominant lateral oscillations. Owing to the unbalanced vertical-lateral oscillation pattern, the energy transfer between glottal flow and the vocal folds might be disturbed resulting in the decay of the oscillation amplitudes for increasing adduction levels. Future work could further explore this hypothesis.
Finally, in subsequent work, it may also be useful and informative to study the corresponding acoustic signal. For example, different adduction levels might be more suitable for certain subglottal pressure levels by facilitating the dynamic phonatory process and resulting in a stronger acoustic signal. The analysis of the acoustic signal could assist in the analysis of this hypothesis.
ACKNOWLEDGMENTS
Dr. D. A. Berry's support on this project was funded by NIH/NIDCD Grant No. R01 DC013323. Dr. M. Döllinger's support on this work was enabled by DFG Grant No. 1247/6-1. We would also like to thank Dr. med. Maximilian Thumm for his help in data pre-processing and Dipl. Technomath. Denis Dubrovskiy for developing the image processing and analysis software Voice Analysis.
References
- 1. Titze I. R., in The Myoelastic Aerodynamic Theory of Phonation, edited by Klemuk S. ( National Center for Voice and Speech, Iowa City, IA, 2006), pp. 1–424. [Google Scholar]
- 2. Deliyski D. D. and Hillman R. E., “ State of the art laryngeal imaging: Research and clinical implications,” Curr. Opin. Otolaryngol. Head Neck Surg. 18(3), 147–152 (2010). 10.1097/MOO.0b013e3283395dd4 [DOI] [PMC free article] [PubMed] [Google Scholar]
- 3. Döllinger M., Kobler J., Berry D. A., Mehta D. D., Luegmair G., and Bohr C., “ Experiments on analyzing voice production: Excised (human, animal) and in vivo (animal) approaches,” Curr. Bioinform. 6(3), 286–304 (2011). 10.2174/157489311796904673 [DOI] [PMC free article] [PubMed] [Google Scholar]
- 4. Baer T., “ Investigation of phonation using excised larynxes,” Ph.D. dissertation, Massachusetts Institute of Technology, Cambridge, MA, 1975, pp. 1–305. [Google Scholar]
- 5. Berry D. A., Montequin D. W., and Tayama N., “ High-speed digital imaging of the medial surface of the vocal folds,” J. Acoust. Soc. Am. 110(5), 2539–2547 (2001). 10.1121/1.1408947 [DOI] [PubMed] [Google Scholar]
- 6. Krausert C. R., Olszewski A. E., Taylor L. N., McMurray J. S., Dailey S. H., and Jiang J. J., “ Mucosal wave measurement and visualization techniques,” J. Voice 25(4), 395–405 (2011). 10.1016/j.jvoice.2010.02.001 [DOI] [PMC free article] [PubMed] [Google Scholar]
- 7. George N. A., de Mul F. F., Qiu Q., Rakhorst G., and Schutte H. K., “ New laryngoscope for quantitative high-speed imaging of human vocal folds vibration in the horizontal and vertical direction,” J. Biomed. Opt. 13(6), 064024 (2008). 10.1117/1.3041164 [DOI] [PubMed] [Google Scholar]
- 8. Luegmair G., Kniesburges S., Zimmermann M., Sutor A., Eysholdt U., and Döllinger M., “ Optical reconstruction of high-speed surface dynamics in an uncontrollable environment,” IEEE Trans. Med. Imaging 29(12), 1979–1991 (2010). 10.1109/TMI.2010.2055578 [DOI] [PubMed] [Google Scholar]
- 9. Echternach M., Döllinger M., Sundberg J., Traser L., and Richter B., “ Vocal fold vibrations at high soprano fundamental frequencies,” J. Acoust. Soc. Am. 133(2), EL82–EL87 (2013). 10.1121/1.4773200 [DOI] [PubMed] [Google Scholar]
- 10. Li L., Zhang Y., Maytag A. L., and Jiang J. J., “ Quantitative study for the surface dehydration of vocal folds based on high-speed imaging,” J. Voice 29(4), 403–409 (2015). 10.1016/j.jvoice.2014.09.025 [DOI] [PubMed] [Google Scholar]
- 11. Chen G., Kreiman J., and Alwan A., “ The glottaltopogram: A method of analyzing high-speed images of the vocal folds,” Comput. Speech Lang. 28(5), 1156–1169 (2014). 10.1016/j.csl.2013.11.006 [DOI] [PMC free article] [PubMed] [Google Scholar]
- 12. Chan A., Mongeau L., and Kost K., “ Vocal fold vibration measurements using laser Doppler vibrometry,” J. Acoust. Soc. Am. 133(3), 1667–1676 (2013). 10.1121/1.4789937 [DOI] [PMC free article] [PubMed] [Google Scholar]
- 13. Chen G., Kreiman J., Gerratt B. R., Neubauer J., Shue Y.-L., and Alwan A., “ Development of a glottal area index that integrates glottal gap size and open quotient,” J. Acoust. Soc. Am. 133(3), 1656–1666 (2013). 10.1121/1.4789931 [DOI] [PMC free article] [PubMed] [Google Scholar]
- 14. Luegmair G., Mehta D., Kobler J., and Doellinger M., “ Three-dimensional optical reconstruction of vocal fold kinematics using high-speed video with a laser projection system,” IEEE Trans. Med. Imaging 34(12), 2572–2582 (2015). 10.1109/TMI.2015.2445921 [DOI] [PMC free article] [PubMed] [Google Scholar]
- 15. Sommer D. E., Tokuda I. T., Peterson S. D., Sakakibara K.-I., Imagawa H., Yamauchi A., Nito T., Yamasoba T., and Tayama N., “ Estimation of inferior-superior vocal fold kinematics from high-speed stereo endoscopic data in vivo,” J. Acoust. Soc. Am. 136(6), 3290–3300 (2014). 10.1121/1.4900572 [DOI] [PubMed] [Google Scholar]
- 16. Khosla S., Oren L., Ying J., and Gutmark E., “ Direct simultaneous measurement of intraglottal geometry and velocity fields in excised larynges,” Laryngoscope 124(2), S1–S13 (2014). 10.1002/lary.24512 [DOI] [PubMed] [Google Scholar]
- 17. Boessenecker A., Berry D. A., Lohscheller J., Eysholdt U., and Döllinger M., “ Mucosal wave properties of a human vocal fold,” Acta Acust. Acust. 93(9), 815–823 (2007). [Google Scholar]
- 18. Jiang J. J. and Titze I. R., “ A methodological study of hemilaryngeal phonation,” Laryngoscope 103(8), 872–882 (1993). 10.1288/00005537-199308000-00008 [DOI] [PubMed] [Google Scholar]
- 19. Döllinger M., Berry D. A., and Berke G. S., “ Medial surface dynamics of an in vivo canine vocal fold during phonation,” J. Acoust. Soc. Am. 117(5), 3174–3183 (2005). 10.1121/1.1871772 [DOI] [PubMed] [Google Scholar]
- 20. Zhang Z., “ Vibration in a self-oscillating vocal fold model with left-right asymmetry in body-layer stiffness,” J. Acoust. Soc. Am. 128(5), EL279–EL285 (2010). 10.1121/1.3492798 [DOI] [PMC free article] [PubMed] [Google Scholar]
- 21. Murray P. R., Thomson S. L., and Smith M. E., “ A synthetic, self-oscillating vocal fold model platform for studying augmentation injection,” J. Voice 28(2), 133–143 (2014). 10.1016/j.jvoice.2013.10.014 [DOI] [PMC free article] [PubMed] [Google Scholar]
- 22. Murray P. R. and Thomson S. L., “ Vibratory responses of synthetic, self-oscillating vocal fold models,” J. Acoust. Soc. Am. 132(5), 3428–3438 (2012). 10.1121/1.4754551 [DOI] [PMC free article] [PubMed] [Google Scholar]
- 23. Döllinger M. and Berry D. A., “ Computation of the three-dimensional medial surface dynamics of the vocal folds,” J. Biomech. 39(2), 369–374 (2006). 10.1016/j.jbiomech.2004.11.026 [DOI] [PubMed] [Google Scholar]
- 24. Döllinger M. and Berry D. A., “ Visualization and quantification of the medial surface dynamics of an excised human vocal fold during phonation,” J. Voice 20(3), 401–413 (2006). 10.1016/j.jvoice.2005.08.003 [DOI] [PubMed] [Google Scholar]
- 25. Döllinger M., Tayama N., and Berry D. A., “ Empirical eigenfunctions and medial surface dynamics of a human vocal fold,” Methods Inf. Med. 44(3), 384–391 (2005). [PubMed] [Google Scholar]
- 26. Thomson S. L., Mongeau L., and Frankel S. H., “ Aerodynamic transfer of energy to the vocal folds,” J. Acoust. Soc. Am. 118(3), 1689–1700 (2005). 10.1121/1.2000787 [DOI] [PubMed] [Google Scholar]
- 27. Zhang Y., Regner M. F., and Jiang J. J., “ Theoretical modeling and experimental high-speed imaging of elongated vocal folds,” IEEE Trans. Biomed. Eng. 58(10), 2725–2731 (2011). 10.1109/TBME.2010.2095012 [DOI] [PMC free article] [PubMed] [Google Scholar]
- 28. Alipour F., Scherer R. C., and Finnegan E., “ Measures of spectral slope using an excised larynx model,” J. Voice 26(4), 403–411 (2012). 10.1016/j.jvoice.2011.07.002 [DOI] [PMC free article] [PubMed] [Google Scholar]
- 29. Regner M. F., Tao C., Ying D., Olszewski A., Zhang Y., and Jiang J. J., “ The effect of vocal fold adduction on the acoustic quality of phonation: Ex vivo investigations,” J. Voice 26(6), 698–705 (2012). 10.1016/j.jvoice.2011.09.012 [DOI] [PMC free article] [PubMed] [Google Scholar]
- 30. Alipour F., Scherer R. C., and Finnegan E., “ Pressure-flow relationships during phonation as a function of adduction,” J. Voice 11(2), 187–194 (1997). 10.1016/S0892-1997(97)80077-X [DOI] [PubMed] [Google Scholar]
- 31. Alipour F. and Scherer R. C., “ On pressure-frequency relations in the excised larynx,” J. Acoust. Soc. Am. 122, 2296–2305 (2007). 10.1121/1.2772230 [DOI] [PubMed] [Google Scholar]
- 32. Alipour F., Finnegan E. M., and Scherer R. C., “ Aerodynamic and acoustic effects of abrupt frequency changes in excised larynges,” J. Speech Lang. Hear. Res. 52(2), 465–481 (2009). 10.1044/1092-4388(2008/07-0212) [DOI] [PMC free article] [PubMed] [Google Scholar]
- 33. Kniesburges S., Thomson S. L., Barney A., Triep M., Sidlof P., Horacek J., Brücker C., and Becker S., “ In vitro experimental investigation of voice production,” Curr. Bioinform. 6(3), 305–322 (2011). 10.2174/157489311796904637 [DOI] [PMC free article] [PubMed] [Google Scholar]
- 34. Zheng X., Mittal R., Xue Q., and Bielamowicz S., “ Direct-numerical simulation of the glottal jet and vocal-fold dynamics in a three-dimensional laryngeal model,” J. Acoust. Soc. Am. 130(1), 404–415 (2011). 10.1121/1.3592216 [DOI] [PMC free article] [PubMed] [Google Scholar]
- 35. Yang A., Berry D. A., Kaltenbacher M., and Döllinger M., “ Three-dimensional biomechanical properties of human vocal folds: Parameter optimization of a numerical model to match in vitro dynamics,” J. Acoust. Soc. Am. 131(2), 1378–1390 (2012). 10.1121/1.3676622 [DOI] [PMC free article] [PubMed] [Google Scholar]
- 36. Xue Q., Zheng X., Mittal R., and Bielamowicz S., “ Subject-specific computational modeling of human phonation,” J. Acoust. Soc. Am. 135(3), 1445–1456 (2014). 10.1121/1.4864479 [DOI] [PMC free article] [PubMed] [Google Scholar]
- 37. Döllinger M., Berry D. A., and Berke G. S., “ A quantitative study of the medial surface dynamics of an in vivo canine vocal fold during phonation,” Laryngoscope 115(9), 1646–1654 (2005). 10.1097/01.mlg.0000175068.25914.61 [DOI] [PubMed] [Google Scholar]
- 38. Döllinger M., Berry D. A., and Montequin D. W., “ The influence of epilarynx area on vocal fold dynamics,” Otolaryngol. Head. Neck. Surg. 135(5), 724–729 (2006). 10.1016/j.otohns.2006.04.007 [DOI] [PubMed] [Google Scholar]
- 39. Döllinger M., Berry D. A., Luegmair G., Hüttner B., and Bohr C., “ Effects of the epilarynx area on vocal fold dynamics and the primary voice signal,” J. Voice 26(3), 285–292 (2012). 10.1016/j.jvoice.2011.04.009 [DOI] [PMC free article] [PubMed] [Google Scholar]
- 40. Alipour F., Jaiswal S., and Finnegan E., “ Aerodynamic and acoustic effects of false vocal folds and epiglottis in excised larynx models,” Ann. Otol. Rhinol. Laryngol. 116(2), 135–144 (2007). 10.1177/000348940711600210 [DOI] [PubMed] [Google Scholar]
- 41. van den Berg J., Zantema J. T., and Doornenbal P., “ On the air resistance and the Bernoulli effect of the human larynx,” J. Acoust. Soc. Am. 29(5), 626–631 (1957). 10.1121/1.1908987 [DOI] [Google Scholar]
- 42. Zheng X., Bielamowicz S., Luo H., and Mittal R., “ A computational study of the effect of false vocal folds on glottal flow and vocal fold vibration during phonation,” Ann. Biomed. Eng. 37(3), 625–641 (2009). 10.1007/s10439-008-9630-9 [DOI] [PMC free article] [PubMed] [Google Scholar]
- 43. Zhang C., Zhao W., Frankel S. H., and Mongeau L., “ Computational aeroacoustics of phonation, part ii: Effects of flow parameters and ventricular folds,” J. Acoust. Soc. Am. 112(5), 2147–2154 (2002). 10.1121/1.1506694 [DOI] [PubMed] [Google Scholar]
- 44. Lohscheller J., Svec J. G., and Döllinger M., “ Vocal fold vibration amplitude, open quotient, speed quotient and their variability along glottal length: Kymographic data from normal subjects,” Logoped. Phoniatr. Vocol. 38(4), 182–192 (2013). 10.3109/14015439.2012.731083 [DOI] [PubMed] [Google Scholar]
- 45. Farin G., Curves and Surfaces for Computer-Aided Geometric Design: A Practical Guide (Computer Science and Scientific Computing) ( Academic Press, San Francisco, CA, 1996), pp. 1–429. [Google Scholar]
- 46. Alipour F., Montequin D., and Tayama N., “ Aerodynamic profiles of a hemilarynx with a vocal tract,” Ann. Otol. Rhinol. Laryngol. 110(6), 550–555 (2001). 10.1177/000348940111000609 [DOI] [PubMed] [Google Scholar]
- 47. Alipour F. and Scherer R. C., “ Dynamic glottal pressures in an excised hemilarynx model,” J. Voice 14(4), 443–454 (2000). 10.1016/S0892-1997(00)80002-8 [DOI] [PubMed] [Google Scholar]
- 48. Rogal M. S., “ Analysis of the acoustic outcome signals in ex-vivo hemilarynx experiments,” Ph.D. thesis, Medical School, University Hospital Erlangen, 2013. [Google Scholar]
- 49. Titze I. R., Jiang J. J., and Hsiao T. Y., “ Measurement of mucosal wave propagation and vertical phase difference in vocal fold vibration,” Ann. Otol. Rhinol. Laryngol. 102(1), 58–63 (1993). 10.1177/000348949310200111 [DOI] [PubMed] [Google Scholar]
- 50. Pickup B. A. and Thomson S. L., “ Identification of geometric parameters influencing the flow-induced vibration of a two-layer self-oscillating computational vocal fold model,” J. Acoust. Soc. Am. 129(4), 2121–2132 (2011). 10.1121/1.3557046 [DOI] [PMC free article] [PubMed] [Google Scholar]
- 51. Jiang J. J., Zhang Y., Kelly M. P., Bieging E. T., and Hoffman M. R., “ An automatic method to quantify mucosal waves via videokymography,” Laryngoscope 118(8), 1504–1510 (2008). 10.1097/MLG.0b013e318177096f [DOI] [PMC free article] [PubMed] [Google Scholar]
- 52. Berry D. A., Herzel H., Titze I. R., and Krischer K., “ Interpretation of biomechanical simulations of normal and chaotic vocal fold vibrations with empirical eigenfunctions,” J. Acoust. Soc. Am. 95(6), 3595–3604 (1994). 10.1121/1.409875 [DOI] [PubMed] [Google Scholar]
- 53. Berry D. A., Clark M. J. O., Montequin D. W., and Titze I. R., “ Characterization of the medial surface of the vocal folds,” Ann. Otol. Rhinol. Laryngol. 110(5), 470–477 (2001). 10.1177/000348940111000514 [DOI] [PubMed] [Google Scholar]
- 54. Zhang Z., Neubauer J., and Berry D. A., “ Aerodynamically and acoustically driven modes of vibration in a physical model of the vocal folds,” J. Acoust. Soc. Am. 120(5), 2841–2849 (2006). 10.1121/1.2354025 [DOI] [PubMed] [Google Scholar]
- 55. Hirano M., “ Clinical examination of voice,” in Disorders of Human Communication, 1st ed. ( Springer, New York, 1981), Vol. 5. [Google Scholar]
- 56. Oren L., Dembinski D., Gutmark E., and Khosla S., “ Characterization of the vocal fold vertical stiffness in a canine model,” J. Voice 28(3), 297–304 (2014). 10.1016/j.jvoice.2013.11.001 [DOI] [PMC free article] [PubMed] [Google Scholar]
- 57. Devine E. E., Bulleit E. E., Hoffman M. R., McCulloch T. M., and Jiang J. J., “ Aerodynamic and nonlinear dynamic acoustic analysis of tension asymmetry in excised canine larynges,” J. Speech Lang. Hear. Res. 55(6), 1850–1861 (2012). 10.1044/1092-4388(2012/11-0240) [DOI] [PMC free article] [PubMed] [Google Scholar]
- 58. Xue Q., Mittal R., Zheng X., and Bielamowicz S., “ A computational study of the effect of vocal-fold asymmetry on phonation,” J. Acoust. Soc. Am. 128(2), 818–827 (2010). 10.1121/1.3458839 [DOI] [PMC free article] [PubMed] [Google Scholar]
- 59. Xue Q., Mittal R., Zheng X., and Bielamowicz S., “ Computational modeling of phonatory dynamics in a tubular three-dimensional model of the human larynx,” J. Acoust. Soc. Am. 132(3), 1602–1613 (2012). 10.1121/1.4740485 [DOI] [PMC free article] [PubMed] [Google Scholar]
- 60. Xue Q., Zheng X., Mittal R., and Bielamowicz S., “ Computational study of effects of tension imbalance on phonation in a three-dimensional tubular larynx model,” J. Voice 28(4), 411–419 (2014). 10.1016/j.jvoice.2013.12.016 [DOI] [PMC free article] [PubMed] [Google Scholar]


