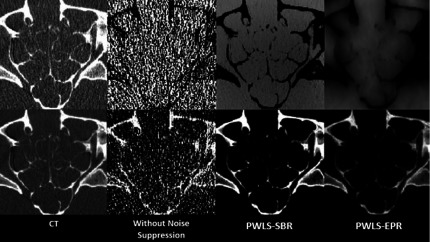
Abstract
Purpose:
Dual-energy CT (DECT) expands applications of CT imaging in its capability to decompose CT images into material images. However, decomposition via direct matrix inversion leads to large noise amplification and limits quantitative use of DECT. Their group has previously developed a noise suppression algorithm via penalized weighted least-square optimization with edge-preservation regularization (PWLS-EPR). In this paper, the authors improve method performance using the same framework of penalized weighted least-square optimization but with similarity-based regularization (PWLS-SBR), which substantially enhances the quality of decomposed images by retaining a more uniform noise power spectrum (NPS).
Methods:
The design of PWLS-SBR is based on the fact that averaging pixels of similar materials gives a low-noise image. For each pixel, the authors calculate the similarity to other pixels in its neighborhood by comparing CT values. Using an empirical Gaussian model, the authors assign high/low similarity value to one neighboring pixel if its CT value is close/far to the CT value of the pixel of interest. These similarity values are organized in matrix form, such that multiplication of the similarity matrix to the image vector reduces image noise. The similarity matrices are calculated on both high- and low-energy CT images and averaged. In PWLS-SBR, the authors include a regularization term to minimize the L-2 norm of the difference between the images without and with noise suppression via similarity matrix multiplication. By using all pixel information of the initial CT images rather than just those lying on or near edges, PWLS-SBR is superior to the previously developed PWLS-EPR, as supported by comparison studies on phantoms and a head-and-neck patient.
Results:
On the line-pair slice of the Catphan©600 phantom, PWLS-SBR outperforms PWLS-EPR and retains spatial resolution of 8 lp/cm, comparable to the original CT images, even at 90% reduction in noise standard deviation (STD). Similar performance on spatial resolution is observed on an anthropomorphic head phantom. In addition, results of PWLS-SBR show substantially improved image quality due to preservation of image NPS. On the Catphan©600 phantom, NPS using PWLS-SBR has a correlation of 93% with that via direct matrix inversion, while the correlation drops to −52% for PWLS-EPR. Electron density measurement studies indicate high accuracy of PWLS-SBR. On seven different materials, the measured electron densities calculated from the decomposed material images using PWLS-SBR have a root-mean-square error (RMSE) of 1.20%, while the results of PWLS-EPR have a RMSE of 2.21%. In the study on a head-and-neck patient, PWLS-SBR is shown to reduce noise STD by a factor of 3 on material images with image qualities comparable to CT images, whereas fine structures are lost in the PWLS-EPR result. Additionally, PWLS-SBR better preserves low contrast on the tissue image.
Conclusions:
The authors propose improvements to the regularization term of an optimization framework which performs iterative image-domain decomposition for DECT with noise suppression. The regularization term avoids calculation of image gradient and is based on pixel similarity. The proposed method not only achieves a high decomposition accuracy, but also improves over the previous algorithm on NPS as well as spatial resolution.
Keywords: dual-energy CT, image-domain decomposition, noise suppression, penalized weighted least-square optimization
1. INTRODUCTION
Dual-energy CT (DECT) has been increasingly used for iodine quantification,1 kidney stone characterization,2–4 virtual monochromatic imaging,5,6 lung perfusion/ventilation studies,7 and virtual nonenhanced images8–10 among a growing list of diagnostic applications. However, material differentiation via DECT still suffers from noise amplification during the signal decomposition process.11–13 In this paper, we propose a noise suppression method for DECT, which is based on the statistical properties of decomposed images as well as the redundant structural information of the two CT images at different energy levels.
Through basis material decomposition, DECT yields information on material composition, an advantage over conventional CT alone.14 Material decomposition is based on the fact that in the diagnostic energy range, there are two primary mechanisms of photon interaction with matter, i.e., photoelectric absorption and Compton scattering, and the linear attenuation coefficient is a summation of the probabilities of these interactions. Since these interactions are governed by two known energy-dependent functions, the images can be decomposed into relative fractions of two different materials. Through this decomposition, the materials within the image are better separated.
The material decomposition can be performed in either the projection domain13–18 or the image-domain.11,19,20 Decomposition in the projection domain has the advantage of being able to correct for beam-hardening artifacts. However this requires projection data which may not be available from a clinical CT scanner as many clinical scanners generate only the reconstructed CT images.19 Additionally, projection-domain decomposition requires exact angular matching of the projection data, which can be difficult on dual source scanners since data are acquired orthogonally.5,21 Here we focus on image-domain decomposition, which is readily implementable on different CT scanners as a post-reconstruction procedure.
The DECT decomposition is fundamentally limited by significant noise amplification and thus a decrease in signal-to-noise ratio, hindering the quantitative use of clinical DECT.22,23 The problem can be alleviated by general image-processing algorithms, such as filtering/smoothing based methods,24 with degraded spatial resolution. DECT-specific algorithms of noise suppression have been previously developed as well. For example, Warp and Dobbins proposed a method evoking the structural redundancy of the two images, using the edge information from the low energy image to regulate noise suppression in uniform regions of the high-energy image.25 Kalendar et al. aimed to suppress noise via the assumption of noise anticorrelation on material decomposed images.23 Dong et al. achieved substantial noise suppression on DECT by combining the two processes of iterative CT reconstruction and DECT decomposition.26
We recently proposed a new noise suppression algorithm for DECT, which is based on both redundant structural information and the statistical nature of the decomposition process.11 We use a penalized weighted least-square optimization with the inverse of the variance–covariance matrix of the decomposed images as the penalty weight, and thus the decomposition becomes an iterative process. The method is further controlled by a regularization term, which aims to preserve edges of the initial CT images on the decomposed material images. The method, referred to as penalized weighted least-square optimization with edge-preservation regularization (PWLS-EPR), is distinct from other approaches in that the decomposition is carried out iteratively at the same time as noise suppression, leading to higher accuracy.
While PWLS-EPR is useful and achieves effective noise reduction on DECT decomposed images, it does not utilize all of the structural information contained in the original CT images. The calculation of image gradient in the edge-preservation regularization inevitably degrades the image noise power spectrum (NPS), resulting in artificial or oversmoothed image textures.27,28 In this work, we aim to improve PWLS-EPR by a new regularization term. Rather than relying solely on edge pixels, we calculate the similarity between pixels across the entire CT image. Based on the fact that averaging pixels of the same or similar materials give a low-noise image, we include a regularization term in the objective of the optimization framework to minimize the difference between the images without and with noise suppression via pixel averaging. The improved method is referred to as penalized weighted least-square optimization with similarity-based regularization (PWLS-SBR). The performance of PWLS-SBR on spatial resolution, DECT decomposition accuracy, and image NPS preservation is evaluated on the Catphan©600 phantom, an anthropomorphic head phantom, and a head and neck patient study.
2. METHOD
2.A. Iterative image-domain decomposition with noise suppression
Here we briefly review our previously proposed algorithm of iterative image-domain decomposition with noise suppression, i.e., PWLS-EPR.11 In image-domain material decomposition, it is assumed that the linear attenuation coefficient is approximated by a linear combination of two basis functions. The formulation of material decomposition is as follows:
| (1) |
or
| (2) |
where and are the vectorized high-and low-energy images each of length N, the total number of image pixels, and and are the unitless basis material images, containing the relative fractions of each material, and also of length N. μ1H, μ2H, μ1L, and μ2L are the linear attenuation coefficients of materials 1 and 2 at high and low energies, and I is an N × N identity matrix. Solving for yields the direct decomposition,
| (3) |
where A−1 is the decomposition matrix and is defined as
| (4) |
Direct decomposition significantly amplifies noise because of the large condition number of the matrix A.23,25 As such, the decomposition is very sensitive to noise on the initial CT images and material images can be difficult to interpret without noise suppression.
The PWLS-EPR algorithm suppresses noise on the decomposed material images using the following optimization framework:
| (5) |
with matrix V defined as
| (6) |
where and are the estimated noise variances on the ith pixel in the high-energy and the low-energy CT images, respectively. In our implementations, we measure the noise variance inside a small uniform area of 50 × 50 pixels on the CT images and assume a stationary noise distribution across the entire field of view. In all studies presented in this paper, the region of interest (ROI) for variance calculation on CT images is the ROI used for noise standard deviation (STD) measurement on the material images. The first term in the objective of expression (5) is based on the design principle of a best linear unbiased estimator.29 The second regularization term preserves edges in the noise suppressed images, which is defined as
| (7) |
where Ni is the set of four neighbors of the ith pixel in the image and eik is the edge weight. The algorithm first detects edge pixels on the initial CT images and then assigns low values to eik only when either the ith or the kth pixel is on the edge. Such a regularization term allows sharp signal transition at edges and therefore preserves edge structures on the decomposed material images. λ is a user-defined parameter that controls the strength of noise suppression. More derivation and implementation details of the PWLS-EPR algorithm can be found in Ref. 11.
2.B. Penalized weighted least-square optimization with similarity-based regularization
Although PWLS-EPR fully exploits the statistical nature of the decomposed material images, the edge preservation regularization is based solely on edge pixels rather than the entire structural information contained in the initial CT images. Furthermore, minimizing the value of Eq. (7) reduces the signal differences between neighboring pixels. The image NPS is therefore altered as high-frequency variations are preferably suppressed, leading to artificial or oversmoothing artifacts.
PWLS-SBR improves over PWLS-EPR by avoiding the gradient calculation in the regularization term. Note that the true value of one image pixel, , can be estimated via weighted averaging pixels of the same or similar materials, , i.e.,
| (8) |
where Ni are the pixels of the same or similar materials compared to the ith pixel and wik is the normalized weight (i.e., ∑k∈Niwik = 1) quantifying the similarity between the materials of the ith and the kth pixels, calculated from the values of the initial CT images. We will discuss the calculation of wik later in the paper for the clarity of writing. Converting Eq. (8) to a matrix form, one obtains
| (9) |
where wik is the element of the similarity matrix W at the ith row and the kth column.
Equation (9) indicates that multiplying the image vector by the similarity matrix reduces the image noise. The difference between and becomes smaller when contains less noise. As such, if is the result of a successful noise suppression algorithm, the following approximation holds:
| (10) |
Using Eq. (10) as an additional data condition, the PWLS-SBR algorithm adopts the same optimization framework shown as expression (5), but with a different regularization term to ensure that Eq. (10) is valid, i.e.,
| (11) |
where matrix V is the same as defined in Eq. (6), calculates the L-2 norm of a vector, and λ is still a user-defined parameter that controls the strength of noise suppression.
The calculation of wik or the similarity matrix W is critical to the performance of PWLS-SBR on noise suppression. In general, for each pixel i, we should include a large number of similar pixels in the calculation of wik so that the mean value of can be accurately calculated. In this paper, inspired from the design of sigma filter,30,31 we use an empirical Gaussian model. The similarity sik between pixels i and k is calculated as
| (12) |
where h is another user-defined parameter that controls the width of the Gaussian similarity window. In our implementations, we set h as the measured noise STD on the CT images. The search window, Ωi, starts from a neighborhood of 41 × 41 pixels. If the number of neighboring pixels with nonzero sik values is less than 200, the size of search window automatically increases until the goal is reached or the search window is the entire image. This strategy ensures an adequate number of similar pixels for noise suppression. The element of the similarity matrix is calculated via normalization,
| (13) |
We use Eqs. (12) and (13) to calculate the similarity matrix in the PWLS-SBR algorithm based on the initial CT images. To reduce errors stemming from the CT image noise, we generate a first-pass similarity matrix from a noisy CT image and suppress noise on the CT image by matrix multiplication shown in Eq. (9). An updated similarity matrix is then produced on the noise-suppressed CT image. Furthermore, similarity matrices are calculated on the high-energy and the low-energy CT images separately, and averaged to generate a low-noise similarity matrix for use in PWLS-SBR.
2.C. Solver to PWLS-SBR
The objective function in expression (11) is convex and differentiable. As such, the condition for the optimal solution is
| (14) |
where ∇G is the gradient of the similarity-based regularization,
| (15) |
Equation (14) can be solved, for example, using a pre-conditioned conjugate gradient method.
2.D. Evaluation
We compare PWLS-SBR to both decomposition via direct matrix inversion, i.e., Eq. (3), and PWLS-EPR, i.e., expression (5). As shown in Sec. 2.C, the weight on the regularization term, λ, is the only tuning parameter for both algorithms of PWLS-SBR and PWLS-EPR. In the presented results, unless otherwise stated, we adjust λ values to achieve the same noise levels on the noise-suppressed images for fair comparisons.
Two physical phantoms are used in the evaluation studies, the Catphan©600 phantom (The Phantom Laboratory: Salem, NY) and an anthropomorphic head phantom. Projection data are acquired on our tabletop CT system at Georgia Institute of Technology. The geometry of the tabletop CT exactly matches that of the on-board imager of a Varian clinical linear accelerator. More description about the system can be found in Ref. 32. To inherently reduce scatter contamination on projection data, a fan-beam geometry is used and the illuminated area in the longitudinal direction on the detector has a width of 15 mm. Each CT scan contains 655 equi-angular projections, with 75 and 125 kVp as the low and high tube energies and a tube current of 80 mA. CT images are reconstructed via filtered backprojection with an image size of 512 × 512 pixels and 0.5 × 0.5 mm2 pixel size. To demonstrate the clinical value of the proposed algorithm, we evaluate the method performance on a head-and-neck patient. The patient data were acquired on a Siemens SOMATOM Definition flash CT scanner using a dual-energy CT imaging protocol. The patient was scanned twice, with tube energies of 140 and 80 kVp. The tube current was automatically adjusted by the scanner for matching doses in the two scans. All the algorithms are implemented in matlab. The matlab function pcg is used to solve Eq. (14). The computation speed of PWLS-SBR is dependent upon the level of noise suppression. In the phantom studies of this paper, where high noise reduction is achieved, PWLS-SBR typically converges in about 120 iterations, taking about 180 s to process one CT dataset on a 2.79 GHz PC with 4 GB of RAM. We lower the strength of noise suppression on the patient data since the clinical CT images have much lower noise than that on the phantom CT images acquired on our tabletop CT system. It takes PWLS-SBR 50 s to process one CT dataset. It should be noted that the similarity matrix is very large, taking up an average of 1.5 GB in memory. Implementation of the proposed algorithm on a PC with a larger internal memory could further shorten its computation time.
Spatial resolution is evaluated using the line-pair slice of the Catphan©600 phantom consisting of aluminum line-pairs ranging from a spatial frequency of 1 to 21 lp/cm. We use NPS to investigate the image quality difference for results from different algorithms at the same noise level.27,28 NPS is measured inside a uniform ROI as
| (16) |
where f is the 2D image inside the uniform ROI offset by its mean value and DFT2 is the 2D discrete Fourier transform.27,33,34
The slice of the Catphan©600 phantom containing contrast rods of various materials is used to assess decomposition accuracy via electron density measurement. Highly accurate electron density maps have become increasingly important in radiation therapy treatment planning for precise dose calculation.35 The electron density is calculated from the decomposed material images as
| (17) |
where xb and xt are the decomposed material images (i.e., relative fractions of basis materials) and ρe,b and ρe,t are the corresponding electron densities of the basis materials. For each contrast rod, the percent error of electron density measurement is computed as
| (18) |
where is the true material electron density, as published in the Catphan©600 phantom manual, and is the mean measured value inside each rod. The root-mean-square of the percent errors (RMSEs) is calculated for all contrast rods to quantify the overall accuracy.
The anthropomorphic head phantom is used to evaluate the method performance on objects with realistic and complex structures. We choose a slice containing the intricate bony anatomy of the sinuses, a challenging case for noise suppression without losing fine structures.
3. RESULTS
3.A. Catphan study on spatial resolution and NPS
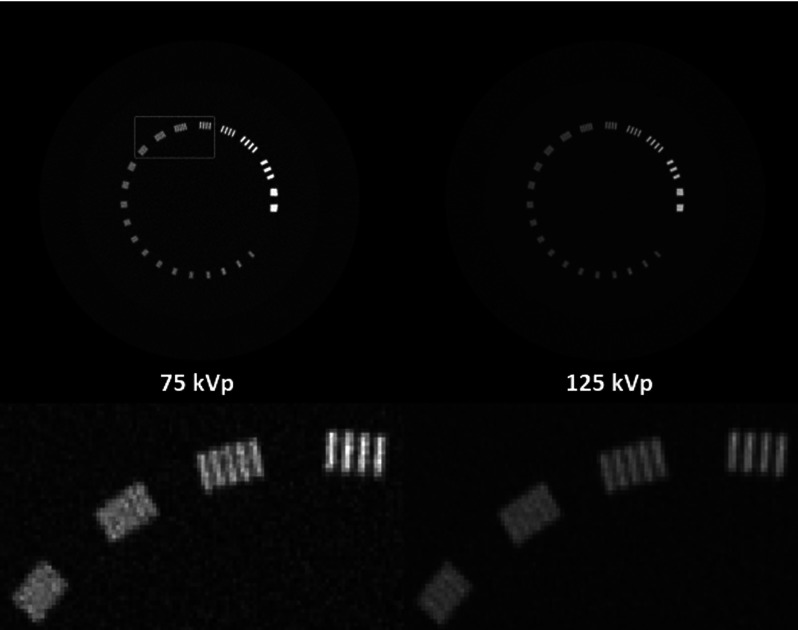
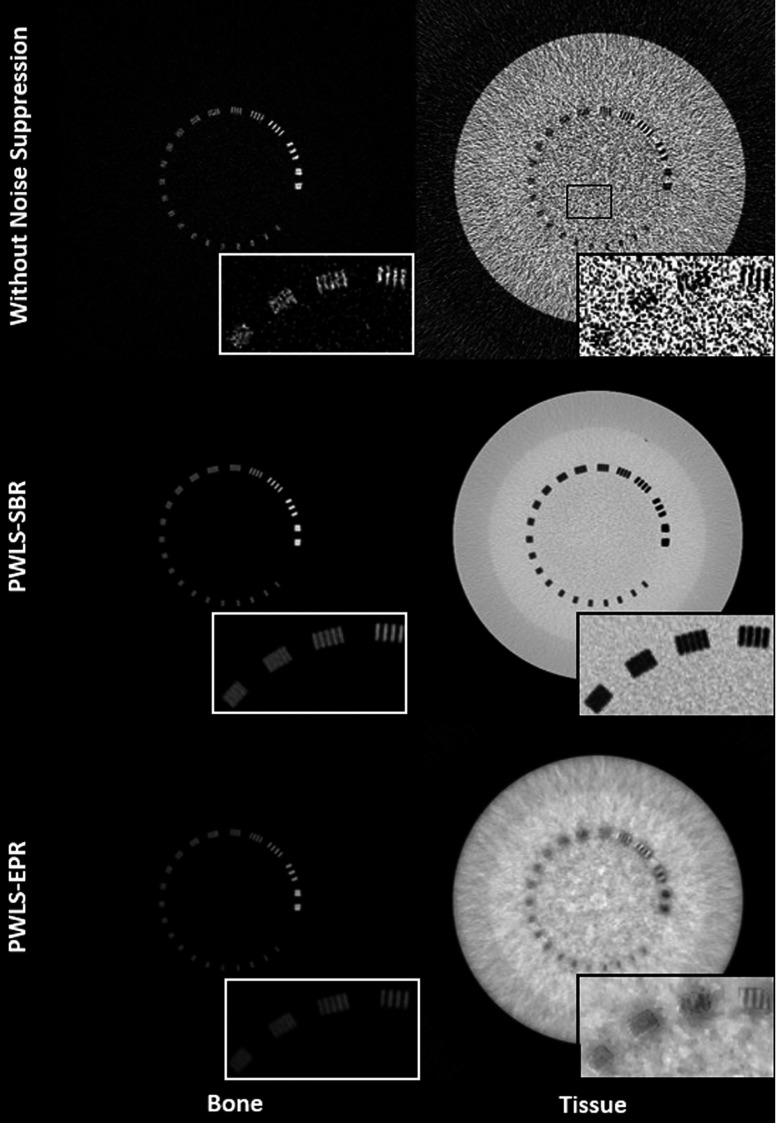
Figure 1 shows the 75 and 125 kVp CT images and Fig. 2 shows the results of material decomposition via direct matrix inversion without noise suppression, PWLS-SBR, and PWLS-EPR. Aluminum, the material of the line pairs, and epoxy, the material of the background, are chosen as basis materials for DECT decomposition, mimicking “bone” and “tissue,” respectively, in a clinical setting. The mean and STD calculated inside the ROI indicated in the tissue image without noise suppression of Fig. 2 are shown in Table I for each material image. For fair comparisons, we have tuned algorithm parameters such that both PWLS-SBR and PWLS-EPR achieve the same noise STD reduction, a factor of more than one order of magnitude. The zoom-in inserts on Figs. 1 and 2 scrutinize the performance on image spatial resolution. It is seen that PWLS-SBR preserves a spatial resolution of 8 lp/cm in both the bone and tissue images, comparable to that of the initial CT images. While PWLS-EPR can preserve this resolution on the bone image, the line pairs are blurred out on the tissue image.
FIG. 1.
CT images of the line-pair slice of the Catphan©600 phantom. Display window: [−500 2500] HU.
FIG. 2.
Decomposed bone and tissue images using direct matrix inversion without noise suppression, PWLS-SBR, and PWLS-EPR. The region where the inserts are taken is outlined on the low energy CT image in Fig. 1 and the ROI used to calculate mean and STD values of Table I is outlined on the tissue image without noise suppression. Display window: [0.2 1.2].
TABLE I.
The measured mean ± STD for each material image shown in Fig. 2. The ROI used in the calculation is indicated in the tissue image without noise suppression of Fig. 2.
| Bone image | Tissue image | |
|---|---|---|
| Without noise suppression | 0.01 ± 0.24 | 0.99 ± 0.74 |
| PWLS-SBR | 0.01 ± 0.02 | 0.99 ± 0.05 |
| PWLS-EPR | 0.00 ± 0.02 | 1.01 ± 0.05 |
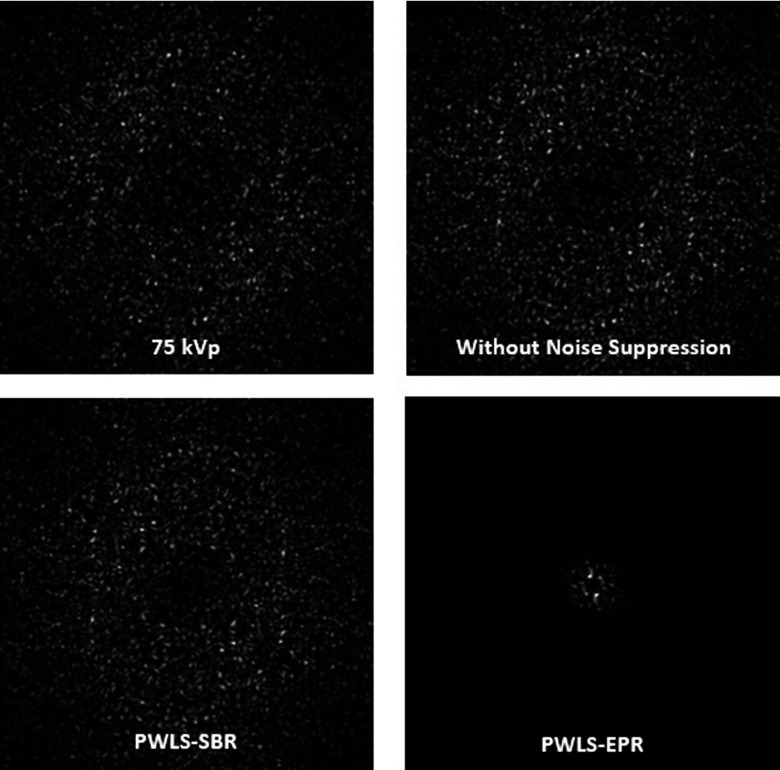
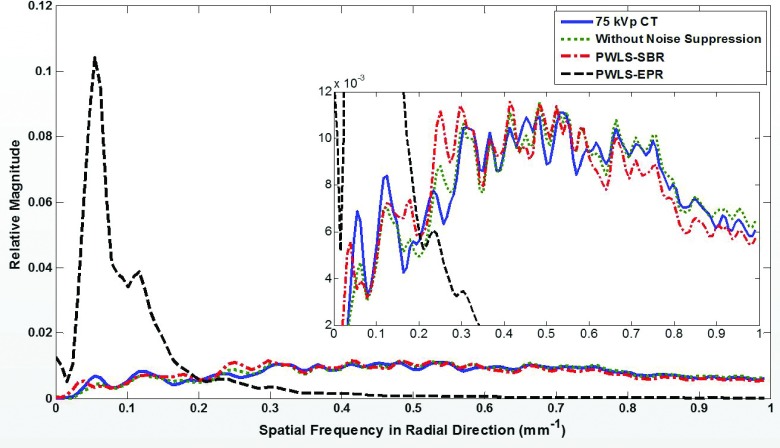
In addition to the difference on spatial resolution, it can be clearly seen that PWLS-SBR and PWLS-EPR produce images with different textures despite having the same noise level (obvious especially on the tissue images of Fig. 2). This is due to the difference on image NPS as shown in Fig. 3. PWLS-EPR heavily suppresses high-frequency noise, while PWLS-SBR preserves the shape of the NPS distribution of direct decomposition without noise suppression. For a quantitative measure, we average the 2D NPS in the angular direction to reduce noise and plot 1D profiles of the averaged NPS in the radial direction shown in Fig. 4. Note that Parserval’s theorem states that the total energy (i.e., sum of squares) in the signal domain equals that in the Fourier domain. Since the images of PWLS-SBR and PWLS-EPR have the same noise variance, their NPS have the same total energies. The NPS curve of direct decomposition without noise suppression is scaled down based on the noise reduction level to match the results of PWLS-SBR and PWLS-EPR. The NPS using PWLS-SBR has a correlation of 93% with that via direct decomposition (which has 96% correlation compared with the 75 kVp CT image), while the correlation drops to −52% for PWLS-EPR. The negative correlation of PWLS-EPR can be explained by the low frequency peak in the 1D-NPS, where no suppression produces a 1D-NPS with the peak shifted toward higher frequencies.
FIG. 3.
2D NPS, calculated for a central region of 100 × 100 pixels of the line-pair tissue images, offset by its mean value. Display window [min max].
FIG. 4.
NPS in the radial direction after averaging in the angular direction for all images shown in Fig. 3.
3.B. Catphan study on electron density accuracy
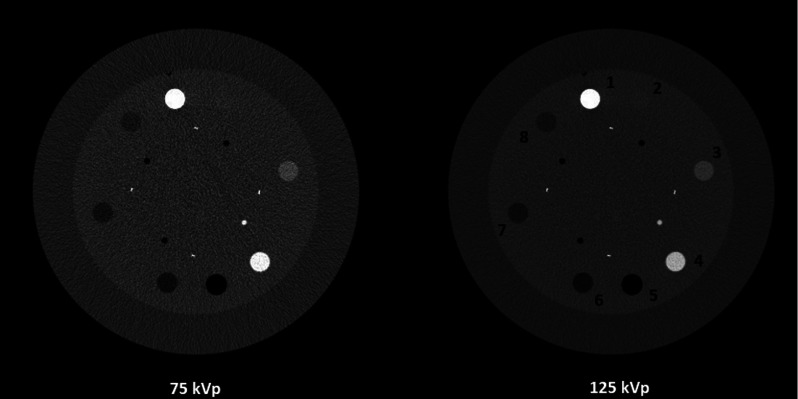
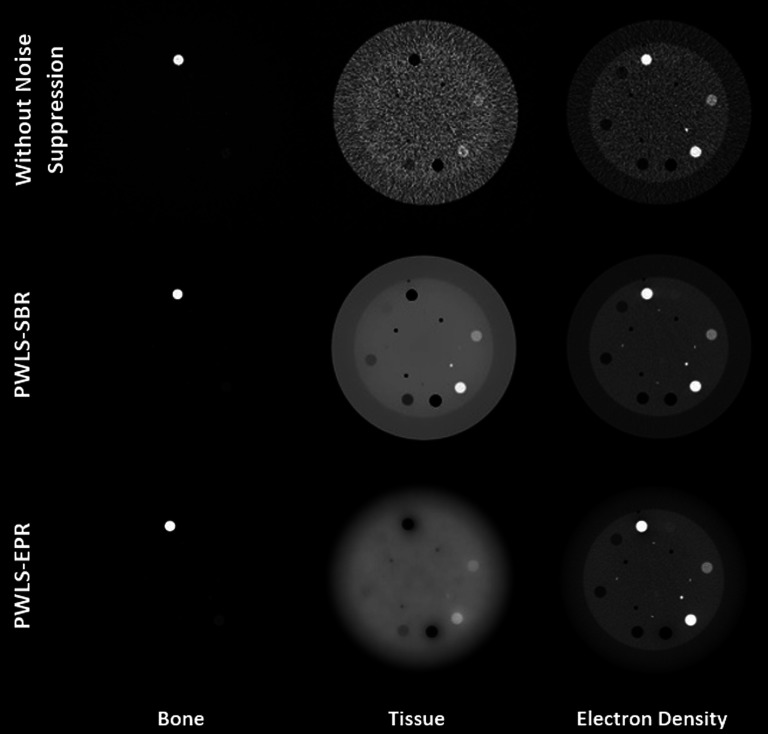
Figure 5 shows the CT images of the contrast rod slice of the Catphan©600 phantom. Different materials used for electron density measurements are labeled in the figure. Aluminum and low density polyethylene (materials 1 and 7) are used as the bone and tissue materials for decomposition. Figure 6 shows both the material images (left two columns) and the electron density images (right column) via direct matrix inversion without noise suppression, PWLS-SBR, and PWLS-EPR. The parameters are tuned for very strong noise suppression, noise STD reduction by a factor of 13 for bone images and by a factor of 149 for tissue images, to demonstrate the high level of accuracy that can be maintained by PWLS-SBR. Table II contains mean values of electron densities measured within various rods. PWLS-EPR has an electron density RMSE of 2.21%, while PWLS-SBR further reduces the RMSE down to 1.20%. Additionally, it is obvious via visual inspection that PWLS-SBR achieves a much improved image quality on overall image uniformity and spatial resolution. It should be noted that with noise suppression via PWLS-SBR, the low contrast acrylic rod (material 2 in Fig. 5) is clearly visible on the electron density image, while it is hard to differentiate without noise suppression.
FIG. 5.
CT images of the contrast-rod slice of the Catphan©600 phantom. The numbered materials are as follows: [1] aluminum, [2] acrylic, [3] Delrin, [4] Teflon, [5] air, [6] polymethylpentene, [7] low density polyethylene (LDPE), and [8] polystyrene. Display window: [−500 1000] HU.
FIG. 6.
Material and electron density images of the contrast rod slice of the Catphan©600 phantom. Display windows are [0.1 0.7] for bone, [0.6 1.4] for tissue, and [2.75 5] × 1023 e/cm3 for electron density maps.
TABLE II.
The measured mean electron densities in unit of 1023 e/cm3 for different contrast rods. The last column shows the overall RMSE.
| Aluminum | Acrylic | Delrin | Teflon | PMP | LDPE | Polystyrene | RMSE (%) | |
|---|---|---|---|---|---|---|---|---|
| Actual electron density | 7.83 | 3.83 | 4.56 | 6.24 | 2.85 | 3.16 | 3.34 | |
| Without noise suppression | 7.81 | 3.82 | 4.40 | 5.91 | 2.86 | 3.15 | 3.33 | 0.91 |
| PWLS-SBR | 7.75 | 3.76 | 4.34 | 5.86 | 2.89 | 3.20 | 3.39 | 1.20 |
| PWLS-EPR | 8.86 | 3.75 | 4.29 | 5.70 | 2.98 | 3.24 | 3.38 | 2.21 |
3.C. Anthropomorphic head phantom study
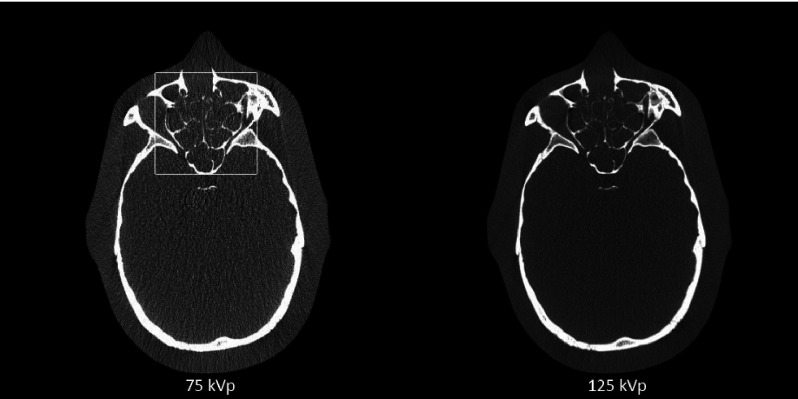
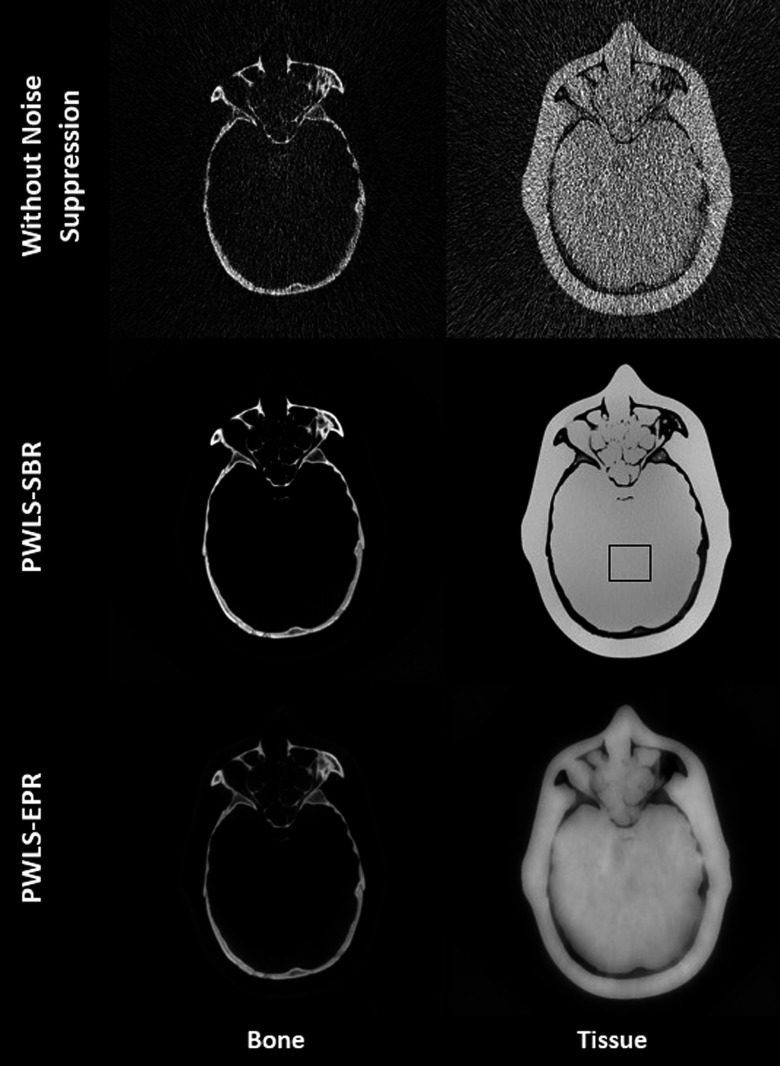
The anthropomorphic head phantom contains a calcium-based substance and an epoxy to mimic bone and soft tissue, respectively, which are used as the basis materials in DECT decomposition. Figure 7 shows the low- and high-energy CT images of a slice of the anthropomorphic head phantom. Figure 8 shows the results of material decomposition via direct matrix inversion without noise suppression, PWLS-SBR, and PWLS-EPR. The mean and STD values measured in the ROI indicated by a black rectangle in Fig. 8 are listed in Table III. Both PWLS-SBR and PWLS-EPR achieve the same level of noise STD reduction. Table III shows a slight bias for the decomposed images. However, we would like to emphasize that the small bias of 1% corresponds to a huge noise STD reduction of 24 and 57 on the bone and tissue images, respectively. To demonstrate the full potential of PWLS-SBR, we have tuned the algorithm parameter [i.e., λ in Eq. (11)] for extremely strong noise suppression. If the resultant bias is considered high in clinical applications, we can always tune down the noise suppression strength to maintain the image accuracy. Again, it is clear that the texture of the original image is preserved by PWLS-SBR and high-frequency noise is oversuppressed by PWLS-EPR. Figure 9 allows for a closer examination of the fine sinus structures. These structures are buried in noise in the result of direct decomposition. It is seen that PWLS-SBR preserves the structures present on the initial CT images better than PWLS-EPR.
FIG. 7.
CT images of the anthropomorphic head phantom. The white box on the 75 kVp image outlines the insert region shown in Fig. 9. Display window: [−500 1000] HU.
FIG. 8.
Decomposed material images of the anthropomorphic phantom using direct decomposition without noise suppression, PWLS-SBR, and PWLS-EPR. The black rectangle indicates the ROI where the mean and STD values are calculated in Table III. Display window [0.01 1.4].
TABLE III.
Mean ± STD measured on the images shown in Fig. 8, where the black rectangle indicates the ROI used in the calculation.
| Bone image | Tissue image | |
|---|---|---|
| Without noise suppression | 0.00 ± 0.54 | 1.00 ± 1.21 |
| PWLS-SBR | −0.01 ± 0.02 | 1.01 ± 0.02 |
| PWLS-EPR | −0.01 ± 0.02 | 1.01 ± 0.02 |
FIG. 9.
Zoom-in images of the sinus region for all images shown in Figs. 7 and 8. CT images display window: [−500 1000] HU, bone images display window: [0.1 1.0], and tissue images display window: [0.6 1.4].
3.D. Patient study
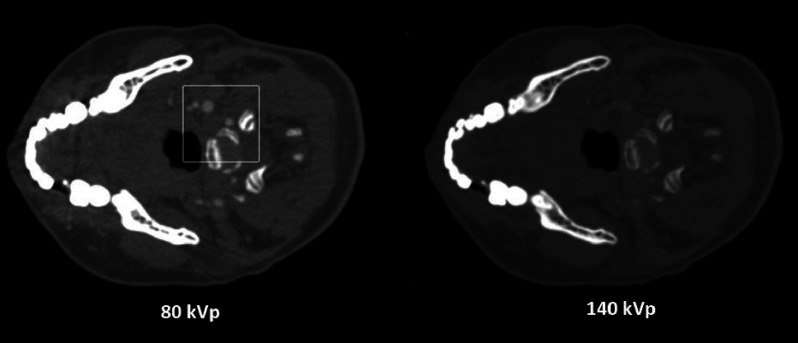
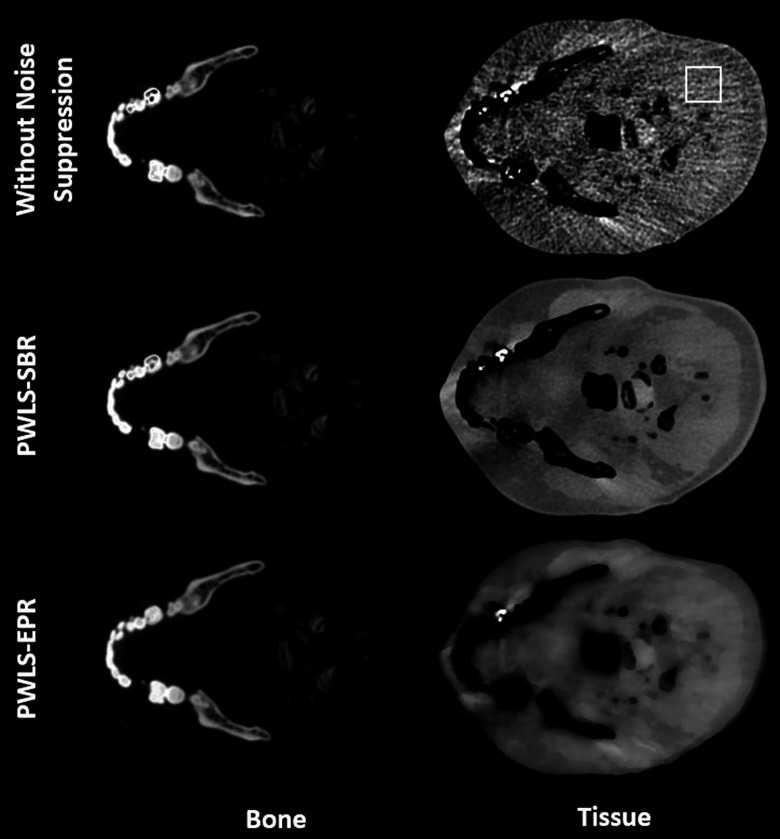
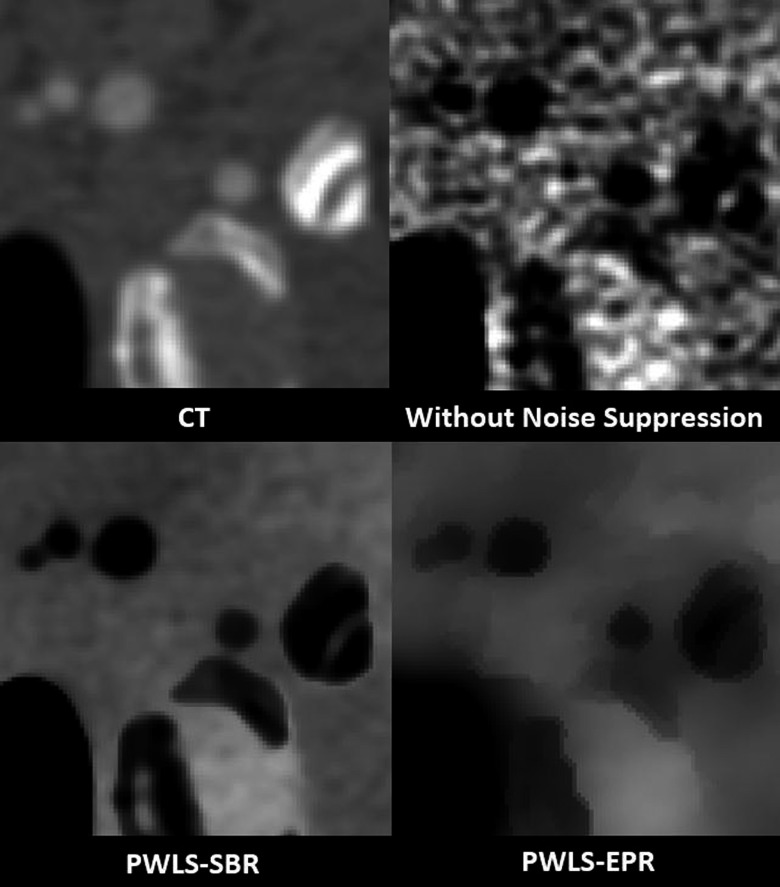
We further compare PWLS-SBR to PWLS-EPR and direct matrix inversion on the clinical data of a head-and-neck patient, with the CT images shown in Fig. 10. A region of the jaw was used to define the bone material, and a region of soft tissue was used to define the tissue material. The decomposed images using different algorithms are shown in Fig. 11. Table IV lists the measured mean ± STD values for the ROI indicated in Fig. 11. Note that the CT images of Fig. 10 have a noise STD of about 15 HU, much lower than those on the previous phantom images (up to 120 HU). A relatively weak noise suppression is therefore implemented in this study. Despite the low noise level of CT images, direct matrix inversion still obtains highly noisy material images as seen in Fig. 11. The image noise is effectively suppressed by PWLS-SBR and PWLS-EPR, both of which achieve the same level of noise STD reduction, i.e., by a factor of 2 and 4 for bone and tissue images, respectively. It is worth mentioning that, while PWLS-SBR could achieve greater noise suppression than what is shown, PWLS-EPR failed to preserve the density values at higher suppression, thus we limited the strength of noise suppression to preserve a fair comparison. The superior performance of PWLS-SBR compared with PWLS-EPR is evident in both Figs. 11 and 12. PWLS-SBR preserves all the fine structures of the patient on the material images, while these structural details are almost completely blurred out by PWLS-EPR. Image nonuniformity is observed on the tissue images using all three algorithms. We believe that these image artifacts mostly stem from beam-hardening errors present in the original CT images, which are magnified in the error-sensitive material decomposition process.5
FIG. 10.
CT images of a head-and-neck patient. The white box on the 80 kVp image outlines the insert region shown in Fig. 12. Display window: [−500 1000] HU.
FIG. 11.
Decomposed bone and tissue images using direct matrix inversion without noise suppression, PWLS-SBR, and PWLS-EPR. The ROI used to calculate mean and STD values of Table IV is outlined on the tissue image without noise suppression. Display window: [0.1 1.2] for bone images and [0.8 1.2] for tissue images.
TABLE IV.
Mean ± STD of all of the images shown in Fig. 11, where the white rectangle indicates the ROI used in calculation.
| Bone image | Tissue image | |
|---|---|---|
| Without noise suppression | 0.00 ± 0.02 | 1.00 ± 0.04 |
| PWLS-SBR | 0.00 ± 0.01 | 1.00 ± 0.01 |
| PWLS-EPR | 0.01 ± 0.01 | 0.99 ± 0.01 |
FIG. 12.
Zoom-in images of the sinus region for all images shown in Figs. 10 and 11. Display window: [−500 1000] HU for the CT image, [0.8 1.2] for the other three tissue images.
4. CONCLUSIONS AND DISCUSSION
In this paper, we improve a previously developed noise suppression method, PWLS-EPR,11 for DECT decomposition by designing a new regularization term. PWLS-EPR includes gradient calculation in the regularization for edge preservation, and therefore fails to preserve the NPS of the original image after noise suppression. The proposed PWLS-SBR algorithm adopts regularization that extracts the entire redundant structural information contained within the two initial CT images, rather than only edge pixels. Phantom studies show that, at a high-noise STD reduction level by a factor of more than one order of magnitude, PWLS-SBR maintains both image spatial resolution (up to 8 lp/cm) and NPS (>90% correlation) comparable to that of the initial CT image, a clear advantage over PWLS-EPR. In addition, PWLS-SBR reduces the RMSE of electron density measurement from 2.21% using PWLS-EPR down to 1.20%. On a head-and-neck patient, PWLS-SBR outperforms PWLS-EPR on preserving intricate bony structures as well as low-contrast objects on the decomposed material images.
A characteristic of nonlocal noise suppression algorithms is induction of signal bias. The trade-off between bias and noise suppression for nonlocal methods is analogous to the trade-off between image spatial resolution and noise suppression for conventional noise suppression methods such as smoothing or low-pass filtering. In the phantom studies presented in this paper, we apply strong noise suppression (STD reduction by a factor of more than one order of magnitude) to fully test the capability of the proposed method, leading to a bias on material images up to 1%. In situations where a less biased material density value is desired, the algorithm parameter, i.e., λ in Eq. (11), should be tuned such that noise suppression strength is decreased. Additionally, noise suppression could be weakened for reduced image bias by making the algorithm more locally weighted, i.e., with a smaller similarity search window, Ωi, in Eq. (12).
The similarity-based regularization in PWLS-SBR stands on the establishment of a new data condition, i.e., Eq. (10), which uses a large number of similarity pixels for noise suppression on one pixel. In our implementations, we choose to calculate the similarity matrix W using an empirical Gaussian model. Other more sophisticated algorithms of similarity matrix calculation are expected to achieve similar or even improved performance of PWLS-SBR, as long as Eq. (10) holds and each row of W has a large number of nonzero elements (i.e., the number of similar pixels is sufficient). For example, one may find similar pixels to one pixel using image segmentation and assign equal similarity to all these pixels. Furthermore, although we focus our paper on linear image-domain decomposition of DECT, the proposed method is readily translatable to nonlinear projection-domain decomposition, using the same technique as shown in our recent paper.18
The PWLS-SBR algorithm has two indications beyond the scope of DECT imaging. First, our results reveal that the similarity-based regularization is superior in preservation of image NPS compared with gradient-based regularization, although the latter is widely used for retaining edges during noise suppression. Following similar derivations of this paper, we can design similarity-based regularization for noise suppression in other imaging scenarios with improved image NPS. Second, the similarity matrix is able to extract structural information from one image for reducing noise on images with different intensities but the same structures. As such, with different formations of similarity matrices, PWLS-SBR can be used for noise suppression with prior images from the same imaging device but with different settings or even from different imaging modalities. For example, in energy-resolved CT imaging, we can calculate the similarity matrix on the image from one energy channel and use PWLS-SBR for noise suppression on the images from all other energy channels. The similarity matrix can even be calculated on an MRI image for noise suppression on a CT image of the same patient, as long as the two images are well registered and have exactly matching structures.
ACKNOWLEDGMENTS
Research reported in this publication was supported by the National Institute of Biomedical Imaging and Bioengineering of the National Institutes of Health under Award No. R21EB019597. The content is solely the responsibility of the authors and does not necessarily represent the official views of the National Institutes of Health. Dr. Tianye Niu is partially supported by the Zhejiang Provincial Natural Science Foundation of China (Grant No. LR16F010001), National High-tech R&D Program for Young Scientists by the Ministry of Science and Technology of China (Grant No. 2015AA020917).
REFERENCES
- 1.Li Y., Shi G., Wang S., Wang S., and Wu R., “Iodine quantification with dual-energy CT: Phantom study and preliminary experience with VX2 residual tumour in rabbits after radiofrequency ablation,” Br. J. Radiol. 86, 20130143 (2013). 10.1259/bjr.20130143 [DOI] [PMC free article] [PubMed] [Google Scholar]
- 2.Boll D. T., Patil N. A., Paulson E. K., Merkle E. M., Simmons W. N., Pierre S. A., and Preminger G. M., “Renal stone assessment with dual-energy multidetector CT and advanced postprocessing techniques: Improved characterization of renal stone composition—Pilot study,” Radiology 250, 813–820 (2009). 10.1148/radiol.2503080545 [DOI] [PubMed] [Google Scholar]
- 3.Eiber M., Holzapfel K., Frimberger M., Straub M., Schneider H., Rummeny E., Dobritz M., and Huber A., “Targeted dual-energy single-source CT for characterisation of urinary calculi: Experimental and clinical experience,” Eur. Radiol. 22, 251–258 (2012). 10.1007/s00330-011-2231-2 [DOI] [PubMed] [Google Scholar]
- 4.Primak A. N., Fletcher J. G., Vrtiska T. J., Dzyubak O. P., Lieske J. C., Jackson M. E., J. C. Williams, Jr., and McCollough C. H., “Noninvasive differentiation of uric acid versus non–uric acid kidney stones using dual-energy CT,” Acad. Radiol. 14, 1441–1447 (2007). 10.1016/j.acra.2007.09.016 [DOI] [PMC free article] [PubMed] [Google Scholar]
- 5.Yu L., Leng S., and McCollough C. H., “Dual-energy CT–based monochromatic imaging,” Am. J. Roentgenol. 199, S9–S15 (2012). 10.2214/AJR.12.9121 [DOI] [PubMed] [Google Scholar]
- 6.Yuan R., Shuman W. P., Earls J. P., Hague C. J., Mumtaz H. A., Scott-Moncrieff A., Ellis J. D., Mayo J. R., and Leipsic J. A., “Reduced iodine load at CT pulmonary angiography with dual-energy monochromatic imaging: Comparison with standard CT pulmonary angiography—A prospective randomized trial,” Radiology 262, 290–297 (2012). 10.1148/radiol.11110648 [DOI] [PubMed] [Google Scholar]
- 7.Thieme S. F., Graute V., Nikolaou K., Maxien D., Reiser M. F., Hacker M., and Johnson T. R. C., “Dual Energy CT lung perfusion imaging—Correlation with SPECT/CT,” Eur. J. Radiol. 81, 360–365 (2012). 10.1016/j.ejrad.2010.11.037 [DOI] [PubMed] [Google Scholar]
- 8.Takahashi N., Hartman R. P., Vrtiska T. J., Kawashima A., Primak A. N., Dzyubak O. P., Mandrekar J. N., Fletcher J. G., and McCollough C. H., “Dual-energy CT iodine-subtraction virtual unenhanced technique to detect urinary stones in an iodine-filled collecting system: A phantom study,” AJR, Am. J. Roentgenol. 190, 1169–1173 (2008). 10.2214/AJR.07.3154 [DOI] [PMC free article] [PubMed] [Google Scholar]
- 9.Zhang L.-J., Peng J., Wu S.-Y., Wang Z. J., Wu X.-S., Zhou C.-S., Ji X.-M., and Lu G.-M., “Liver virtual non-enhanced CT with dual-source, dual-energy CT: A preliminary study,” Eur. Radiol. 20, 2257–2264 (2010). 10.1007/s00330-010-1778-7 [DOI] [PubMed] [Google Scholar]
- 10.Sommer C. M., Schwarzwaelder C. B., Stiller W., Schindera S. T., Stampfl U., Bellemann N., Holzschuh M., Schmidt J., Weitz J., Grenacher L., Kauczor H. U., and Radeleff B. A., “Iodine removal in intravenous dual-energy CT-cholangiography: Is virtual non-enhanced imaging effective to replace true non-enhanced imaging?,” Eur. J. Radiol. 81, 692–699 (2012). 10.1016/j.ejrad.2011.01.087 [DOI] [PubMed] [Google Scholar]
- 11.Niu T., Dong X., Petrongolo M., and Zhu L., “Iterative image-domain decomposition for dual-energy CT,” Med. Phys. 41, 041901 (10pp.) (2014). 10.1118/1.4866386 [DOI] [PubMed] [Google Scholar]
- 12.Alvarez R. E., “Dimensionality and noise in energy selective x-ray imaging,” Med. Phys. 40, 111909 (13pp.) (2013). 10.1118/1.4824057 [DOI] [PMC free article] [PubMed] [Google Scholar]
- 13.Johns P. C. and Yaffe M. J., “Theoretical optimization of dual-energy x-ray imaging with application to mammography,” Med. Phys. 12, 289–296 (1985). 10.1118/1.595766 [DOI] [PubMed] [Google Scholar]
- 14.Alvarez R. E. and Macovski A., “Energy-selective reconstructions in x-ray computerised tomography,” Phys. Med. Biol. 21, 733–744 (1976). 10.1088/0031-9155/21/5/002 [DOI] [PubMed] [Google Scholar]
- 15.Riederer S. J. and Mistretta C. A., “Selective iodine imaging using K-edge energies in computerized x-ray tomography,” Med. Phys. 4, 474–481 (1977). 10.1118/1.594357 [DOI] [PubMed] [Google Scholar]
- 16.Lehmann L. A., Alvarez R. E., Macovski A., Brody W. R., Pelc N. J., Riederer S. J., and Hall A. L., “Generalized image combinations in dual KVP digital radiography,” Med. Phys. 8, 659–667 (1981). 10.1118/1.595025 [DOI] [PubMed] [Google Scholar]
- 17.Emil Y. S., Yu Z., and Xiaochuan P., “Impact of polychromatic x-ray sources on helical, cone-beam computed tomography and dual-energy methods,” Phys. Med. Biol. 49, 2293–2303 (2004). 10.1088/0031-9155/49/11/012 [DOI] [PubMed] [Google Scholar]
- 18.Petrongolo M., Dong X., and Zhu L., “A general framework of noise suppression in material decomposition for dual-energy CT,” Med. Phys. 42, 4848–4862 (2015). 10.1118/1.4926780 [DOI] [PubMed] [Google Scholar]
- 19.Maaß C., Baer M., and Kachelrieß M., “Image-based dual energy CT using optimized precorrection functions: A practical new approach of material decomposition in image domain,” Med. Phys. 36, 3818–3829 (2009). 10.1118/1.3157235 [DOI] [PubMed] [Google Scholar]
- 20.Sukovic P. and Clinthorne N. H., “Penalized weighted least-squares image reconstruction for dual energy x-ray transmission tomography,” IEEE Trans. Med. Imaging 19, 1075–1081 (2000). 10.1109/42.896783 [DOI] [PubMed] [Google Scholar]
- 21.Maaß C., Meyer E., and Kachelrieß M., “Exact dual energy material decomposition from inconsistent rays (MDIR),” Med. Phys. 38, 691–700 (2011). 10.1118/1.3533686 [DOI] [PubMed] [Google Scholar]
- 22.Roessl E., Ziegler A., and Proksa R., “On the influence of noise correlations in measurement data on basis image noise in dual-energy like x-ray imaging,” Med. Phys. 34, 959–966 (2007). 10.1118/1.2514058 [DOI] [PubMed] [Google Scholar]
- 23.Kalender W. A., Klotz E., and Kostaridou L., “An algorithm for noise suppression in dual energy CT material density images,” IEEE Trans. Med. Imaging 7, 218–224 (1988). 10.1109/42.7785 [DOI] [PubMed] [Google Scholar]
- 24.Rutherford R. A., Pullan B. R., and Isherwood I., “Measurement of effective atomic number and electron density using an EMI scanner,” Neuroradiology 11, 15–21 (1976). 10.1007/BF00327253 [DOI] [PubMed] [Google Scholar]
- 25.Warp R. J. and Dobbins J. T., “Quantitative evaluation of noise reduction strategies in dual-energy imaging,” Med. Phys. 30, 190–198 (2003). 10.1118/1.1538232 [DOI] [PubMed] [Google Scholar]
- 26.Dong X., Niu T., and Zhu L., “Combined iterative reconstruction and image-domain decomposition for dual energy CT using total-variation regularization,” Med. Phys. 41, 051909 (9pp.) (2014). 10.1118/1.4870375 [DOI] [PubMed] [Google Scholar]
- 27.Boedeker K. L., Cooper V. N., and McNitt-Gray M. F., “Application of the noise power spectrum in modern diagnostic MDCT: Part I. Measurement of noise power spectra and noise equivalent quanta,” Phys. Med. Biol. 52, 4027–4046 (2007). 10.1088/0031-9155/52/14/002 [DOI] [PubMed] [Google Scholar]
- 28.Boedeker K. and McNitt-Gray M., “Application of the noise power spectrum in modern diagnostic MDCT: Part II. Noise power spectra and signal to noise,” Phys. Med. Biol. 52, 4047–4061 (2007). 10.1088/0031-9155/52/14/003 [DOI] [PubMed] [Google Scholar]
- 29.Strutz T., Data Fitting and Uncertainty: A Practical Introduction to Weighted Least Squares and Beyond (Vieweg + Teubner, Germany, 2010). [Google Scholar]
- 30.Lee J.-S., “Digital image smoothing and the sigma filter,” Comput. Vision, Graphics, Image Process. 24, 255–269 (1983). 10.1016/0734-189X(83)90047-6 [DOI] [Google Scholar]
- 31.Morel J.-M., Buades A., and Coll T., “Local smoothing neighborhood filters,” in Handbook of Mathematical Methods in Imaging (Springer, New York, NY, 2011), pp. 1159–1201. [Google Scholar]
- 32.Niu T. and Zhu L., “Scatter correction for full-fan volumetric CT using a stationary beam blocker in a single full scan,” Med. Phys. 38, 6027–6038 (2011). 10.1118/1.3651619 [DOI] [PMC free article] [PubMed] [Google Scholar]
- 33.Baek J. and Pelc N. J., “The noise power spectrum in CT with direct fan beam reconstruction,” Med. Phys. 37, 2074–2081 (2010). 10.1118/1.3378673 [DOI] [PMC free article] [PubMed] [Google Scholar]
- 34.Siewerdsen J., Cunningham I., and Jaffray D., “A framework for noise-power spectrum analysis of multidimensional images,” Med. Phys. 29, 2655–2671 (2002). 10.1118/1.1513158 [DOI] [PubMed] [Google Scholar]
- 35.Joan H., Boyd M., and Peter B. G., “Cone beam computerized tomography: The effect of calibration of the Hounsfield unit number to electron density on dose calculation accuracy for adaptive radiation therapy,” Phys. Med. Biol. 54, N329–N346 (2009). 10.1088/0031-9155/54/15/n01 [DOI] [PubMed] [Google Scholar]


