

Abstract
MicroRNAs (miRNAs) are small non-coding RNAs that are often located in genomic breakpoint regions and play a critical role in regulating a variety of the cellular processes in human cancer. miR-3646 has been reported to take part in tumorigenic progression in breast and bladder cancer, but its potential functions and exact mechanistic roles in breast cancer are still unclear. The objective of this study was to investigate the role of miR-3646 in breast cancer growth and metastasis using both bioinformatic and experimental approaches. Before starting the bench work, we conducted a bioinformatic study to predict the target genes regulated by miR-3646 using a panel of different algorithms. The results showed that miR-3646 might regulate a large number of genes that are related to cell growth, proliferation, metabolis, transport, and apoptosis and some were cancer-related genes. We found that the expression level of miR-3646 was significantly upregulated in breast cancer cells and tissues compared with normal breast cells and no tumor tissues. Subsequently, the MTT and colony formation assay results showed that up-regulation of miR-3646 promoted the cell viability and proliferation. Our results also showed that down-regulation of miR-3646 arrested the cells in G2/M phase in MCF7 and MDA-MB-231 cells which was accompanied by the down-regulation of CDK1/CDC2 and cyclin B1 and upregulation of p21Waf1/Cip1, p27 Kip1, and p53, suggesting that down-regulation of miR-3646 induces G2/M arrest through activation of the p53/p21/CDC2/cyclin B1 pathway. In addition, overexpression of miR-3646 promoted migration and invasion of MCF7 and MDA-MB-231 cells. Taken together, miR-3646 is a potential oncogene in breast cancer and it may represent a new niomarker in the diagnosis and prediction of prognosis and therapeutic response.
Keywords: miR-3646, breast cancer, proliferation, migration, invasion, bioinformatics
Introduction
Breast cancer is the second most common cancer with nearly 1.67 million new cases diagnosed in 2012 and the most common cause of cancer-related mortality among females with over 508,000 deaths due to breast cancer worldwide [1,2]. It represents about 12% of all new cancer cases and 25% of all cancers in women. In 2015, it was estimated that among American women there would be 231,840 new cases of invasive breast cancer and 40,290 breast cancer deaths. Incidence rates of breast cancer vary greatly worldwide from 19.3 per 100,000 women in Eastern Africa to 89.7 per 100,000 women in Western Europe. In the past two decades, China experienced an ever-increasing incidence of breast cancer, twice as fast as global rates [3]. According to the latest Chinese Cancer Registry Annual Report, breast cancer has become the most common cancer among Chinese women and ranked the 5th leading cause of cancer-related deaths [4]. Breast cancer survival rates vary greatly worldwide, ranging from 80% or over in North America, Sweden and Japan to around 60% in middle-income countries and below 40% in low-income countries. A familial history of breast cancer increases the risk by a factor of two or three. Some mutations, particularly in BRCA1, BRCA2 and p53 result in a very high risk for breast cancer. Reproductive factors associated with prolonged exposure to endogenous estrogens, such as early menarche, late menopause, late age at first childbirth are among the most important risk factors for breast cancer. Exogenous hormones also exert a higher risk for breast cancer. Oral contraceptive and hormone replacement therapy users are at higher risk than non-users. Breast cancer can be treated by surgery, chemotherapy, radiotherapy, and immunotherapy. As a result of regular mammography screening programs, a shift toward the detection of early-stage (<2 cm) node-negative breast cancer with better prognosis has occurred. The most common system used to describe the stages of breast cancer is the American Joint Committee on Cancer (AJCC) TNM system, which is used in clinical practice to determine prognosis and treatment options [5-7]. This system includes tumor size, histological subtype and grade, lymph node metastases, and lymphovascular invasion, which are derived from careful histological analysis of primary breast cancer samples. However, the AJCC stage fails to predict recurrence accurately in many patients undergoing curative surgery for localized breast cancer. Although many biomarkers for breast cancer have been observed, only two biomarkers, estrogen receptor (ER) and human epidermal growth factor receptor 2 (HER2), have been established and are assessed routinely in every breast cancer. The fact that breast cancer is not a uniform cancer entity but consists of several different subtypes with different molecular profiles, biological behavior, and risk profiles poses a challenge for the clinical management and prognosis prediction. This highlights the need for new biomarkers for a more precise prediction of high-risk patients with breast cancer recurrence and consequently improve personalized cancer care. Nonetheless, the identification of new markers can lead to a more definitive insight into breast cancer biology and substantiates the importance of the existing biomarkers.
miRNAs are ~22 nucleotide small noncoding RNAs that regulate mRNA expression through binding to the 3’-untranslated regions (3’-UTR) of their target mRNAs [8]. Based on miRBase version 21 released in June 2014 (http://www.mirbase.org/), there are 1,881 miRNA precursors and 2,588 mature miRNAs in humans. miRNAs are transcribed as ~70 nucleotide stem-loop precursors and subsequently processed by the cytoplasmic RNase-III type enzyme Dicer to generate ~22 nucleotide mature products which can target and modulate protein expression by inhibiting translation and/or inducing degradation of target mRNAs. The mature miRNA is incorporated into a RNA-induced silencing complex (RISC), which recognizes target mRNAs through imperfect base pairing with the miRNA. miRNAs have important roles in various physiological and pathological processes, such as development, cell proliferation, differentiation, apoptosis, inflammation, stress response, and migration [9-11]. Increasing evidence has suggested that miRNAs act as either tumor suppressors (e.g. miR-34, miR-15/16, let-7, miR 200 family) or promoters (e.g. miR-155, miR-222/221, miR-17-5p, miR-21) in the development of various cancers and play crucial roles in regulating posttranscriptional gene expression [12-14]. Aberrant expression of miRNAs is involved in the development and progression of cancer by regulating functional proteins and the network of signaling pathways related to cell proliferation, cell migration, cell invasion, programmed cell death, and cell survival [15-19]. Moreover, miRNA-mediated targeted therapy has attracted extensive attention in various kinds of cancers, including breast cancer [20,21]. A small number of miRNAs are related to the initiation, growth, metastasis, and resistance to various therapies [22-24]. For example, miR-10b, miR-21, miR-155, miR-373, and miR-520c are known oncomirs of breast cancer. These oncomirs exert their oncogenic activity by targeting tumor-suppressor genes and activating oncogenic transcription factors. In contrast, miR-31, miR-125b, miR-126, miR-146b, miR-200, miR-206, and miR-335 have a tumor-suppressive function in breast cancer. Recently, miR-3646 was reported to be frequently upregulated and acted as a tumor promoter involved in a variety of cellular functions [25]. However, the relationship between the development and progression of breast cancer and the expression of miR-3646 has not yet been elucidated.
In the present study, we aimed to examine the expression profile of miR-3646 in non-tumoral and tumoral breast tissue and cell lines and identify the role of miR-3646 in the cellular functions with a focus on cell proliferation, cell cycle distribution, colony formation and migration.
Materials and methods
The human gene miR-3646
miR-3646 is an RNA gene which was first cloned from tumor tissues [26]. It is located at chromosome 20q13.12, and contains 84 bases starting from 44408120 to 44408203 (plus) in the latest GRCh38 assembly. The mature miR-3646 gene has a sequence of 58-AAAAUGAAAUGAGCCCAGCCCA-79.
Prediction of the targets of miR-3646 using various computational algorithms
Before starting the bench work, we conducted a bioinformatic study to predict the target genes regulated by miR-3646 using a panel of different algorithms including miRanda-mirSVR (http://www.microrna.org/), DIANA-microT v5.0 (http://diana.cslab.ece.ntua.gr/microT/), miRDB (http://mirdb.org/miRDB/), RNA22 v2 (https://cm.jefferson.edu/rna22v2.0/), TargetMiner (http://www.isical.ac.in/~bioinfo_miu/targetminer20.htm), TargetScan 7.0 (http://www.targetscan.org/), PicTar (http://pictar.mdc-berlin.de/), miRSearch V3.0 (https://www.exiqon.com/miRSearch), and miRWALK2.0 (http://www.umm.uni-heidelberg.de/apps/zmf/mirwalk/index.html).
miRanda-mirSVR (http://www.microrna.org/) is an online tool that can be used to predict targets and score them [27]. Unlike most miRNA target predictors, miRanda considers matching along the entire miRNA sequence, it takes the seed region into account by weighting matches in the seed region more heavily; and free energy is calculated by predicting the folding of the miRNA:mRNA hybrid using the Vienna package. DIANA-microT v5.0 currently hosts miRNA target predictions for Homo sapiens, Mus musculus, Drosophila melanogaster and Caenorhabditis elegans, based on data from Ensembl version 69 and miRBase version 18 [28,29]. miRDB, a web-based database and tool, can predict miRNAs and their targets [30-32]. All the targets are predicted by a bioinformatics tool MirTarget2, which has been developed by analyzing thousands of genes impacted by miRNAs with an SVM learning machine. RNA22 v2 can be used to predict for the targets of miRNAs in human, mouse, roundworm, and fruit fly [33]. It allows the users to visualize the predictions within a cDNA map and also find transcripts where multiple miR’s of interest target.
TargetMiner is a robust tool for microRNA target prediction with systematic identification of negative examples [34]. In this algorithms, ~300 tissue-specific negative examples have been identified using a novel approach that involves expression profiling of both miRNAs and mRNAs, miRNA-mRNA structural interactions and seed-site conservation. TargetScan 7.0 can predict biological targets of miRNAs by searching for the presence of conserved 8-, 7-, and 6-mer sites matching the seed region of each miRNA [35], with nonconserved sites being predicted as well. TargetScan is the first computational method used for human miRNA target prediction using mouse, rat, and fish genomes for conservation analysis. In mammals, the prediction is ranked based on the predicted efficacy of targeting as calculated using the context + scores of the sites [36]. The context score for a specific site is the sum of the contribution of four features: site-type contribution, 3’-pairing contribution, local AU contribution, and position contribution. The sum of the context scores for each miRNA was calculated, and the most favorable (lowest) was shown. Compared to previous releases, Release 7 uses an improved method to predict targeting efficacy (the context ++ model) [37], uses 3’-UTR profiles that indicate the fraction of mRNA containing each site [38], and uses updated miRNA families. PicTar is an algorithm for the identification of miRNA targets [39]. miRSearch 3.0 is an online search tool which quickly finds and displays microRNAs relevant for your research as well as detailed information about each microRNA in the most recent version of miRBase. Validated targets as well as diseases and tissue/sample information is supported by references with links to PubMed. miRSearch uses an advanced algorithm to cross-reference all these annotations so that a comprehensive list of microRNA-mRNA interactions can be displayed.
miRWalk2.0 is an improved version of the previous database miRWalk that provides information on miRNAs from the human, mouse and rat on their predicted as well as validated binding sites on their target genes (http://zmf.umm.uni-heidelberg.de/apps/zmf/mirwalk2/) [40,41]. miRWalk2.0 not only documents miRNA binding sites within the complete sequence of a gene, but also combines this information with a comparison of binding sites resulting from 12 existing miRNA-target prediction programs (DIANA-microTv4.0, DIANA-microT-CDS, miRanda-rel2010, mirBridge, miRDB4.0, miRmap, miRNAMap, doRiNA i.e.,PicTar2, PITA, RNA22v2, RNAhybrid 2.1 and Targetscan 6.2) to build novel comparative platforms of binding sites for the promoter (4 prediction datasets), cds (5 prediction datasets), 5’-(5 prediction datasets) and 3’-UTR (13 prediction datasets) regions. It also documents experimentally verified miRNA-target interaction information collected via an automated text-mining search and data from existing resources (miRTarBase, PhenomiR, miR2 Disease and HMDD) offer such information. MiRWalk2.0 hosts possible binding site interaction information (including “central pairing sites”) between genes (encompassing the complete sequence as well as mitochondrial genomes) and miRNAs resulting from the miRWalk algorithm by walking with a heptamer (7nts) seed of miRNA from positions 1 to 6. These different starting positions are considered because it has recently been identified that miRNAs also regulate the expression of their target genes by annealing from nucleotides 4 to 15. It provides possible interactions between miRNAs and genes associated with 597 KEGG, 456 Panther and 522 Wiki pathways and hosts miRNA binding site interactions on 18,394 gene ontology terms. In addition, it provides predicted miRNA binding sites on genes of 2,035 disease ontologies (DO), 6,727 human phenotype ontologies (HPO) and 4,980 OMIM disorders. The web-interface of miRWalk2.0 is classified into the Predicted Target (PTM) and the Validated Target (VTM) modules.
Pathway analysis by DAVID
The web-based Database for Annotation, Visualization and Integrated Discovery (DAVID 6.7, http://david.abcc.ncifcrf.gov/) [42,43] was used to provide biological functional interpretation of the validated targets of miR-3646 based on TarBase and miRTarBase. DAVID 6.7 can systematically map a large number of interesting genes in a list to associated Gene Ontology (GO) terms, and then statistically highlighting the most over-represented (enriched) GO terms out of a list of hundreds or thousands of terms. DAVID Knowledgebase has comprehensively integrated more than 20 types of major gene/protein identifiers and more than 40 well-known functional annotation categories from dozens of public databases to address the enriched and redundant relationships among many genes to many terms. The Protein IDs of the validated targets of miR-3646 from NCBI, PIR, and UniProtKB were converted into gene lists using the Gene ID Conversion Tool in DAVID. By doing so, interesting genes derived from one identifier system can be quickly translated to other gene identifier types preferred by a given annotation resource. The DAVID database adds biological function annotation including GO terms, protein–protein interactions, protein functional domains, disease associations, gene clustering, bio-pathways, sequence general features, homologies, gene functional summaries, and gene tissue expressions in a network context. The genes of interest were visualized using BioCarta and Kyoto Encyclopedia of Genes and Genomes (KEGG) pathway maps. The highest classification stringency was selected for functional annotation clustering. Enrichment scores and Fisher’s exact test p-values (and corresponding false discovery rate, FDR) were then calculated to identify which functional-related gene groups are significantly enriched in the target list.
Chemicals and reagents
Three synthetic, chemically modified short RNA oligonucleotides, including miR-3646 negative control NC, miR-3646 mimic, miR-3646 inhibitor, TRIzol reagent, Lipofectamine 2000, and Opti-MEM were bought from Invitrogen (Carlsbad, CA, USA). RNase A, propidium iodide (PI), thiazolyl blue tetrazolium bromide (MTT), Dulbecco’s phosphate buffered saline (D-PBS), protease inhibitor, and phosphase inhibitor cocktails, 6-diamidino-2-phenylindole (DAPI), and fetal bovine serum (FBS) were purchased from Sigma-Aldrich (St. Louis, MO, USA). DMEM/F12 (1:1) and RPMI 1640 medium were obtained from Corning Cellgro Inc. (Herndon, VA, USA). The polyvinylidene difluoride (PVDF) membrane was bought from Bio-Rad Inc. (Hercules, CA, USA). Western blotting substrate and Pierce BCA protein assay kit were sourced from Thermo Scientific Inc. (Hudson, NH, USA). Primary antibodies against human p53, p21 Wafl/Cipl, p27 Kipl, cyclin B1, and CDC 2 were all purchased from Cell Signaling Technology Inc. (Beverly, MA, USA). The antibody against human β-actin was obtained from Santa Cruz Biotechnology Inc. (Santa Cruz, CA, USA).
Cell culture and transfection
MCF-7, MDA-MB-231, and MCF10A cell lines were all obtained from the American Type Culture Collection (Manassas, VA, USA). MCF-7 and MDA-MB-231 cells are the epithelial breast cancer cell lines, and MCF10A is a normal epithelial breast cell line. MCF-7 and MDA-MB-231 cells were maintained in RPMI 1640 medium supplemented with heat-inactivated 10% FBS and 1% penicillin/streptomycin. MCF10A cells were grown in DMEM/F12 (1:1) medium supplemented with 5% horse serum, 10 μg/mL insulin, 100 ng/mL cholera enterotoxin, 0.5 mg/mL hydrocortisone, and 20 ng/mL epidermal growth factor. All cells were maintained in a 5% CO2/95% air humidified incubator at 37°C. Cells were seeded into 6-well plates grown overnight and reached 30-50% confluence before transfection. MiR-3646 NC (an oligonucleotide not representing any known miRNA), miR-3646 mimic, or miR-3646 inhibitor was transfected into cells at a concentration of 25 nM using Lipofectamine 2000 according to the manufacturer’s instructions.
RNA extraction and quantitative reverse transcription polymerase chain reaction (qRTPCR)
For quantification of miR-3646 mRNA level by real-time PCR, total miRNA and total RNA were extracted from cultured cells or fresh breast normal and tumor tissues using TRIzol reagent according to the manufacturer’s instructions. The expression level of miR3646 was quantified using the miRNAspecific TaqMan miRNA Assay kit (Applied Biosystems Life Technologies, Foster City, CA, USA). U6 small nuclear RNA was used as an internal control. The qRT-PCR were performed on a CFX96 real-time PCR detection system (Bio-Rad) according to the manufacturer’s instructions and the results were normalized to the expression level of GAPDH. The cycle threshold values were evaluated using the manufacturer’s software. The expression level of miR-3646, relative to U6 snRNA, and GAPDH were calculated using the 2-ΔΔCT method.
Cell viability assay
The effect of MiR-3646 on cell viability was examined using the MTT assay. Briefly, Cells were seeded in 96-well culture plates at a density of 8 × 10³/well. After 12, 24, 36, or 48 hr incubation, 10 μL MTT (5 g/L) was added into each well and cultured for another 4 hr. Then the solution was carefully aspirated and 150 μL DMSO was added to dissolve the crystal. The absorbance was measured at a wavelength of 490 nm using a Synergy H4 Hybrid microplate reader (BioTek Inc., Winooski, VT, USA).
Cell cycle distribution analysis by flow cytometry
The effect of MiR-3646 on cell cycle distribution was examined using PI as a DNA stain to determine DNA content by flow cytometry as described previously [44]. Briefly, MCF-7 and MDA-MB-231 cells were transfected with miR-3646 NC, miR-3646 mimic, and miR-3646 inhibitor at concentration of 25 nM for 24 hr. Following the transfection, cells were detached, washed by PBS, centrifuged, and fixed in 70% ethanol at -20°C overnight. Then the cells were resuspended in 1 mL of PBS containing 1 mg/mL RNase A and 50 μg/mL PI. Cells were incubated in the dark for 30 minutes at room temperature. A total number of 1 × 10⁴ cells was subject to cell cycle analysis using a flow cytometer (Becton Dickinson Immunocytometry Systems, San Jose, CA, USA).
Western blotting analysis
The expression level of cellular proteins of interest were determined using Western blotting assays. Visualization was performed using Bio-Rad system with enhanced-chemiluminescence substrate and the blots were analyzed using Image Lab 3.0 (Bio-Rad). The matching densitometric value of the internal control β-Actin was used to normalize the protein expression level.
Statistical analysis
Data are expressed as the mean ± standard deviation (SD). Comparisons of multiple groups were performed using one-way analysis of variance (ANOVA) followed by Tukey’s multiple comparison procedure. Values of P<0.05 were considered statistically significant. Assays were performed at least three times independently.
Results
Predicted targets of miR-3646 using various algorithms
We used a panel of algrithms ro predict the targets that were possibly regulated by miR-3646. Except miRanda-mirSVR and PicTar, all other programs used in this study produced the predicted targets of miR-3646 (Table 1 and Supplementary Table 1).
Table 1.
Predicted targets of miR-3646 by various predicting tools
| Tool | Website (URL) | No. of predicted targets/transcripts | Examples of predicted targets |
|---|---|---|---|
| DIANA-microT v5.0 | http://diana.cslab.ece.ntua.gr/microT/ | 1,033 (threshold set at 0.7) | ABI3BP, ANKRD17, ARNTL2, AP3B1, BRWD3, CDK17, CEP350, CREB1, CREBRF, CXXC4, GLTSCR1L, GULP1, GSK3B, IKZF5, INO80C, KIAA1958, LCOR, MAPK6, MGAT3, NAA25, NBPF10, NPR3, PALM2, PAPD5, PAX6, PCNX, PRLR, RAB21, RAG1, RAP2B, SFRP1, SLC6A, SLC44A1, TAOK1, TCF20, TENM1, TMEM135, TP53TG3D, UBE2W, ZBTB44, ZFX, ZNF148, ZNF704, ZRANB2, etc |
| miRanda-mirSVR | http://www.microrna.org/ | No predicted data | - |
| miRDB | http://mirdb.org/miRDB/ | 1,602 | CAMTA1, CGGBP1, CHD6, CUL3, EBF2, EDEM3, EEA1, EPHA5, ERAP1, FKTN, FILIP1L, GABPA, GABRA1, HDAC2, IMPAD1, KIAA1804, KLHL28, LIN7C, NDFIP2, NFAT5, PDS5B, PLCB1, PTPN4, RBMS3, RICTOR, ROBO1, SKIL, SLC4A7, SLC6A15, VPS37A, ZNF148, ZRANB2, etc |
| RNA22 v2 | https://cm.jefferson.edu/rna22v2.0/ | 927 | ABCD3, BSND, CAMSAP2, CD53, CEP350, CHD1L, COL16A, DNAJB4, ERO1LB, FAM129A, FGR, GBP5, GPN2, LRRC8C, LYSMD1, LYST, MROH9, MMACHC, NCSTN, ORC1, PAPPA2, PDZK1IP1, PRKAB2, RAB3GAP2, RASAL2, RGL1, RGS4, SCMH1, SLC35A3, SMG7, SNRNP40, SYPL2, TBX19, TOR1AIP2, USH2A, XCL2, etc |
| TargetMiner | http://www.isical.ac.in/~bioinfo_miu/targetminer20.htm | 2,582 | ACADM, ACTR2, ATM, ATP7A, BTBD7, CLCN5, COL4A3, COL4A4, CPOX, EDA, LDLRAD4, OSBPL8, PPARA, RAB11FIP1, RBMS3, SMAD5, SPOPL, STX16, TWISTNB, UBE2W, etc |
| TargetScan 7.0 | http://www.targetscan.org/ | 7,284 | ALG10B, ANKRD49, CAMTA1, CCDC38, CLEC4C, CSN2, EIF1B, FZD3, GABRA4, GNG12, GNG4, GPR34, INO80C, KCNJ6, KRTAP4-11, LAMTOR5, LIN7C, MGAT4C, MMP28, MRPL14, MTRNR2L7, OR4N4, PET100, PFDN4, RBX1, RGS1, RHOA, SLC1A6, SLC25A31, SPOPL, TCEAL7, THAP1, TSNAX, XKR3, ZEB2, ZNF460, ZNF714, etc |
| PicTar | http://pictar.mdc-berlin.de/ | No predicted data | - |
| miRSearch V3.0 | https://www.exiqon.com/miRSearch | 44 | ABLIM1, ADAM28, ATP8A2, CASP10, CDC42SE2, CLCN6, DGKE, EFR3B, EIF2AK2, EIF2C1, FBXO45, ITSN1, KBTBD11, KCNJ5, KSR1, LIMD1, LIN28B, MBNL3, MYO5B, NEAT1, PCDH19, PLD1, PLEKHG4B, PPIL6, PPM1H, PTDSS1, PTEN, SNX13, SOGA3, SOX6, SRGAP1, STYX, TEAD1, TPBG, UBR1, UNC5D, ZNF275, etc |
Using DIANA-microT v3.0, miR-3646 was predicted to regulate 1,033 targets when the threshold was set to 0.7, including ABI3BP, ANKRD17, ARNTL2, AP3B1, BRWD3, CDK17, CEP350, CREB1, CREBRF, CXXC4, GLTSCR1L, GULP1, GSK3B, IKZF5, INO80C, KIAA1958, LCOR, MAPK6, MGAT3, NAA25, NBPF10, NPR3, PALM2, PAPD5, PAX6, PCNX, PRLR, RAB21, RAG1, RAP2B, SFRP1, SLC6A, SLC44A1, TAOK1, TCF20, TENM1, TMEM135, TP53TG3D, UBE2W, ZBTB44, ZFX, ZNF148, ZNF704, ZRANB2, etc (Table 1). The RNA22 v2 has predicted that 927 transcripts were regulated by miR-3646. These included ABCD3, BSND, CAMSAP2, CD53, CEP350, CHD1L, COL16A, DNAJB4, ERO1LB, FAM129A, FGR, GBP5, GPN2, LRRC8C, LYSMD1, LYST, MROH9, MMACHC, NCSTN, ORC1, PAPPA2, PDZK1IP1, PRKAB2, RAB3GAP2, RASAL2, RGL1, RGS4, SCMH1, SLC35A3, SMG7, SNRNP40, SYPL2, TBX19, TOR1AIP2, USH2A, XCL2, etc (Table 1).
miRDB has predicted that miR-3646 could predict 1,602 transcripts. These included CAMTA1, CGGBP1, CHD6, CUL3, EBF2, EDEM3, EEA1, EPHA5, ERAP1, FKTN, FILIP1L, GABPA, GABRA1, HDAC2, IMPAD1, KIAA1804, KLHL28, LIN7C, NDFIP2, NFAT5, PDS5B, PLCB1, PTPN4, RBMS3, RICTOR, ROBO1, SKIL, SLC4A7, SLC6A15, VPS37A, ZNF148, ZRANB2, etc (Table 1). TargetMiner has predicted that miR-3646 could regulate 2,582 transcripts, including ACADM, ACTR2, ATM, ATP7A, BTBD7, CLCN5, COL4A3, COL4A4, CPOX, EDA, LDLRAD4, OSBPL8, PPARA, RAB11FIP1, RBMS3, SMAD5, SPOPL, STX16, TWISTNB, UBE2W, etc (Table 1).
TargetScan 7.0 has predicted that 7,284 transcripts might be regulated by miR-3646, including ALG10B, ANKRD49, CAMTA1, CCDC38, CLEC4C, CSN2, EIF1B, FZD3, GABRA4, GNG12, GNG4, GPR34, INO80C, KCNJ6, KRTAP4-11, LAMTOR5, LIN7C, MGAT4C, MMP28, MRPL14, MTRNR2L7, OR4N4, PET100, PFDN4, RBX1, RGS1, RHOA, SLC1A6, SLC25A31, SPOPL, TCEAL7, THAP1, TSNAX, XKR3, ZEB2, ZNF460, ZNF714, etc (Table 1). The miRSearch 3.0 has predicted that miR-3646 might regulate 44 targets, including ABLIM1, ADAM28, ATP8A2, CASP10, CDC42SE2, CLCN6, DGKE, EFR3B, EIF2AK2, EIF2C1, FBXO45, ITSN1, KBTBD11, KCNJ5, KSR1, LIMD1, LIN28B, MBNL3, MYO5B, NEAT1, PCDH19, PLD1, PLEKHG4B, PPIL6, PPM1H, PTDSS1, PTEN, SNX13, SOGA3, SOX6, SRGAP1, STYX, TEAD1, TPBG, UBR1, UNC5D, ZNF275, etc (Table 1).
Many of the above predicted targets of miR-3646 regulate a number of important cellular processes such as cell proliferation, cell death, cell division, mitosis, metabolism of glucose, lipids, nuclear acids, and amino acids, and transport. Some of them are cancer-related genes.
There is a high expression profile of miR-3646 in breast cancer tissues and tumoral cells
To validate the role of miR-3646 in tumor growth and metastasis, we next investigated the expression of miR-3646 in breast cancer tissues and whether miR-3646 affected the growth, cell cycle, invasiob and migration of breast cancert cells. We first observed the expression level of miR-3646 in human breast cancer tissues. There were 30 human normal breast and 30 breast cancer tissue samples that were subject to real time-PCR assay. There was a higher expression level of miR-3646 in human breast cancer tissues than that in normal breast tissues (Figure 1A).
Figure 1.
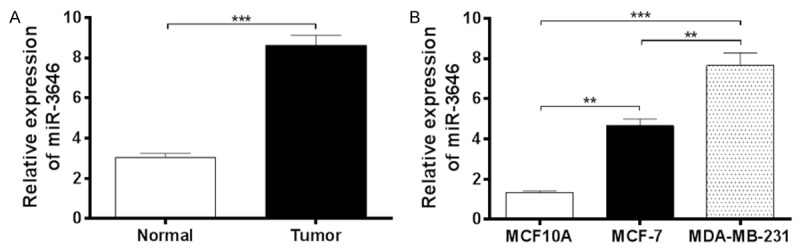
MiR-3646 is up-regulated in breast cancer cell lines and tissues. The expression level of miR-3646 in breast cancer cell lines and tissues was determined by using qRT-PCR. A. miR-3646 was significantly up-regulated in breast cancer cell lines (MCF-7 and MDA-MB-231) than that in normal human breast cell line. B. miR-3646 was significantly higher in breast cancer tissues (Tumor) compared with adjacent non-tumor tissues (Normal). Data are the mean ± SD of three independent experiments. *P<0.05; **P<0.01; and ***P<0.001 by one-way ANOVA.
In addition, the expression profile of miR-3646 was examined in two breast cancer cell lines (MCF-7 and MDA-MB-231) and a human normal breast cell line (MCF10A). As shown in Figure 1B, there was a significant high expression level of miR-3646 in tumoral cell lines than that in normal cell line. Of note, there was a higher expression level of miR-3646 in MDA-MB-231 cells than that in MCF-7 cells (P<0.01; Figure 1B). Taken together, the results showed that there was a high expression profile of miR-3646 in human breast cancer tissues and tumoral cells, which suggests a possible role of miR-3646 in tumorigenesis. Thus, we subsequently conducted experiments to validate the role of miR-3646 in tumor development and progression using different cell lines.
Overexpression of miR-3646 promotes cell proliferation in both MCF-7 and MDA-MB-231 cells
After we observed the high expression profile of miR-3646 in breast cancer tissue and tumoral cells, we next examined the role of miR-3646 in the proliferation of breast cancer cells. MCF-7 and MDA-MB-231 cells were transfected with miR-NC, miR-3646 mimic, or miR-3646 inhibitor and the miR-3646 expression level was determined by qRT-PCR. In comparison to the control, there was a significant increase in the level of miR-3646 in the mimic group; whereas miR-3646 inhibitor remarkably suppressed its expression in both cell lines (P<0.001; Figure 2A and 2B). The results suggest that the expression of miR-3646 can be modulated. Following, the effect of miR-3546 on the viability of MCF-7 and MDA-MB-231 cells were determined over 48 hr. Transfection of miR-3646 mimic evidently enhanced the viability of MCF-7 and MDA-MB-231 cells; one the other hand, transfection of miR-3646 inhibitor markedly suppressed the viability of MCF-7 and MDA-MB-231 cells (P<0.001; Figure 3). Furthermore, the colony formation assays revealed that enhanced expression of miR-3646 led to a significant increase in cell growth of MCF-7 and MDA-MB-231 cells, while the decreased expression of miR-3646 resulted in a marked reduction of cell growth of both cell lines (Figure 4). Taken together, these results indicate that miR-3646 exerts a growth-promoting effect in breast cancer cells.
Figure 2.
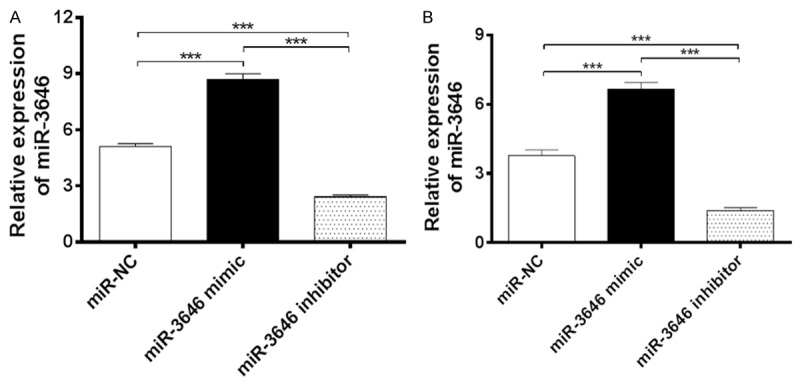
Expression of miR-3646 in breast cancer cells was confirmed by using qRT-PCR. Cells were transfected with miR-3646 NC, miR-3646 mimic and miR-3646 inhibitor for 24 hours and then subject to using qRT-PCR. (A) the expression of miR-3646 after transfection with miR-3646NC, miR-3646 mimic and miR-3646 inhibitor in MCF-7 cells and (B) the expression of miR-3646 after transfection with miR-3646NC, miR-3646 mimic and miR-3646 inhibitor in MDA-MB-231 cells. Data are the mean ± SD of three independent experiments. *P<0.05; **P<0.01; and ***P<0.001 by one-way ANOVA.
Figure 3.
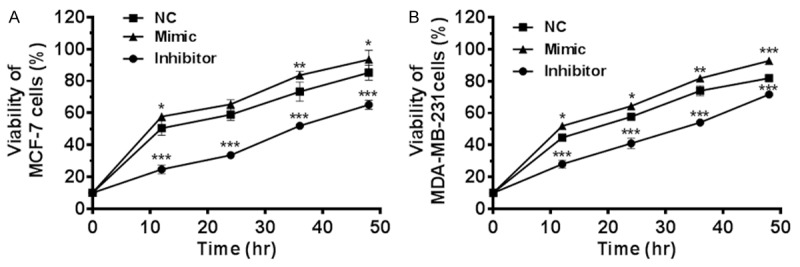
MiR-3646 increased cell proliferation in MCF-7 and MDA-MB-231 cells. Cells were transfected with miR-3646 NC, miR-3646 mimic and miR-3646 inhibitor, then subject to MTT assay. (A) MTT assay was performed to analyze the effect of miR-3646 on cell proliferation of MCF-7 cells and (B) MTT assay was performed to analyze the effect of miR-3646 on cell proliferation of MDA-MB-231 cells.
Figure 4.
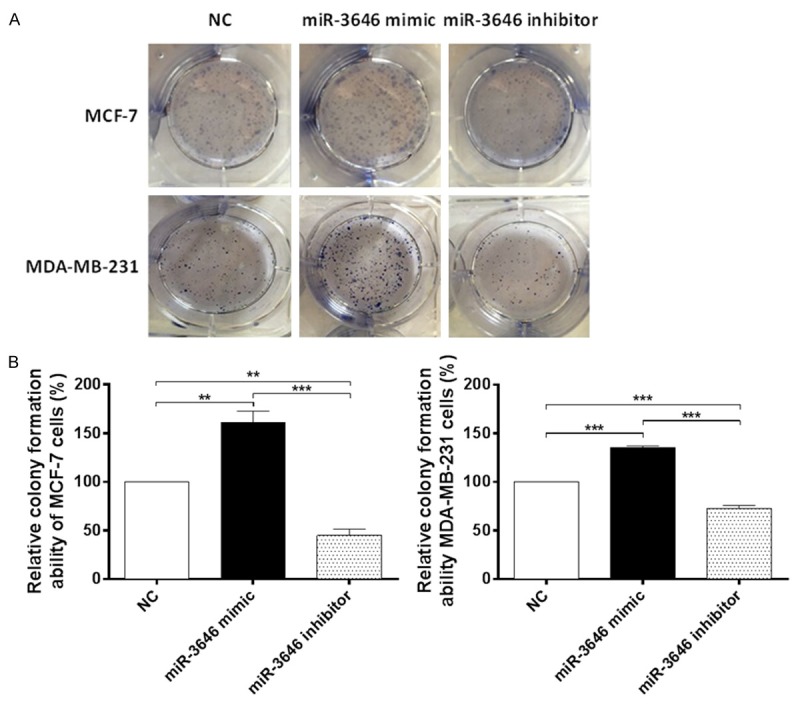
Colony formation assay indicated miR-3646 increased colony formation of MCF-7 and MDA-MB-231 cells. Cells were transfected with miR-3646 NC, miR-3646 mimic and miR-3646 inhibitor, then subject to colony formation assay. A. Upregulation of miR-3646 significantly increased the number of surviving colonies from the MCF-7 and MDA-MB-231 cells compared with the miR-3646 NC group and down-regulation of miR-3646 dramatically reduced the number of surviving colonies from the MCF-7 and MDA-MB-231 cells compared with the miR-3646 NC group. B. Bar graphs showing the relative colony formation ability of miR-3646 NC, miR-3646 mimic and miR-3646 inhibitor in MCF-7 and MDA-MB-231 cells. Data are the mean ± SD of three independent experiments. *P<0.05; **P<0.01; and ***P<0.001 by one-way ANOVA.
Inhibition of miR-3646 induces G2/M arrest in breast cancer cells
Based on the observation on the cell growth promoting effect of miR-3646 in both MCF7 and MDA-MB-231 cells, we further assessed the effect of miR-3646 on the cell cycle distribution of MCF-7 and MDA-MB-231 cells by flow cytometry. Transfection of both cells with 25 nM miR-3646 mimic for 24 hr caused a significant cell cycle arrest in G2/M phase (Figure 5A and 5B). The percentage of cells arrested in G2/M phase was 63.9% and 65% in MCF-7 and MDA-MB-231 cells, respectively (Figure 5A), leading to 6.0- and 5.8-fold increase, respectively, compared to the control cells transfected with miR-3646 negative control (P<0.001; Figure 5B). The results show that inhibition of miR-3646 suppressed cell cycle progression with G2/M phase arrest.
Figure 5.
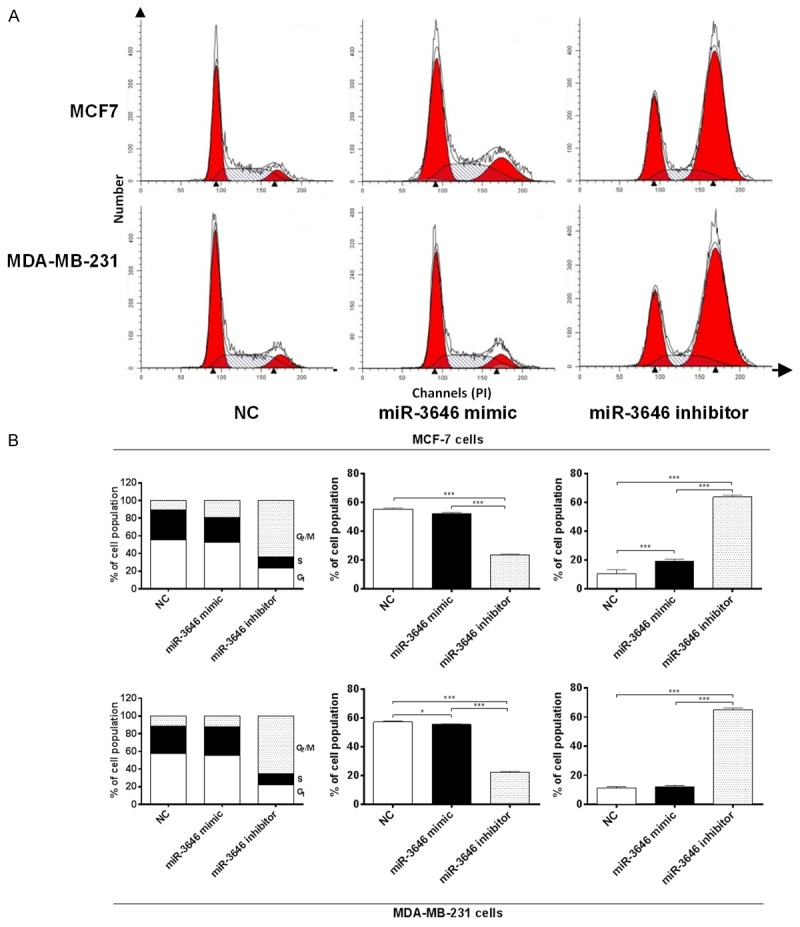
MiR-3646 inhibitor induces cell cycle arrest in MCF-7 and MDA-MB-231cells. Cells were transfected with miR-3646 NC, miR-3646 mimic and miR-3646 inhibitor at 25 nM for 24 hours and then subject to flow cytometric analysis. (A) Flow cytometric plots for cell cycle distribution of MCF-7 and MDA-MB-231 cells and (B) The bar graphs showing the percentage of MCF-7 and MDA-MB-231 cells in G1, S, and G2/M phases. Data are the mean ± SD of three independent experiments. *P<0.05; **P<0.01; and ***P<0.001 by one-way ANOVA.
MiR-3646 regulates the expression of CDK1/CDC2, Cdk2, cyclin B1, p21Waf1/Cip1, p27 Kip1, and p53 in MCF-7 and MDA-MB-231 cells
To explore the mechanism for miR-3646 inhibitor induced cell cycle arrest, we examined the effect of miR-3646 on the expression level of CDK1/CDC2, Cdk2, cyclin B1, p21Waf1/Cip1, p27 Kip1, and p53 in MCF-7 and MDA-MB-231 cells using Western blotting assay. In comparison to the control group, the expression level of CDK1/CDC2, Cdk2, and cyclin B1 was significantly decreased in MCF-7 and MDA-MB-231 cells transfected with miR-3646 inhibitor, whereas the expression level of p21Waf1/Cip1, p27 Kip1, and p53 was significantly increased in both cell lines for 24 hr (Figure 6A and 6B). In comparison to the miR-3646 NC group, the expression level of cyclin B1 was decreased 72.5% and 85.2% when transfected with miR-3646 inhibitor in MCF-7 and MDA-MB-231 cells, respectively (Figure 6A and 6B). There was a 36.5% and 49.6% reduction in the level of CDK1/CDC2 in MCF-7 and MDA-MB-231 cells transfected with miR-3646 inhibitor, respectively (Figure 6A and 6B). The level of CDK2 was decreased 29.3% when MCF-7 cells were transfected with miR-3646 inhibitor (Figure 6A and 6B). However, there was no significant change in the expression level of CDK2 when MDA-MB-231 cells were transfected with miR-3646 inhibitor for 24 hr. On the other hand, in comparison to the miR-3646 NC group, the expression level of p21Waf1/Cip1 was increased 1.3- and 1.2-fold when transfected with miR-3646 inhibitor in MCF-7 and MDA-MB-231 cells, respectively (Figure 6A and 6B). Transfection of MCF-7 and MDA-MB-231 cells with miR-3646 inhibitorsignificantly increased the level of p27 Kip1 2.4- and 2.5-fold, respectively (Figure 6A and 6B). The expression level of p53 was increased 1.4-fold when transfected with miR-3646 inhibitor in MCF-7 cells (Figure 6A and 6B). However, there was no significant change in the expression levels of p53, when MDA-MB-231 cells were transfected with miR-3646 inhibitor (Figure 6A and 6B). In addition, the immunofluorescent assay showed that miR-3646 mimic significantly suppressed the expression of p21Waf1/Cip1 while the miR-3646 inhibitor dramatically increasing the level of p21Waf1/Cip1 in MCF-7 and MDA-MB-231 cells compared to the control (Figure 7A and 7B). Collectively, the modulating effect of miR-3646 on the key cell cycle regulators contributes to the cell cycle arresting effect in MCF-7 and MDA-MB-231 cells.
Figure 6.
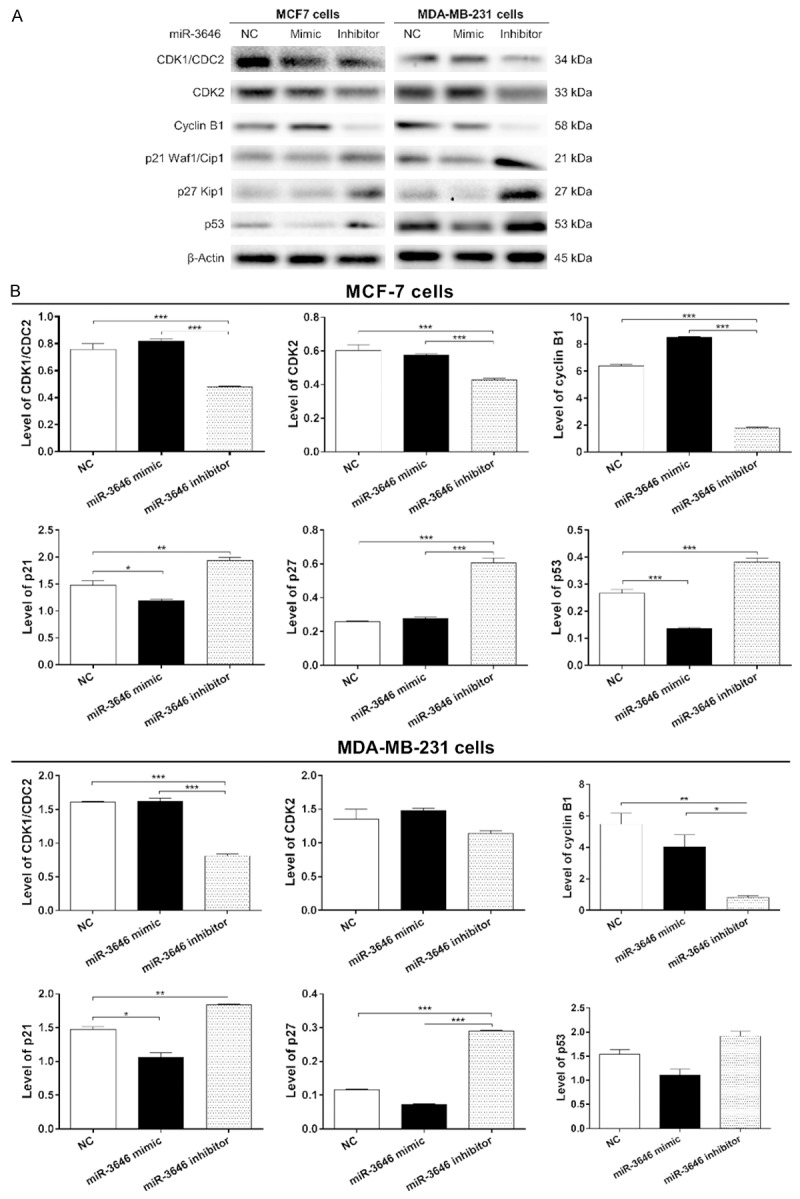
MiR-3646 modulates the expression levels of CDK1/CDC2, Cdk2, cyclin B1, p21Waf1/Cip1, p27 Kip1, and p53 in MCF-7 and MDA-MB-231 cells. Cells were transfected with miR-3646 NC, miR-3646 mimic and miR-3646 inhibitor at 25 nM for 24 hours and then the protein samples were subject to Western blotting assay. (A) Representative blots of Cdk1/Cdc2, Cdk2, cyclin B1, p21Waf1/Cip1, p27 Kip1, and p53 and (B) Bar graphs showing the relative expression levels of CDK1/CDC2, Cdk2, cyclin B1, p21Waf1/Cip1, p27 Kip1, and p53 in MCF-7 and MDA-MB-231 cells. β-Actin was used as the internal control. Data are the mean ± SD of three independent experiments. *P<0.05; **P<0.01; and ***P<0.001 by one-way ANOVA.
Figure 7.
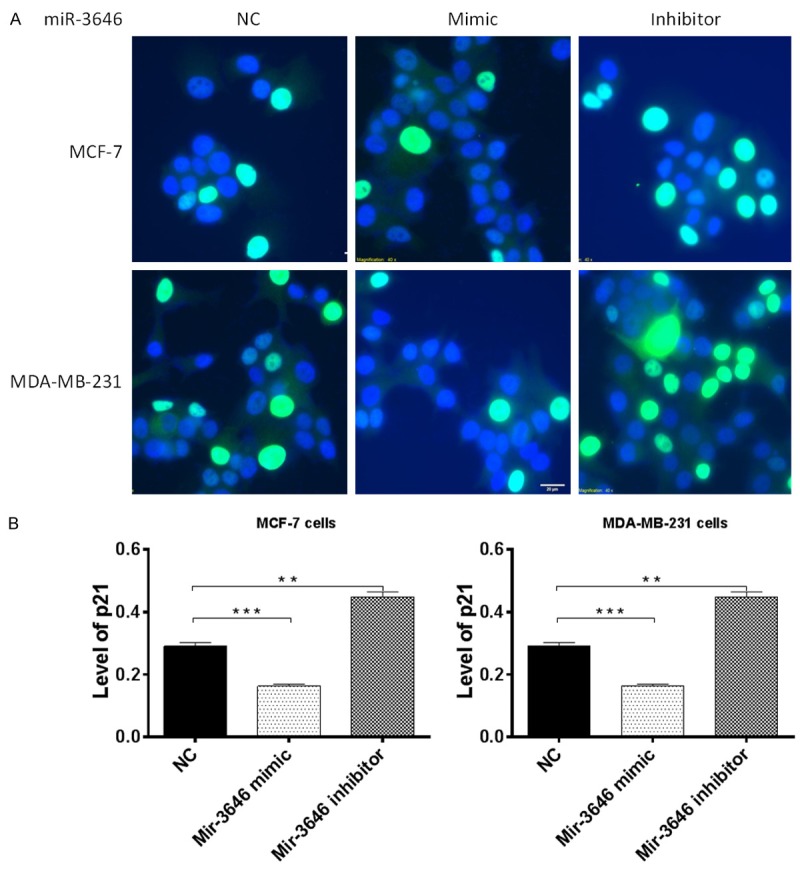
The effect of miR-3646 on the expression level of p21Waf1/Cip1 examined by immunofluorescent assay. Cells were transfected with miR-3646 NC, miR-3646 mimic and miR-3646 inhibitor at 25 nM for 24 hours and then subject to immunofluorescent assay. (A) Representative images of p21Waf1/Cip1 and (B) Bar graphs showing the relative expression level p21Waf1/Cip1 in MCF-7 and MDA-MB-231 cells. Data are the mean ± SD of three independent experiments. **P<0.01 and ***P<0.001 by one-way ANOVA.
MiR-3646 promotes the invasion and migration of breast cancer cells
At last, we functionally evaluate the impact of miR-3646 on cell invasion and migration in MCF-7 and MDA-MB-231 cells using transwell invasion and wound-healing assays. The Transwell assay showed that the miR-3646 mimic markedly promoted the invasion of MCF-7 and MDA-MB-231 cells; while miR-3646 inhibitor suppressed the invasion of MCF-7 and MDA-MB-231 cells (P<0.01 or 0.001; Figure 8A and 8B). Similarly, the cell wound assay showed that increased level of miR-3646 remarkably enhanced the migratory ability of MCF-7 and MDA-MB-231 cells; whereas, reduced level of miR-3646 markedly repressed the migration of MCF-7 and MDA-MB-231 cell, compared to the control (Figure 9A and 9B). Taken together, these findings demonstrate that miR-3646 promotes breast cancer cells invasion and migration in vitro.
Figure 8.
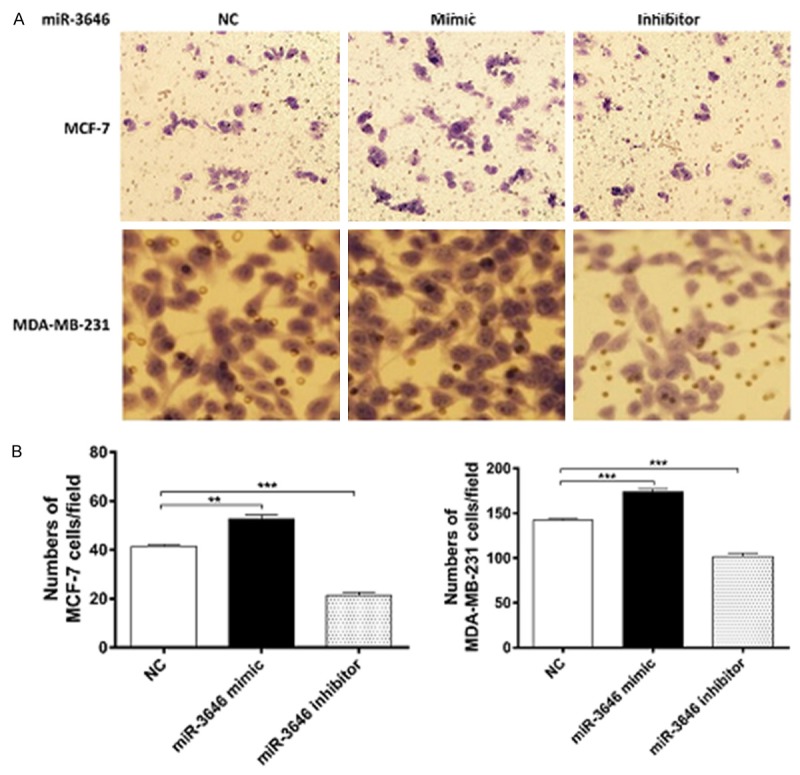
miR-3646 promotes breast cancer cell invasion. Cells were transfected with miR-3646 NC, miR-3646 mimic and miR-3646 inhibitor at 25 nM for 24 hours and then the samples were subject to transwell invasion assay. (A) the effect of miR-3646 expression on invasion of MCF-7 and MDA-MB-231 cells using transwell invasion assay and (B) Bar graphs showing the numbers of cells/field of miR-3646 NC, miR-3646 mimic and miR-3646 inhibitor in MCF-7 and MDA-MB-231 cells. Data are the mean ± SD of three independent experiments. *P<0.05; **P<0.01; and ***P<0.001 by one-way ANOVA.
Figure 9.
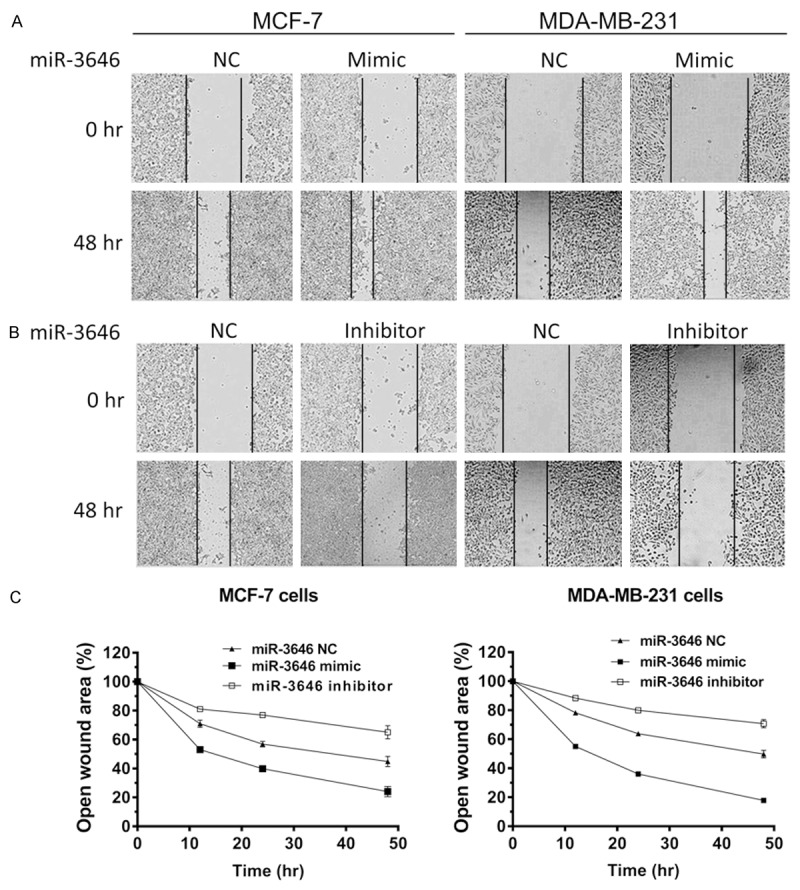
miR-3646 promotes breast cancer cell migration. Cells were transfected with miR-3646 NC, miR-3646 mimic and miR-3646 inhibitor at 25 nM for 24 hours and then the samples were subject to wound scratch healing assay. (A) The effect of miR-3646 expression on migration of MCF-7 and MDA-MB-231 cells using wound scratch healing assay and (B) Bar graphs showing the percent of open wound of miR-3646 NC, miR-3646 mimic and miR-3646 inhibitor in MCF-7 and MDA-MB-231 cells. Data are the mean ± SD of three independent experiments. *P<0.05; **P<0.01; and ***P<0.001 by one-way ANOVA.
Discussion
Breast cancer is a common malignant tumor, which is caused by varieties of factors [45]. In order to detect breast cancer in an earlier time and take appropriate action, we need a more accurate method of discovering the occurrence of breast cancer. With the advance of molecular biology and biological detection technologies, molecular markers of breast cancer have gained increasing attention, and combining molecular markers of breast cancer with clinical characteristics of individual for breast cancer treatment has become possible [46-48]. Potential molecular markers have a major role in forecast treatment efficacy for breast cancer, observation on the prognosis, and identification of risk for treatment [49]. Many molecular markers associated with breast cancer have been detected, such as estrogen receptor (ER), human epidermal growth factor 2 (HER-2), p53, and so on [50-54].
Recently, there is a wealth of evidence indicating that miRNAs have important roles in the tumorigenesis and metastasis [55,56], and identification of tumor-related miRNAs and their direct target genes is critical for understanding the biological significance of miRNAs in breast cancer development, progression, and metastasis [57-59]. Therefore, it may reveal novel prognostic and therapeutic targets for breast cancer patients [57-59]. An extremely large number of potential target sites exists for any given miRNA, and the process of validating a potential miRNA target in the laboratory is time consuming and costly. A computational approach to prediction of miRNA targets facilitates the process of narrowing down potential target sites for experimental validation, which is a critical initial step in identifying miRNA-target interactions. A panel of useful algorithms/tools provide microRNA target predictions based on sequence complementarity to target sites with emphasis on perfect or near-perfect base-pairing in the seed region and sequence conservation [60,61]. These tools for miRNA target prediction encompassing a range of different computational approaches from the modeling of physical interactions to the incorporation of machine learning are mostly based on seed match, conservation, free energy, and site accessibility [61]. Using the powerful bioinformatics approaches, we have predicted that miR-3646 might regulate a large number of important genes that play a role in cell proliferation, division, metabolism, transport, and apoptosis. Some of them are cancer-related genes and thus it is not a surprise that miR-3646 could affect the initiation, growth, and metastasis of cancer. In the validation study, we found that miR-3646 significantly promoted breast cancer cell growth and cell cycle progression. Knockdown of miR-3646 markedly inhibited breast cancer cell proliferation, colony formation, and migration.
The miR-3646 was identified in breast cancer by miRNA microarray analysis [25]. The increased expression level of miR-3646 was found in nipple discharge samples from breast cancer patients compared to the benign group. It has been reported that miR-3646 showed high expression level in bladder cancer cell lines and tissue and increased in human patients with acetaminophen hepatotoxicity or ischemic hepatitis as well [62,63]. However, there is a lack of information about the function of miR-3646 in the tumorigenesis and metastasis.
In the present study, we provided the first line of evidence that miR-3646 promoted cell growth and cell cycle progression in breast cancer cells. First, we investigated miR-3646 expression in non-tumoral and tumoral breast tissues and cell lines. The expression level of miR-3646 was significantly increased in breast cancer cells and tumor tissues than that in normal breast cells and tissues. Over-expression of miR-3646 significantly promoted cell proliferation, whereas knockdown of miR-3646 significantly inhibited cell growth. It suggests that miR-3646 might act as a tumor oncogene in the progression of breast cancer.
Rapid and unrestrained cell proliferation is a fundamental component of the malignant phenotype of cancer, not only for the development and growth of primary tumors, but also for the colonization of metastatic tumor cells in their target organs [64]. Cell cycle progression involves sequential activation of CDKs, which possess an association with corresponding regulatory cyclins that is necessary for their activation [65]. However, aberrant activation of the cyclin/CDK complexes can be partly ascribed to the loss or inactivation of endogenous CDK inhibitors, including p15Ink4b, p16Ink4a, p21Cip1/Waf1 and p27Kip1 [66]. In the present study, we found that miR-3646 arrested MCF-7 and MDA-MB-231 cells in G2/M phase. We further explored the effect of miR-3646 on the key regulators in cell cycle checkpoints including CDC2, CDK2, and cyclin B1 in MCF-7 and MDA-MB-231 cells. The CDC2-cyclin B1 complex is pivotal in regulating the G2/M phase transition and mitosis. We observed a significant decrease in the expression level of cyclin B1 and CDC2 in MCF-7 and MDA-MB-231 cells transfected with miR-3646 inhibitors, providing an explanation for the inducing effect of miR-3646 on G2/M phase arrest in MCF-7 and MDA-MB-231 cells. The Cip/Kip family, including p21Waf1/Cip1 and p27 Kip1, binds to cyclin-CDK complexes and prevents the kinase activation, subsequently blocking the progression of the cell cycle in the G2/M phase. It has been reported that p21Waf1/Cip1, a cyclin-dependent kinase inhibitor regulated by p53, can bind to the CDK1/CDC2-cyclin B1 complex thereby inducing cell cycle arrest [67]. We observed that the expression of p53, p27 Kip1, and p21Waf1/Cip1 was remarkably increased in MCF-7 and MDA-MB-231 cells transfected with miR-3646 inhibitors, which probably contributes to the inhibitory effect of miR-3646 on cell proliferation and the inducing effect on cell cycle arrest in breast cancer cells. These results indicate that upregulation of p53, p21Waf1/Cip1, and p27 Kip1 expression and suppression of CDC2 and cyclin B1 by miR-3646 may result in the G2/M phase arrest in human breast cancer cells.
Furthermore, the cell invasion and migration assay revealed the functional role of miR-3646 in breast cancer metastasis. In the present study, we ectopically raised the miR-3646 level in two breast cancer cell lines to investigate its effect on cell invasion and migration. Consistent with our expectation, increased expression level of miR-3646 markedly promoted cell invasion and migration in both MCF-7 and MDA-MB-231 cells, revealing its potential in oncogenic function in breast cancer progression and metastasis.
In conclusion, we demonstrate for the first time that miR-3646 might regulate a large number of important genes and some cancer-related genes based on our bioinformatics study. MiR-3646 exerts growth-promoting effect in breast cancer cells through regulating G2/M transition. The present results suggest that miR-3646 is critical for the proliferation of breast cancer cells, and understanding the role of miR-3646 may provide important insights into the molecular biology of breast cancer and identify new therapeutic approach.
Acknowledgements
The authors appreciate the financial support from the Startup Fund of the College of Pharmacy of University of South Florida, Tampa, FL 33612 and Ningxia Medical University, Yinchuan, Ningxia 75004, China (grant no.: XT2015025).
Supporting Information
References
- 1.Bray F, Jemal A, Grey N, Ferlay J, Forman D. Global cancer transitions according to the human development index (2008-2030): A population-based study. Lancet Oncol. 2012;13:790–801. doi: 10.1016/S1470-2045(12)70211-5. [DOI] [PubMed] [Google Scholar]
- 2.Ferlay J, Soerjomataram I, Dikshit R, Eser S, Mathers C, Rebelo M, Parkin DM, Forman D, Bray F. Cancer incidence and mortality worldwide: Sources, methods and major patterns in globocan 2012. Int J Cancer. 2015;136:E359–386. doi: 10.1002/ijc.29210. [DOI] [PubMed] [Google Scholar]
- 3.Jia M, Zheng R, Zhang S, Zeng H, Zou X, Chen W. Female breast cancer incidence and mortality in 2011, china. J Thorac Dis. 2015;7:1221–1226. doi: 10.3978/j.issn.2072-1439.2015.05.15. [DOI] [PMC free article] [PubMed] [Google Scholar]
- 4.Chen W, Zheng R, Zeng H, Zhang S, He J. Annual report on status of cancer in china, 2011. Chin J Cancer Res. 2015;27:2–12. doi: 10.3978/j.issn.1000-9604.2015.01.06. [DOI] [PMC free article] [PubMed] [Google Scholar]
- 5.Dib L, Carbone A. Clag: An unsupervised non hierarchical clustering algorithm handling biological data. BMC Bioinformatics. 2012;13:194. doi: 10.1186/1471-2105-13-194. [DOI] [PMC free article] [PubMed] [Google Scholar]
- 6.Gerson KD, Maddula VS, Seligmann BE, Shearstone JR, Khan A, Mercurio AM. Effects of beta4 integrin expression on microrna patterns in breast cancer. Biol Open. 2012;1:658–666. doi: 10.1242/bio.20121628. [DOI] [PMC free article] [PubMed] [Google Scholar]
- 7.Siragam V, Rutnam ZJ, Yang W, Fang L, Luo L, Yang X, Li M, Deng Z, Qian J, Peng C, Yang BB. Microrna mir-98 inhibits tumor angiogenesis and invasion by targeting activin receptor-like kinase-4 and matrix metalloproteinase-11. Oncotarget. 2012;3:1370–1385. doi: 10.18632/oncotarget.717. [DOI] [PMC free article] [PubMed] [Google Scholar]
- 8.Liu SX, Zhang YJ, Guo HF, Hao J, Liu QJ, Liu JR, Guo JW, Liu JH, Zuo LF. The regulatory effect of the p38 signaling pathway on valdecoxib-induced apoptosis of the eca109 cell line. Oncol Rep. 2009;22:313–319. [PubMed] [Google Scholar]
- 9.Steinfeld I, Navon R, Ach R, Yakhini Z. Mirna target enrichment analysis reveals directly active mirnas in health and disease. Nucleic Acids Res. 2013;41:e45. doi: 10.1093/nar/gks1142. [DOI] [PMC free article] [PubMed] [Google Scholar]
- 10.Tang J, Ahmad A, Sarkar FH. The role of micrornas in breast cancer migration, invasion and metastasis. Int J Mol Sci. 2012;13:13414–13437. doi: 10.3390/ijms131013414. [DOI] [PMC free article] [PubMed] [Google Scholar]
- 11.Guo L, Zhao Y, Yang S, Cai M, Wu Q, Chen F. Genome-wide screen for aberrantly expressed mirnas reveals mirna profile signature in breast cancer. Mol Biol Rep. 2013;40:2175–2186. doi: 10.1007/s11033-012-2277-5. [DOI] [PubMed] [Google Scholar]
- 12.van Kouwenhove M, Kedde M, Agami R. Microrna regulation by rna-binding proteins and its implications for cancer. Nat Rev Cancer. 2011;11:644–656. doi: 10.1038/nrc3107. [DOI] [PubMed] [Google Scholar]
- 13.Calin GA, Croce CM. Microrna signatures in human cancers. Nat Rev Cancer. 2006;6:857–866. doi: 10.1038/nrc1997. [DOI] [PubMed] [Google Scholar]
- 14.Dalmay T. Mechanism of mirna-mediated repression of mrna translation. Essays Biochem. 2013;54:29–38. doi: 10.1042/bse0540029. [DOI] [PubMed] [Google Scholar]
- 15.Lu J, Getz G, Miska EA, Alvarez-Saavedra E, Lamb J, Peck D, Sweet-Cordero A, Ebert BL, Mak RH, Ferrando AA, Downing JR, Jacks T, Horvitz HR, Golub TR. Microrna expression profiles classify human cancers. Nature. 2005;435:834–838. doi: 10.1038/nature03702. [DOI] [PubMed] [Google Scholar]
- 16.Banno K, Yanokura M, Kisu I, Yamagami W, Susumu N, Aoki D. Micrornas in endometrial cancer. Int J Clin Oncol. 2013;18:186–192. doi: 10.1007/s10147-013-0526-9. [DOI] [PubMed] [Google Scholar]
- 17.Lujambio A, Lowe SW. The microcosmos of cancer. Nature. 2012;482:347–355. doi: 10.1038/nature10888. [DOI] [PMC free article] [PubMed] [Google Scholar]
- 18.Esquela-Kerscher A, Slack FJ. Oncomirs - micrornas with a role in cancer. Nat Rev Cancer. 2006;6:259–269. doi: 10.1038/nrc1840. [DOI] [PubMed] [Google Scholar]
- 19.Ryan BM, Robles AI, Harris CC. Genetic variation in microrna networks: The implications for cancer research. Nat Rev Cancer. 2010;10:389–402. doi: 10.1038/nrc2867. [DOI] [PMC free article] [PubMed] [Google Scholar]
- 20.Shen F, Cai WS, Feng Z, Li JL, Chen JW, Cao J, Xu B. Mir-492 contributes to cell proliferation and cell cycle of human breast cancer cells by suppressing sox7 expression. Tumour Biol. 2015;36:1913–1921. doi: 10.1007/s13277-014-2794-z. [DOI] [PubMed] [Google Scholar]
- 21.Zhang ZG, Chen WX, Wu YH, Liang HF, Zhang BX. Mir-132 prohibits proliferation, invasion, migration, and metastasis in breast cancer by targeting hn1. Biochem Biophys Res Commun. 2014;454:109–114. doi: 10.1016/j.bbrc.2014.10.049. [DOI] [PubMed] [Google Scholar]
- 22.Bertoli G, Cava C, Castiglioni I. Micrornas: New biomarkers for diagnosis, prognosis, therapy prediction and therapeutic tools for breast cancer. Theranostics. 2015;5:1122–1143. doi: 10.7150/thno.11543. [DOI] [PMC free article] [PubMed] [Google Scholar]
- 23.Casey MC, Sweeney KJ, Brown JA, Kerin MJ. Exploring circulating microrna in the neoadjuvant treatment of breast cancer. Int J Cancer. 2016;139:12–22. doi: 10.1002/ijc.29985. [DOI] [PMC free article] [PubMed] [Google Scholar]
- 24.van Schooneveld E, Wildiers H, Vergote I, Vermeulen PB, Dirix LY, Van Laere SJ. Dysregulation of micrornas in breast cancer and their potential role as prognostic and predictive biomarkers in patient management. Breast Cancer Res. 2015;17:21. doi: 10.1186/s13058-015-0526-y. [DOI] [PMC free article] [PubMed] [Google Scholar]
- 25.Zhang K, Zhao S, Wang Q, Yang HS, Zhu J, Ma R. Identification of micrornas in nipple discharge as potential diagnostic biomarkers for breast cancer. Ann Surg Oncol. 2015;22(Suppl 3):536–44. doi: 10.1245/s10434-015-4586-0. [DOI] [PubMed] [Google Scholar]
- 26.Meiri E, Levy A, Benjamin H, Ben-David M, Cohen L, Dov A, Dromi N, Elyakim E, Yerushalmi N, Zion O, Lithwick-Yanai G, Sitbon E. Discovery of micrornas and other small rnas in solid tumors. Nucleic Acids Res. 2010;38:6234–6246. doi: 10.1093/nar/gkq376. [DOI] [PMC free article] [PubMed] [Google Scholar]
- 27.Betel D, Koppal A, Agius P, Sander C, Leslie C. Comprehensive modeling of microrna targets predicts functional non-conserved and noncanonical sites. Genome Biol. 2010;11:R90. doi: 10.1186/gb-2010-11-8-r90. [DOI] [PMC free article] [PubMed] [Google Scholar]
- 28.Maragkakis M, Alexiou P, Papadopoulos GL, Reczko M, Dalamagas T, Giannopoulos G, Goumas G, Koukis E, Kourtis K, Simossis VA, Sethupathy P, Vergoulis T, Koziris N, Sellis T, Tsanakas P, Hatzigeorgiou AG. Accurate microrna target prediction correlates with protein repression levels. BMC Bioinformatics. 2009;10:295. doi: 10.1186/1471-2105-10-295. [DOI] [PMC free article] [PubMed] [Google Scholar]
- 29.Paraskevopoulou MD, Georgakilas G, Kostoulas N, Vlachos IS, Vergoulis T, Reczko M, Filippidis C, Dalamagas T, Hatzigeorgiou AG. Dianamicrot web server v5.0: Service integration into mirna functional analysis workflows. Nucleic Acids Res. 2013;41:W169–173. doi: 10.1093/nar/gkt393. [DOI] [PMC free article] [PubMed] [Google Scholar]
- 30.Wang X. Mirdb: A microrna target prediction and functional annotation database with a wiki interface. RNA. 2008;14:1012–1017. doi: 10.1261/rna.965408. [DOI] [PMC free article] [PubMed] [Google Scholar]
- 31.Wong N, Wang X. Mirdb: An online resource for microrna target prediction and functional annotations. Nucleic Acids Res. 2015;43:D146–152. doi: 10.1093/nar/gku1104. [DOI] [PMC free article] [PubMed] [Google Scholar]
- 32.Wang X. Improving microrna target prediction by modeling with unambiguously identified microrna-target pairs from clip-ligation studies. Bioinformatics. 2016 doi: 10.1093/bioinformatics/btw002. [Epub ahead of print] [DOI] [PMC free article] [PubMed] [Google Scholar]
- 33.Miranda KC, Huynh T, Tay Y, Ang YS, Tam WL, Thomson AM, Lim B, Rigoutsos I. A patternbased method for the identification of microrna binding sites and their corresponding heteroduplexes. Cell. 2006;126:1203–1217. doi: 10.1016/j.cell.2006.07.031. [DOI] [PubMed] [Google Scholar]
- 34.Bandyopadhyay S, Mitra R. Targetminer: Microrna target prediction with systematic identification of tissue-specific negative examples. Bioinformatics. 2009;25:2625–2631. doi: 10.1093/bioinformatics/btp503. [DOI] [PubMed] [Google Scholar]
- 35.Lewis BP, Burge CB, Bartel DP. Conserved seed pairing, often flanked by adenosines, indicates that thousands of human genes are microrna targets. Cell. 2005;120:15–20. doi: 10.1016/j.cell.2004.12.035. [DOI] [PubMed] [Google Scholar]
- 36.Garcia DM, Baek D, Shin C, Bell GW, Grimson A, Bartel DP. Weak seed-pairing stability and high target-site abundance decrease the proficiency of lsy-6 and other micrornas. Nat Struct Mol Biol. 2011;18:1139–1146. doi: 10.1038/nsmb.2115. [DOI] [PMC free article] [PubMed] [Google Scholar]
- 37.Agarwal V, Bell GW, Nam JW, Bartel DP. Predicting effective microrna target sites in mammalian mrnas. Elife. 2015:4. doi: 10.7554/eLife.05005. [DOI] [PMC free article] [PubMed] [Google Scholar]
- 38.Nam JW, Rissland OS, Koppstein D, Abreu-Goodger C, Jan CH, Agarwal V, Yildirim MA, Rodriguez A, Bartel DP. Global analyses of the effect of different cellular contexts on microrna targeting. Mol Cell. 2014;53:1031–1043. doi: 10.1016/j.molcel.2014.02.013. [DOI] [PMC free article] [PubMed] [Google Scholar]
- 39.Krek A, Grun D, Poy MN, Wolf R, Rosenberg L, Epstein EJ, MacMenamin P, da Piedade I, Gunsalus KC, Stoffel M, Rajewsky N. Combinatorial microrna target predictions. Nat Genet. 2005;37:495–500. doi: 10.1038/ng1536. [DOI] [PubMed] [Google Scholar]
- 40.Dweep H, Sticht C, Pandey P, Gretz N. Mirwalk--database: Prediction of possible mirna binding sites by “walking” the genes of three genomes. J Biomed Inform. 2011;44:839–847. doi: 10.1016/j.jbi.2011.05.002. [DOI] [PubMed] [Google Scholar]
- 41.Dweep H, Gretz N. Mirwalk2.0: A comprehensive atlas of microrna-target interactions. Nat Methods. 2015;12:697. doi: 10.1038/nmeth.3485. [DOI] [PubMed] [Google Scholar]
- 42.Huang da W, Sherman BT, Lempicki RA. Systematic and integrative analysis of large gene lists using david bioinformatics resources. Nat Protoc. 2009;4:44–57. doi: 10.1038/nprot.2008.211. [DOI] [PubMed] [Google Scholar]
- 43.Huang DW, Sherman BT, Tan Q, Kir J, Liu D, Bryant D, Guo Y, Stephens R, Baseler MW, Lane HC, Lempicki RA. David bioinformatics resources: Expanded annotation database and novel algorithms to better extract biology from large gene lists. Nucleic Acids Res. 2007;35:W169–175. doi: 10.1093/nar/gkm415. [DOI] [PMC free article] [PubMed] [Google Scholar]
- 44.Li YC, He SM, He ZX, Li M, Yang Y, Pang JX, Zhang X, Chow K, Zhou Q, Duan W, Zhou ZW, Yang T, Huang GH, Liu A, Qiu JX, Liu JP, Zhou SF. Plumbagin induces apoptotic and autophagic cell death through inhibition of the pi3k/akt/mtor pathway in human non-small cell lung cancer cells. Cancer Lett. 2014;344:239–259. doi: 10.1016/j.canlet.2013.11.001. [DOI] [PubMed] [Google Scholar]
- 45.Wheler JJ, Atkins JT, Janku F, Moulder SL, Yelensky R, Stephens PJ, Kurzrock R. Multiple gene aberrations and breast cancer: Lessons from super-responders. BMC Cancer. 2015;15:442. doi: 10.1186/s12885-015-1439-y. [DOI] [PMC free article] [PubMed] [Google Scholar]
- 46.Matsumoto A, Jinno H, Ando T, Fujii T, Nakamura T, Saito J, Takahashi M, Hayashida T, Kitagawa Y. Biological markers of invasive breast cancer. Jpn J Clin Oncol. 2016;46:99–105. doi: 10.1093/jjco/hyv153. [DOI] [PubMed] [Google Scholar]
- 47.Prisack HB, Karreman C, Modlich O, Audretsch W, Danae M, Rezai M, Bojar H. Predictive biological markers for response of invasive breast cancer to anthracycline/cyclophosphamidebased primary (radio-)chemotherapy. Anticancer Res. 2005;25:4615–4621. [PubMed] [Google Scholar]
- 48.Wang D, Xu J, Shi G, Yin G. Molecular markers’ progress of breast cancer treatment efficacy. J Cancer Res Ther. 2015;11(Suppl 1):C11–5. doi: 10.4103/0973-1482.163832. [DOI] [PubMed] [Google Scholar]
- 49.Sänger N, Engels K, Graf A, Ruckhäberle E, Effenberger KE, Fehm T, Holtrich U, Becker S, Karn T. Molecular markers as prognostic factors in dcis and small invasive breast cancers. Geburtshilfe Frauenheilkd. 2014;74:1016–1022. doi: 10.1055/s-0034-1383033. [DOI] [PMC free article] [PubMed] [Google Scholar]
- 50.Dago DN, Scafoglio C, Rinaldi A, Memoli D, Giurato G, Nassa G, Ravo M, Rizzo F, Tarallo R, Weisz A. Estrogen receptor beta impacts hormone-induced alternative mrna splicing in breast cancer cells. BMC Genomics. 2015;16:367. doi: 10.1186/s12864-015-1541-1. [DOI] [PMC free article] [PubMed] [Google Scholar]
- 51.Sakurai M, Masuda M, Miki Y, Hirakawa H, Suzuki T, Sasano H. Correlation of mirna expression profiling in surgical pathology materials, with ki-67, her2, er and pr in breast cancer patients. Int J Biol Markers. 2015;30:e190–199. doi: 10.5301/jbm.5000141. [DOI] [PubMed] [Google Scholar]
- 52.Patel JB, Patel KD, Patel SR, Shah FD, Shukla SN, Patel PS. Recent candidate molecular markers: Vitamin d signaling and apoptosis specific regulator of p53 (aspp) in breast cancer. Asian Pac J Cancer Prev. 2012;13:1727–1735. doi: 10.7314/apjcp.2012.13.5.1727. [DOI] [PubMed] [Google Scholar]
- 53.Agrawal AK, Jeleń M, Rudnicki J, Grzebieniak Z, Zukrowski P, Nienartowicz E. Molecular markers (c-erbb-2, p53) in breast cancer. Folia Histochem Cytobiol. 2008;46:449–455. doi: 10.2478/v10042-008-0059-7. [DOI] [PubMed] [Google Scholar]
- 54.Dimitrakakis C, Konstadoulakis M, Messaris E, Kymionis G, Karayannis M, Panoussopoulos D, Michalas S, Androulakis G. Molecular markers in breast cancer: Can we use c-erbb-2, p53, bcl-2 and bax gene expression as prognostic factors? Breast. 2002;11:279–285. doi: 10.1054/brst.2002.0445. [DOI] [PubMed] [Google Scholar]
- 55.Utikal J, Abba M, Novak D, Moniuszko M, Allgayer H. Function and significance of micrornas in benign and malignant human stem cells. Semin Cancer Biol. 2015;35:200–11. doi: 10.1016/j.semcancer.2015.07.001. [DOI] [PubMed] [Google Scholar]
- 56.Seven M, Karatas OF, Duz MB, Ozen M. The role of mirnas in cancer: From pathogenesis to therapeutic implications. Future Oncol. 2014;10:1027–1048. doi: 10.2217/fon.13.259. [DOI] [PubMed] [Google Scholar]
- 57.Chan SH, Wang LH. Regulation of cancer metastasis by micrornas. J Biomed Sci. 2015;22:9. doi: 10.1186/s12929-015-0113-7. [DOI] [PMC free article] [PubMed] [Google Scholar]
- 58.Wang Y, Kim S, Kim IM. Regulation of metastasis by micrornas in ovarian cancer. Front Oncol. 2014;4:143. doi: 10.3389/fonc.2014.00143. [DOI] [PMC free article] [PubMed] [Google Scholar]
- 59.Bouyssou JM, Manier S, Huynh D, Issa S, Roccaro AM, Ghobrial IM. Regulation of micrornas in cancer metastasis. Biochim Biophys Acta. 2014;1845:255–265. doi: 10.1016/j.bbcan.2014.02.002. [DOI] [PMC free article] [PubMed] [Google Scholar]
- 60.Ritchie W, Rasko JE. Refining microrna target predictions: Sorting the wheat from the chaff. Biochem Biophys Res Commun. 2014;445:780–784. doi: 10.1016/j.bbrc.2014.01.181. [DOI] [PubMed] [Google Scholar]
- 61.Peterson SM, Thompson JA, Ufkin ML, Sathyanarayana P, Liaw L, Congdon CB. Common features of microrna target prediction tools. Front Genet. 2014;5:23. doi: 10.3389/fgene.2014.00023. [DOI] [PMC free article] [PubMed] [Google Scholar]
- 62.Rogler A, Hoja S, Socher E, Nolte E, Wach S, Wieland W, Hofstädter F, Goebell PJ, Wullich B, Hartmann A, Stoehr R. Role of two single nucleotide polymorphisms in secreted frizzled related protein 1 and bladder cancer risk. Int J Clin Exp Pathol. 2013;6:1984–1998. [PMC free article] [PubMed] [Google Scholar]
- 63.Ward J, Kanchagar C, Veksler-Lublinsky I, Lee RC, McGill MR, Jaeschke H, Curry SC, Ambros VR. Circulating microrna profiles in human patients with acetaminophen hepatotoxicity or ischemic hepatitis. Proc Natl Acad Sci U S A. 2014;111:12169–12174. doi: 10.1073/pnas.1412608111. [DOI] [PMC free article] [PubMed] [Google Scholar]
- 64.Cai J, Wu J, Zhang H, Fang L, Huang Y, Yang Y, Zhu X, Li R, Li M. Mir-186 downregulation correlates with poor survival in lung adenocarcinoma, where it interferes with cell-cycle regulation. Cancer Res. 2013;73:756–766. doi: 10.1158/0008-5472.CAN-12-2651. [DOI] [PubMed] [Google Scholar]
- 65.Molinari M. Cell cycle checkpoints and their inactivation in human cancer. Cell Prolif. 2000;33:261–274. doi: 10.1046/j.1365-2184.2000.00191.x. [DOI] [PMC free article] [PubMed] [Google Scholar]
- 66.Badodi S, Baruffaldi F, Ganassi M, Battini R, Molinari S. Phosphorylation-dependent degradation of mef2c contributes to regulate g2/m transition. Cell Cycle. 2015;14:1517–1528. doi: 10.1080/15384101.2015.1026519. [DOI] [PMC free article] [PubMed] [Google Scholar]
- 67.Sancar A, Lindsey-Boltz LA, Unsal-Kacmaz K, Linn S. Molecular mechanisms of mammalian DNA repair and the DNA damage checkpoints. Annu Rev Biochem. 2004;73:39–85. doi: 10.1146/annurev.biochem.73.011303.073723. [DOI] [PubMed] [Google Scholar]
Associated Data
This section collects any data citations, data availability statements, or supplementary materials included in this article.