Abstract
Although all sensory circuits ascend to higher brain areas where stimuli are represented in sparse, stimulus-specific activity patterns, relatively little is known about sensory coding on the descending side of neural circuits, as a network converges. In insects, mushroom bodies (MBs) have been an important model system for studying sparse coding in the olfactory system1–3, where this format is important for accurate memory formation4–6. In Drosophila, it has recently been shown that the 2000 Kenyon cells (KCs) of the MB converge onto a population of only 35 MB output neurons (MBONs), that fall into 22 anatomically distinct cell types7,8. Here we provide the first comprehensive view of olfactory representations at the fourth layer of the circuit, where we find a clear transition in the principles of sensory coding. We show that MBON tuning curves are highly correlated with one another. This is in sharp contrast to the process of progressive decorrelation of tuning in the earlier layers of the circuit2,9. Instead, at the population level, odor representations are reformatted so that positive and negative correlations arise between representations of different odors. At the single-cell level, we show that uniquely identifiable MBONs display profoundly different tuning across different animals, but tuning of the same neuron across the two hemispheres of an individual fly was nearly identical. Thus, individualized coordination of tuning arises at this level of the olfactory circuit. Furthermore, we find that this individualization is an active process that requires a learning-related gene, rutabaga. Ultimately, neural circuits have to flexibly map highly stimulus-specific information in sparse layers onto a limited number of different motor outputs. The reformatting of sensory representations we observe here may mark the beginning of this sensory-motor transition in the olfactory system.
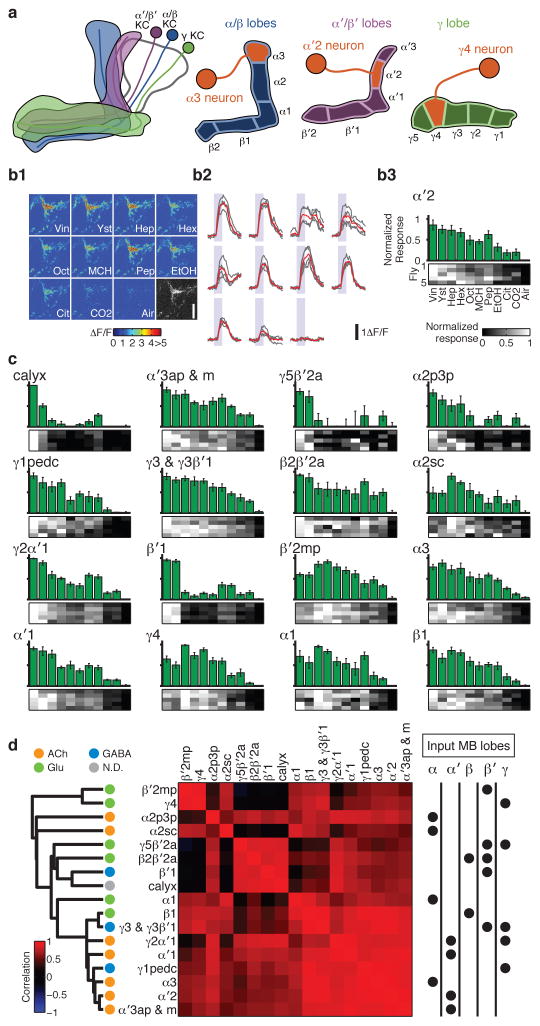
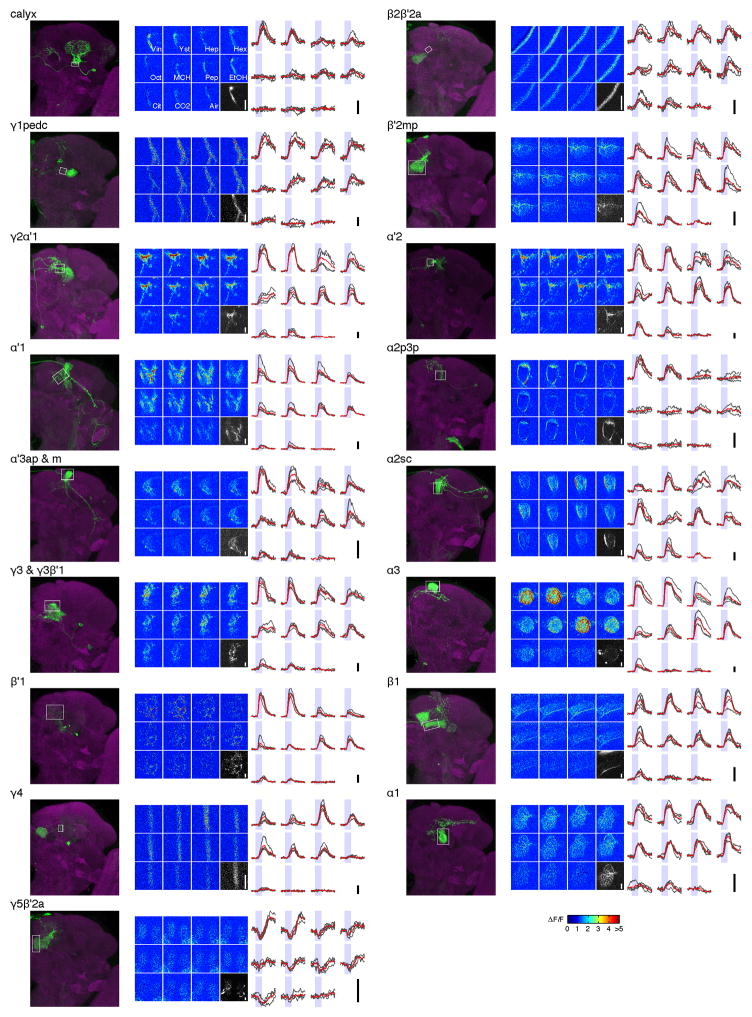
The KC axons are arranged in parallel bundles that form the output lobes of the MB. MBONs extend dendrites into those lobes, with different MBON types innervating distinct subregions7,8 (Fig. 1a). We expressed the calcium sensor GCaMP5 in MBONs using a series of split-GAL4 lines8 (Extended Data Table 1) and measured odor tuning using in vivo two-photon imaging, quantifying response magnitude as the area under the ΔF/F curves (Fig. 1b). The high specificity of these drivers typically enabled us to track activity of individual MBONs. We thereby successfully collected data from 17 types/combination of types of MBONs, covering 19 of 22 cell types (Fig. 1c and Extended Data Figs. 1 and 2; see Methods).
Figure 1. Summary of olfactory tuning patterns in MBONs.
a, Schematic of the KCs and MBONs. b, GCaMP5 imaging in the α′2 neuron. (b1) Example images of the odor responses from axonal arbor. See Methods for abbreviation of odors. Grayscale image, baseline fluorescence. Scale bar, 10 μm. (b2) ΔF/F time courses in the same cell. Gray, individual trials (n = 4). Red, mean. Shaded areas, 2-s odor stimulations. (b3) Odor tuning profiles. Bars, mean (± SEM) normalized tuning (n = 5 flies; see Methods). Heat map, tuning in each fly. c, Odor tuning in the remaining 16 MBON cell types. d, Correlation matrix of tuning patterns of MBONs (Pearson’s r; middle). Cell types are arranged according to the dendrogram (left) based on the correlation distances (1 – r). Neurotransmitters (ACh: acetylcholine, Glu: glutamate, GABA: γ-aminobutyric acid, N.D.: not determined) and the input lobes are indicated by dots.
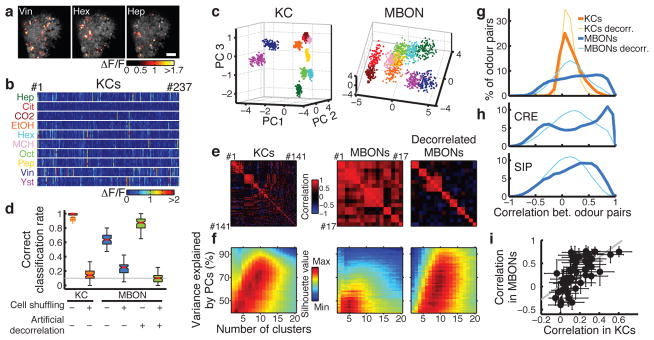
Figure 2. Transformation of population representations from KCs to MBONs.
a, Representative odor responses of KC somata in a single fly with pseudo-colored ΔF/F images overlaid on grayscale basal fluorescence. Scale bar, 20 μm. b, Summary of responses from the fly in a. Columns, KCs. Rows, trials sorted by odors. c, Odor representations in single representative fly (KCs, same fly as a) or virtual fly (MBONs) projected onto the first three principal component axes (100 data points per odor; see Methods). Colors indicate odors as in b. d, Accuracy of odor classification (100 classification scores for both KCs and MBONs; see Methods). Red lines indicate medians, boxes interquartile ranges, notches 95% confidence intervals, whiskers data ranges, and crosses outliers. Gray line, chance level. e, Correlation matrices of tuning curves. Data are from a single representative fly (KCs) or virtual fly (MBONs). f, Clustering analysis of population activity patterns in KCs and MBONs (KCs: n = 10 flies, MBONs: n = 20 virtual flies; see Methods). Highest silhouette values indicate optimal clustering. Silhouette value ranges are, KCs: 0.37–0.84, MBONs: 0.35–0.74, decorrelated MBONs: 0.27–0.65 g, Correlation coefficients (Pearson’s r) of neural representations of ten odors (45 odor pairs), calculated using the response patterns averaged across trials in KCs (n = 10 flies, orange) and MBONs (n = 1000 virtual flies, blue). Mean distributions are shown. Distributions of artificially decorrelated data are in lighter colors. h, Same as g, but for MBON subpopulations with axonal projections to different areas. See also Extended Data Fig. 5. i, Correlation coefficients in KCs and MBONs are positively correlated. Each dot corresponds to correlation coefficient of a specific odor pair (mean ± SD). Gray line, linear regression (R2 = 0.42, p < 10−5).
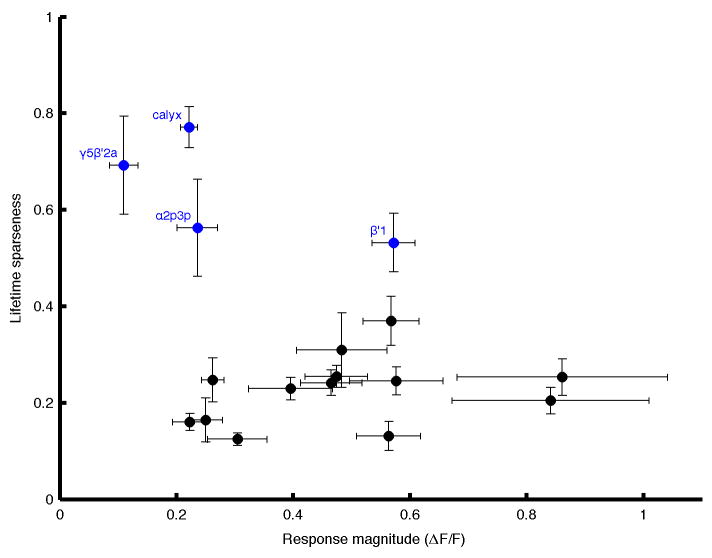
Consistent with high convergence at this stage of the circuit7,8, MBONs were generally broadly tuned to odors, as observed in other insects10–12, although there were a few exceptions (e.g. α2p3p, β′1 and MB-CP1 neurons; Extended Data Fig. 3). In the MBONs with axonal projections inside the MB lobes (β1, γ1pedc, and γ4 neurons), we observed prolonged rise times ( Extended Data Fig. 4).
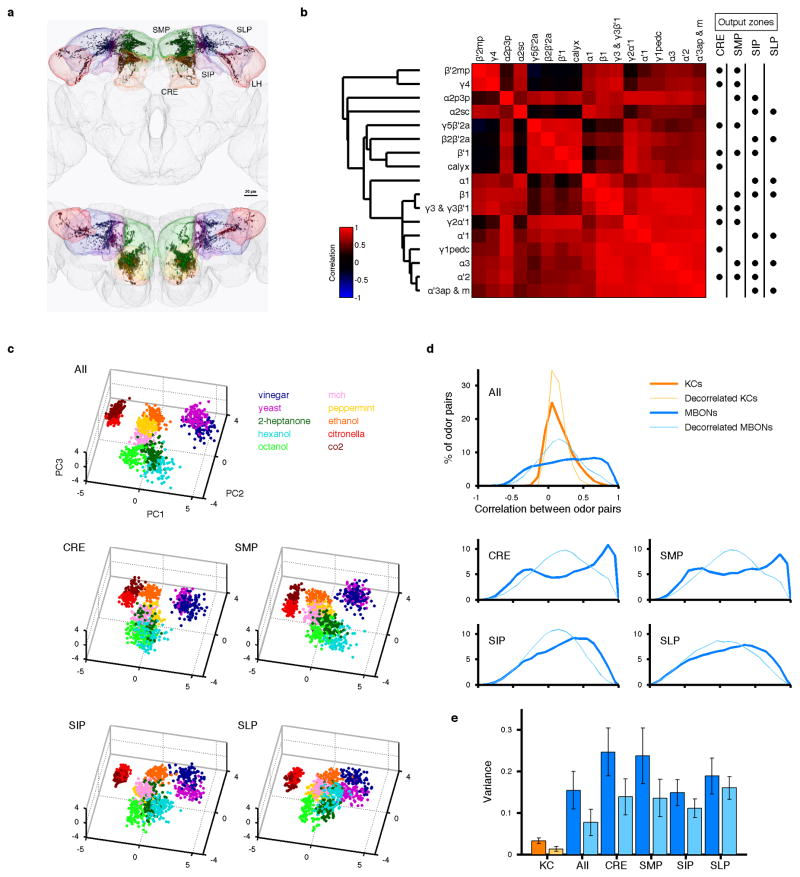
One of the important factors governing the stimulus-specificity of population-level representations is how independent and decorrelated their sensory tuning is. Optimal coding theory dictates that a compact neuronal population most efficiently conveys stimulus-specific information if the tuning properties of different neurons are decorrelated, so the redundancy of their signaling is minimized13, which we refer to as tuning decorrelation. We confine our analysis here to a tuning curve-based view of the system, and do not explore the role that temporal patterning of spikes might play in conveying information, as has been shown in other systems11,14. Overall, odor tuning of the MBON population was notable for its lack of diversity, showing high levels of correlation (Figs 1d and 2e). We found no obvious relationship between the degree of tuning correlation of different MBONs and their type of input KC, the neurotransmitter they release, or where they subsequently project (Fig. 1d and Extended Data Fig. 5a, b).
These highly correlated, dense response patterns were in sharp contrast to the KCs. The calcium responses of KCs to the same set of odors, measured at the cell body layer, were sparse and specific (Fig. 2a, b), with much lower levels of tuning correlation (Fig. 2e). To visualize how odor representations are transformed between the KCs and MBONs, we used principal component analysis (PCA) to represent population response patterns observed on each stimulus trial (Fig. 2c; see Methods and Extended Data Fig. 6). Although different odor clusters were well-separated in the KCs, in MBONs they were much closer to one another and often partially overlapping. Nevertheless, there was a coarse structure to the distribution of different odors, and some were well-separated. This basic structure was conserved when we analyzed subpopulations of MBONs according to their axonal projection sites (Extended Data Fig. 5c). The close proximity of odor clusters visualized by PCA was reflected in a lower score of odor classification analysis in MBONs than KCs (Fig. 2d; see Methods). Importantly, this was not simply caused by the sharp reduction in the number of neurons, or their broad tuning compared to the KCs. When we held cell number and tuning breadth constant, but artificially decorrelated MBON tuning by assigning rearranged odor labels to each cell’s tuning curve, classification accuracy markedly increased (Fig. 2d and e; see Methods). Furthermore, when we examined the number of distinct odor clusters in MBON space, relatively few clusters were apparent, but artificial decorrelation of MBON tuning increased the number of clusters to match the number of odors, just like the KC representations (Fig. 2f; see Methods). These results clearly show that a neuronal population of this size and breadth of tuning is capable of representing odor identity accurately, however the correlations in MBON tuning properties place an important limit on that capacity. We note that it is still possible that specific information about odor identity could be carried in the precise timing of MBON spike trains11,14.
We then asked what features of sensory information become available at this layer. To address this, we calculated the correlations between neural representations of all pairs of odors in KCs and MBONs and compared the distributions (Fig. 2g). In KCs, this distribution showed a single sharp peak near zero, indicating that odor representations are largely decorrelated; in fact, artificially decorrelating KC tuning had little further effect. By contrast, in MBONs correlation coefficients ranged widely without an obvious peak around zero. Both the dense format of MBON representations, as well as the pattern of activity contribute to this distribution shape, since artificially decorrelating MBON tuning properties resulted in a wider distribution than in the KCs, but now with a clear peak around zero (Fig. 2g and Extended Data Fig. 5e). Some of the relationships between odors are partially inherited from previous layers of neurons, because we observed a significant positive correlation between correlation coefficients in KCs and in MBONs (Fig. 2i). Notably, negative correlations between different odor representations, a rare feature in KCs, become relatively common in MBONs, especially in MBON subpopulations with axonal projections to particular downstream areas (Fig. 2h and Extended Data Fig. 5d). Thus, it appears that MBONs convey a sense of interrelationship between odors, be it positive or negative. In this context, it is interesting to note that two odor groups of opposite valence were reliably the most distantly located in MBON coding space (Fig. 2c and Extended Data Fig. 5c) and were never misclassified with each other (Extended Data Fig. 7). One of those groups was apple cider vinegar and yeast, which are attractive food odors for Drosophila15,16. The other was CO2 together with citronella, which are both reported to be natural repellents to Drosophila17,18.
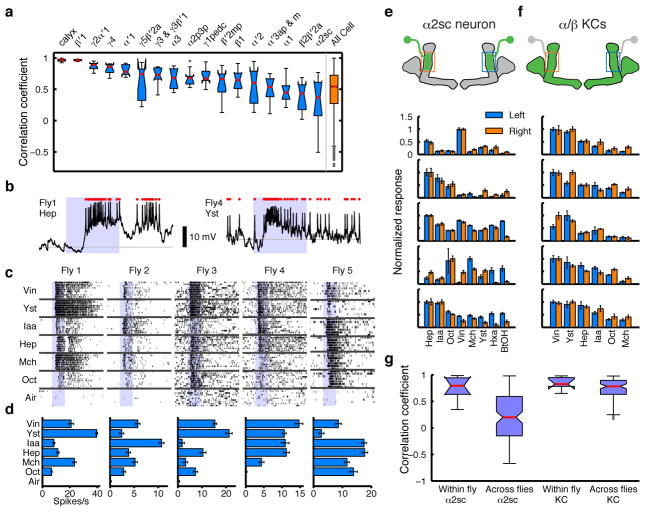
We next focused on odor tuning properties at the single-cell level. Specifically, we asked whether cell types with uniquely identifiable anatomy also have consistent tuning properties in different animals. Such functional stereotypy is readily apparent in the projection neurons (PNs) at the second layer of the circuit19,20. In MBONs, by contrast, we observed a range of similarity in tuning across animals depending on cell types (Fig. 3a). Some MBONs showed highly consistent responses, however several had very diverse tuning. Among all the MBONs, the α2sc neuron exhibited the greatest variability. This was not due to ambiguity in cell identification, since there is only one α2sc neuron per hemisphere8. Moreover, a similar level of inter-animal variability was also observed with whole-cell recordings (Fig. 3b–d).
Figure 3. Individualization of tuning in MBONs.
a, Correlations of MBON tuning patterns across different flies (n = 5 flies for each cell type). b, Sample traces from whole-cell recordings from α2sc neurons. Red dots, spikes. Shaded areas, 1-s odor presentations. c, Raster plots of α2sc odor responses. d, Tuning curves (mean ± SEM) from c. e, Odor tuning of pairs of α2sc neurons on the left and right hemispheres of five representative flies, from GCaMP5 imaging (normalized to the strongest response, mean ± SEM). f, α/β KC population tuning across different hemispheres of the same fly, recorded at the α2 region of the MB lobes. g, Tuning patterns of α2sc neurons from different hemispheres of the same fly are more correlated than those from different flies (n = 8 flies, p < 10−4, Tukey’s post hoc test following two-way ANOVA). Correlations of KC population tuning were indistinguishable within versus across flies (n = 7 flies, p > 0.95, Tukey’s post hoc test). Interactions between cell types (α2sc versus KCs) and comparison types (within versus across flies) were significant (p < 0.05, two-way ANOVA).
Tuning patterns of individual KCs are not stereotyped across animals20, which likely arises from the probabilistic input connectivity of the PNs21,22. Is the variability in MBON tuning simply inherited from the probabilistic organization of the previous layer? If so, tuning properties of MBONs should be as variable across hemispheres in the same brain as they are across different animals. However, this was clearly not the case. Pairs of α2sc neurons from opposite sides of the same brain exhibited strikingly similar tuning compared to those from different brains (Fig. 3e and g). We observed similar results in three other MBON types (Extended Data Fig. 8). Thus, tuning patterns of MBONs are individual-specific as a result of a process that is coordinated across hemispheres, rather than random wiring patterns.
We next set out to ask how this functional individuality of the circuit arises at the level of MBONs. The dense dendritic arbor of the MBONs implies that MBONs summate input from many KCs7,23. If so, does the variable tuning of MBONs derive from variable overall levels of population activity in KCs? However, while tuning profiles of individual KCs are not predictable20–22, the summed output from the overall KC population could be consistent across animals, since PNs from different glomeruli have relatively stereotyped numbers of output terminals in the MB, suggesting total excitatory drive to the KCs may be characteristic for each odor24,25. Furthermore, the number of responding KCs for a given odor is positively correlated with the total activity of olfactory receptor neurons responding to that odor3. To directly examine the variability of bulk MB output, we imaged calcium responses in the KC axon bundle at the site where it contacts the α2sc neuron. We found that the tuning of the bulk KC population was relatively consistent from fly to fly, in contrast to the α2sc neuron (Fig. 3f and g). We thus found no sign of individuality in the summed activity of the KCs. But then, why do MBONs, thought to receive heavily convergent input from KCs, not end up with stereotyped tuning patterns? To better understand how KC activity is integrated by MBONs, we measured functional connectivity between α/β KCs and α2sc neurons by paired whole-cell recordings (Fig. 4a and b). Surprisingly, we found only 7 pairs out of 24 with an excitatory connection, only 5 of which were likely monosynaptic (Fig. 4c, d and Extended Data Fig. 9; see Methods). This gives a probability of connection of < 30%, far more selective than the all-to-one convergence suggested by the dendritic anatomy. Thus, our results suggest that α2sc neurons are capable of extracting very different information in different animals, even from presynaptic KCs that have similar overall population tuning, through individual-specific connectivity with KCs.
Figure 4. Connection probability between KCs and a MBON.
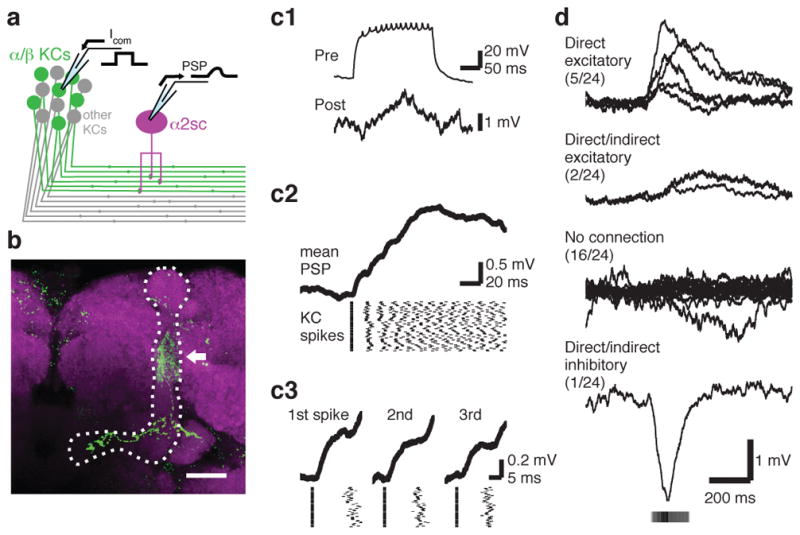
a, Schematic of paired whole-cell recording. b, Post hoc immunohistochemistry of biocytin infused via whole-cell electrodes (green, maximum intensity projection). Axon of α/βKC, extending within α/βlobes (dotted line), and dendritic arbor of α2sc neuron (arrow) are visible. Magenta, anti-nc82 antibody. Scale bar, 20 μm. c, A directly connected KC-α2sc neuron pair. (c1) A train of KC spikes (Pre) and the evoked response in a α2sc neuron (Post) recorded simultaneously. (c2) Discrete EPSP steps visualized by spike-trigger-averaging MBON membrane potential on the first KC spike of each trial. (c3) Enlarged spike-trigger-averaged EPSPs for the first, second and third spikes in the train reveal a short synaptic delay (< 2 ms). d, The four categories of synaptic connectivity (see Methods). The first-spike-trigger-averaged responses for all pairs in each category are overlaid. Timing of the KC spikes is indicated by grayscale bar, whose intensity shows the mean relative spike rate.
One process that could plausibly underlie such flexible wiring is synaptic plasticity; indeed plasticity has been observed at this synapse in other insects26. To test this we examined whether Rutabaga, an adenylyl cyclase required for learning4, is involved in generating the cross-fly differences in tuning. In rutabaga mutants, across-fly tuning variability of the α2sc neurons was markedly reduced, and there was no longer a significant difference between within- and across-fly correlations (Fig. 5). Thus the cross-fly differences in this neuron are the result of an active process that requires rutabaga signaling. However, rutabaga-dependent plasticity does not seem to be the sole determinant of the MBON tuning because the relatively stereotyped MBON tuning in the mutants is still different from the bulk KC tuning (Fig 3f). Rutabaga may also contribute to the coordination of tuning across hemispheres, since within-animal correlations in the mutants tend to be lower than in controls, although this difference was not statistically significant.
Figure 5. Cross-individual variability is lost in rutabaga mutants.
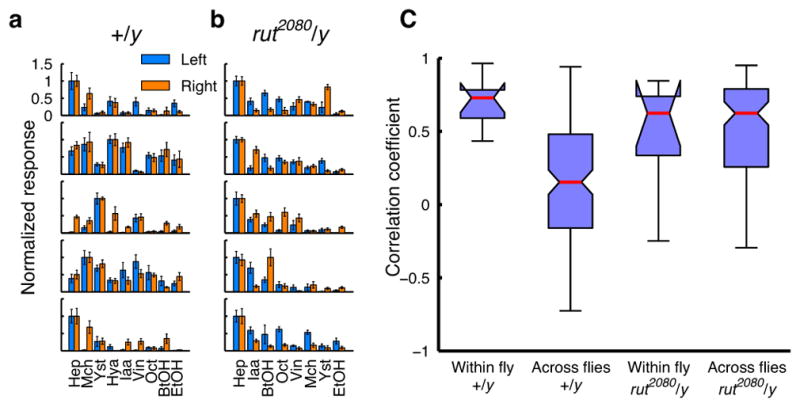
a, Odor tuning of a pair of α2sc neurons on the left and right hemispheres in the same fly, recorded with GCaMP5 imaging (mean ± SEM). Data from five wild-type males. b, Same as a but rut2080 males. c, Control males show higher variability across flies than within flies (n = 9 flies, p < 10−4, Tukey’s post hoc test following two-way ANOVA). This difference is lost in rut2080 hemizygous males, which show similar levels of variability both within and across flies (n = 8 flies, p > 0.995, Tukey’s post hoc test). Interactions between the genotypes and comparison types (within versus across flies) were significant (p < 0.005, two-way ANOVA). Within-fly tuning correlations were not statistically different between the two genotypes (p > 0.65, Tukey’s post hoc test).
This work presents the most complete population-level characterization of tuning at any layer of the olfactory system. This extensive coverage of the population, combined with our back-to-back comparison to the previous layer, enabled us to demonstrate that the progressive decorrelation of neuronal tuning that marks the ascending layers of the sensory circuit2,9 comes to an end immediately downstream of the KCs, as the network converges. Fine temporal patterns of spiking, or subtle correlations in signaling across multiple MBONs within each animal, neither of which we could detect here, could contribute to the specificity of odor representations (but see Extended Data Fig. 6). Nevertheless, our results clearly show that positive and negative correlations arise in MBONs, clustering some odor representations together and pushing others apart. This grouping might be useful when it comes to making a behavioral choice, since the general categorization of stimuli, rather than detailed, stimulus-specific information would be more important at this stage. Thus, MBON representations may be well-suited to control motor outputs27. Interestingly, similarly prominent network convergence occurs with cortical projections to the basal ganglia28, whose main function is to select an appropriate action plan by interpreting the available sensory information.
The plasticity-driven individualized tuning of MBONs is a counterpoint to the highly stereotyped responses of the output neurons of the lateral horn (LH), an olfactory center that lies in parallel with the MB29 and is implicated in innate responses to odor30. In contrast, the influence of plasticity on MBON tuning highlights the flexibility of this branch of the circuit, where odor representations could be reshaped either to fine tune, or perhaps to override the innate responses driven by the LH pathway, reflecting each fly’s individually unique olfactory experience.
Methods
Fly Stocks
Flies were raised at room temperature on conventional cornmeal-based medium. All experiments were performed on adult females, 2–5 days post-eclosion, unless otherwise noted. Note that we used the same animal-rearing conditions for all flies when we examined the variability of tuning across different flies, and that we always compared flies of same gender. In several cases, we even recorded on the same day from progeny of the same cross, raised in the same food vial. No randomization or blinding methods were used. For calcium imaging, flies bearing UAS-GCaMP6f (ref. 31; KC cell body imaging) or GCaMP5 (ref. 32; MBON and KC axon imaging) were crossed with appropriate GAL4 or split-GAL4 lines, and the resulting F1 flies were used. We used OK107-GAL4 (refs. 33,34) for KC imaging (both cell body and lobe imaging) and a series of split-GAL4 lines for MBON imaging8 (Extended Data Fig. 2; Extended Data Table 1; see also http://www.janelia.org/split-gal4 for the expression patterns as well as enhancer fragments used to construct these split-GAL4 lines). For experiments in rutabaga mutants, we utilized the fact that rutabaga is X-linked. rut2080 (ref. 35) females were crossed with UAS-GCaMP5; MB080C males, and their male progeny, hemizygous for rut2080, were used for imaging. For electrophysiological recording from the α2sc neuron, we crossed UAS-2eGFP with MZ160-GAL4 (ref. 36). For dual whole-cell recording from α/β KCs and the α2sc neuron, we crossed UAS-2eGFP; MZ160 with c739, an α/β-specific driver34,37. UAS-GCaMP flies were kindly provided by Vivek Jayaraman, rut2080 and c739 by Joshua Dubnau and MZ160 by Kei Ito. UAS-2eGFP was obtained from the Bloomington stock center.
Nomenclature of MBONs
The set of 21 cell types of MBONs from the MB lobes and one from the calyx are defined by their morphology, having dendrites inside the MB and axonal projections elsewhere8. For simplicity, in this paper we call each MBON according to its dendritic region in the MB lobes, such as α1, γ5β′2a and so on (Extended Data Table 1).
Odor Delivery
The following monomolecular odorants were purchased from Sigma and used as stimuli: 2- heptanone (Hep; CAS# 110-43-0), 1-hexanol (Hex; 111-27-3), 3-octanol (Oct; 589-98-0), 4-methylcyclohexanol (MCH; 589-91-3), ethanol (EtOH; 64-17-5), isoamyl acetate (Iaa; 123-92-2), 1-hexanal (Hxa; 66-25-1), 1-butanol (BtOH; 71-36-3) and hexyl acetate (Hya; 142-92-7). We also used natural essential oils from peppermint (Pep) and citronella (Cit; Aura Cacia) as well as other natural odors, apple cider vinegar (Vin; Richfood) and yeast (Yst; Lessafre). In imaging experiments, odors were presented through a custom-built device as described previously3. 40-ml vials were loaded with 5-ml pure odorants, except for essential oils, which were diluted with mineral oil at 1:100. Yeast was prepared by adding 5 ml distilled water to 1 g dry yeast. Saturated headspace vapors were diluted by two steps of air dilutions down to 10% (experiments in Figs 1–3a) or 5% (other experiments). CO2 was directly taken from the house-line and presented at 1%. Final flow rate of the air stream was set to 0.4 L/min (experiments in Figs 1–3a) or 1 L/min (other experiments) with a final tubing size of 1/16 inch (inner diameter). Stability and reproducibility of the stimuli were continuously monitored throughout the experiments using a photo-ionization detector (PID; Aurora Scientific). A slightly different odor delivery system was used for electrophysiological experiments, in which air dilution was only one step and the odorants were diluted with mineral oil. Odor concentrations were adjusted to be equivalent to the 5% dilution used in imaging experiments, as confirmed by PID measurements. Final flow rate was 1 L/min. For all experiments, odors were presented in a pseudo-random order so that no odor was presented twice in succession.
Calcium Imaging
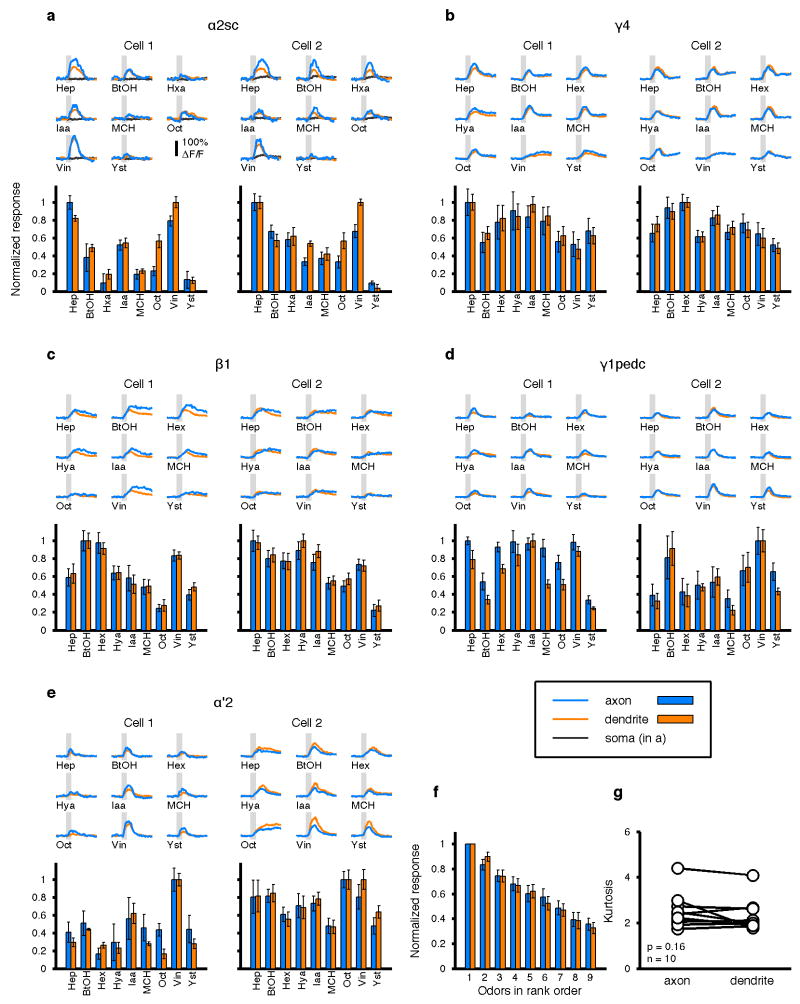
In vivo two-photon calcium imaging was performed as described previously3 using a Prairie Ultima system (Bruker) and a Ti-Sapphire laser (Chameleon XR; Coherent) tuned to 920 nm (6–10 mW at the sample). All images were acquired with 40× water-immersion objective (LUMPlanFl/IR, numerical aperture 0.8; Olympus). The preparation was continuously perfused with saline containing (in mM): NaCl, 103; KCl, 3; CaCl2, 1.5; MgCl2, 4; NaHCO3, 26; N-tris(hydroxymethyl)methyl-2-aminoethane-sulfonic acid, 5; NaH2PO4, 1; trehalose, 10; glucose, 10 (pH 7.3 when bubbled with 95% O2 and 5% CO2, 275 mOsm). When measuring odor tuning in MBONs, we aimed to separate signals from as many MBON types as possible, preferably at axons. However, many of the MBONs send their axons bilaterally in a symmetric manner. In these cases, even if the labeling in the split-GAL4 line is confined to a single cell in each brain hemisphere, it was often difficult to image a single axon because the symmetric axonal projections were extensively intertwined in a tight helical structure. Imaging at the dendrites was often advantageous to unambiguously assign signals to individual MBONs. Therefore we performed a series of pilot experiments to examine calcium responses in different cellular compartments. In the α2sc neuron, we noticed that in some experiments there was almost no calcium response to any odor at the cell body (Extended Data Fig. 1a), while we had observed spiking responses to every odor in every whole-cell recording from this neuron (Fig. 3c). This disconnect is presumably attributable to low expression of voltage-gated calcium channels at the soma and/or to the extremely long primary neurite connecting the soma to the axon and dendrites. On the other hand, calcium responses at dendrites and axons were consistently observed even when there was no somatic response (Extended Data Fig. 1a).
Notably, the time course and the magnitude of the responses were largely similar between the dendrite and axon in the same neuron. We tested how general this was across different MBONs by comparing calcium responses in axons and dendrites in five different cell types. These five types were all the ones in which we could distinguish both axonal and dendritic signals for individual neurons (Extended Data Fig. 1a–e). In all cases, the responses were highly similar (Pearson’s r = 0.92 ± 0.013, mean ± SEM; n = 10 cells). Furthermore, tuning breadths were also identical (Extended Data Fig. 1f, g). Therefore, to measure tuning curves in MBONs, we imaged at either dendrite or axon, whichever maximized the isolation of signals from the MBON of interest (Extended Data Fig. 2; Extended Data Table 1), except for Extended Data Figs 1 and 8. KC imaging was performed at the cell body layer as described previously5. In both cases, imaging frames were typically 300 × 300 pixels, acquired with a pixel dwell time of 1.6 μs, yielding frame rates around 4 Hz, which slightly varied across experiments depending on the optical zoom factor. For each odor presentation trial, data were acquired for 20 s with an odor pulse (2 s in duration for experiments in Figs 1–3a, 1 s for other experiments) triggered 8 s after trial onset. Inter-stimulus interval was 25 s. When we compared tuning patterns of α2sc neurons across hemispheres, we imaged the two hemispheres sequentially rather than simultaneously, so stimulus presentations were independent across the two recordings. This ensured that the higher correlations we observed within animals could not be attributed to noise correlations, i.e. coordinated changes in neuronal responses based on momentary fluctuations in the internal state of the animal, such as its level of arousal38.
Electrophysiology
Previously reported methods for in vivo whole-cell recordings in PNs19 were adapted for MBONs and KCs. The patch pipettes were pulled for a resistance of 4–5 MΩ (MBON) or 6–7 MΩ (KC) and filled with pipette solution containing (in mM): L-potassium aspartate, 125; HEPES, 10; EGTA, 1.1; CaCl2, 0.1; Mg-ATP, 4; Na-GTP, 0.5; biocytin hydrazide, 13; with pH adjusted to 7.3 with KOH (265 mOsm). Bath solution was the same as in imaging experiments. Single or dual whole-cell current-clamp recordings were made using the Axon MultiClamp 700B amplifier (Molecular Devices). Cells were held at around 60 mV by injecting hyperpolarizing current (< 20 pA for MBONs, < 5 pA for KCs). Signals were low-pass filtered at 5 kHz and digitized at 10 kHz. Specific cell types were visually targeted by GFP signal with a 60× water-immersion objective (LUMPlanFl/IR; Olympus) attached to an upright microscope (BX51WI; Olympus). Although MZ160-GAL4 labels multiple types of MBONs in the MB-V2 cluster, we were typically able to distinguish the α2sc neuron, which is a single unique neuron8, from the others based on the distinct size and location of its cell body. The morphology of all recorded cells, both α2sc neurons and α/β KCs, were visualized by post hoc immunohistochemistry with biocytin19; any data from incorrectly targeted cells were discarded.
In dual whole-cell recording from α/β KCs and the α2sc neuron, we took several steps to maximize the chance of detecting weak connections. Since KCs are immunonegative for choline acetyltransferase39,40 and unlikely to be cholinergic41,42, we applied the cholinergic blocker mecamylamine (100 μM) to the bath saline to minimize unrelated circuit activity that could obscure weak connections. In addition, we tested for connections using current injection (25.2 ± 5.5 pA, 175 ± 9.0 ms, mean ± SEM) to drive high frequency spike trains in the KCs (10.6 ± 0.8 spikes, mean ± SEM).
Data Analysis
All data analyses were performed in MATLAB (R2008b, MathWorks). All sample sizes were enough for robust statistical tests, which are appropriately chosen based on the distribution of data.
Imaging
For the analysis of MBONs, a region of interest (ROI) was manually set for each trial based on the mean baseline image. Response magnitudes were calculated as the integrated fluorescence change (ΔF/F) in the time window between stimulus onset and 5 s after stimulus offset. Analysis of KC imaging required motion corrections and frame alignments in order to retain the identity of each ROI (i.e. each KC cell body) throughout a whole imaging session, as described previously3,5. For the measurement of tuning similarity, we used Pearson’s correlation coefficient. When we used Euclidean distance instead, the results of the statistical tests remained the same in all cases (data not shown) except for one case (Extended Data Fig. 8e), where we did not detect a significant difference with the Euclidean distance measurement (data not shown).
Electrophysiology
Spikes were automatically detected by custom-written scripts based on amplitude, after removing slow membrane potential deflections with a high-pass filter, and verified by visual inspection. Response spike rates were calculated in a window of 0.5–3.5 s after odor valve opening, and baseline spike rates were subtracted. To calculate the statistical significance of a connection between an α/β KC and an α2sc neuron, we determined the difference between the mean α2sc membrane potential during the KC spike train and during the baseline period on each individual trial (51 ± 4 trials per pair), and used a t-test with a threshold significance value of p < 0.05. Out of 24 pairs recorded, we found only eight statistically significant postsynaptic responses. Five pairs were judged as monosynaptically connected because step-wise increments in membrane potential were obvious in spike-trigger-averaged traces and also because the delay between the KC spike and the onset of the EPSP was less than 2 ms (Extended Data Fig. 9a and d). In two other pairs, we observed smaller excitatory responses but could not detect unitary steps for each spike, even in spike-trigger-averaged traces (Extended Data Fig. 9b). Such connections could be either direct excitatory connections with unitary strength smaller than our detection limit or indirect feed-forward connections. The one remaining connection we found was, to our surprise, inhibitory (Extended Data Fig. 9c). The synaptic delay was too long for a monosynaptic connection via ionotropic transmission, suggesting that it represents a powerful feed-forward inhibitory connection. However, it remains possible that it is a monosynaptic connection with facilitatory synapses or slow metabotropic input. Although we cannot rule out the possibility that we are missing some extremely weak connections, we consider this unlikely given our experimental approach, namely quietening spontaneous network activity by blocking cholinergic transmission and then driving high frequency spike trains in the presynaptic KC (see the section above for details). Even if we assume that some connections went undetected, our results would nevertheless indicate that synaptic weights of KC- α2sc connections are highly heterogeneous, since some connections were strong enough for us to detect clear unitary synaptic events. Thus, in any case our results indicate that connectivity between α/β KCs and α2sc neurons is highly selective.
Population Coding Analyses
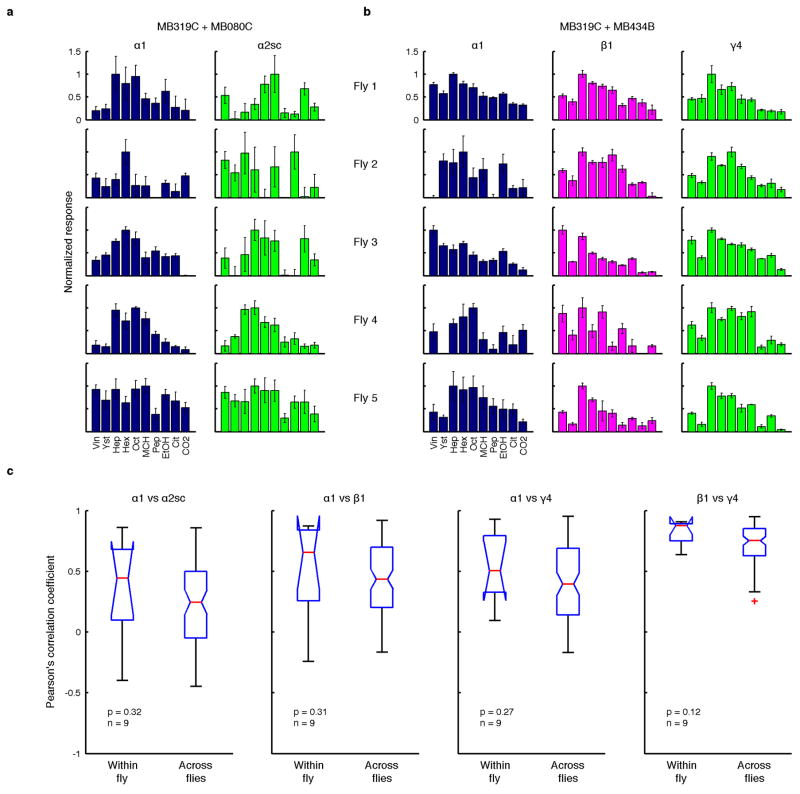
To compare population coding in KCs and MBONs, we represented the odor response patterns from each stimulus trial as a point in an N-dimensional neuronal coding space, where each of the axes represents the response magnitude of each neuron. For KC representations, each axis corresponded to one of the KCs imaged in one fly. For MBONs, since different cell types were imaged in different flies, we combined data from 17 different flies to produce an aggregate MBON population reflecting activity in a single “virtual fly”. Since we have recordings from 5 flies for each type of MBON, by combining different recordings we can construct many different virtual flies; one example is shown in Fig. 2c. This approach assumes that there is no specific correlation between the tuning patterns of different cell types in the same animal. However, if different MBON types tended to be positively or negative correlated in individual flies, that could have an impact on the odor-specific information available in population-level activity patterns, which we would have overlooked by analyzing virtual flies. To test whether this was the case, we imaged multiple types of MBONs in the same animal by combining different split-GAL4 drivers (Extended Data Fig. 6). We compared tuning patterns in four pairs of cell types. These pairs included MBONs receiving input from the same MB lobe (α1 vs α2sc), those with input from the same types of KCs (α1 vs β1), and those with input from different types of KCs (α1, β1 vs γ4), as well as MBONs with relatively higher variability of tuning across flies (α1 and α2sc; Fig. 3a). In no case did we find that the correlation of tuning within an animal was significantly different from the correlation across different animals (Extended Data Fig. 6). This result justifies using virtual flies to analyze MBON population representations. Each recording consisted of 4–7 trials per odor, so for virtual flies, we generated random combinations of those trials by bootstrapping. For example we generated 100 bootstrapped trials in one virtual fly for the display in Fig. 2c. On the other hand, we could not combine KC data from multiple flies because, unlike MBONs, the identities of KCs cannot be matched up between different flies. To make our analysis of the KC population similar to the MBONs, we also applied trial bootstrapping to the KC data, so that noise correlations, absent from the individually recorded MBON data, are also not present in the KCs.
Odor Classification
For odor classification analysis, we adopted a linear classification algorithm based on Euclidean distances between odor representations in neuronal coding space. Odor-evoked activity patterns for each bootstrapped trial, generated as described above, were represented as points in this coding space, and the centroids of the points corresponding to each of the ten test odors were calculated. The data point for each trial was then classified as the odor with the nearest centroid. In order to avoid overfitting, the following two steps were implemented. First, when calculating centroid locations, the trial of interest was removed from the dataset (leave-one-out cross validation). Second, when generating bootstrapped trials, the same trial was selected only once in a given dataset. Since the number of trials in each recording was 4–7, we generated only 4–7 bootstrapped trials at a time. For KCs, we repeated this process 10 times per fly (n = 10 flies), yielding 100 classification scores in Fig. 2d. For MBONs, we generated one combination of bootstrapped trials for each virtual fly, and repeated this in 100 different virtual flies, again yielding 100 data points for Fig. 2d. To artificially decorrelate tuning profiles across MBONs, we shuffled odor labels for each cell’s data, which breaks up any tendency for odors to evoke similar responses in different MBONs. These newly assigned odor labels were fixed and used for the subsequent classification analysis with same nearest-centroid approach described above. This whole process, shuffling odors, determining centroids and then testing classification, was carried out 100 separate times to obtain the 100 classification scores plotted in Fig. 2d. When neuron labels are shuffled between trials, classification accuracy dropped to near chance level, indicating that patterns of activity are important for classification in both cases. They did not drop all the way to chance because different odors evoke different overall levels of activity, which also contributes information about odor identity; this is eliminated by additionally shuffling odor labels (Fig. 2d).
Cluster Analysis
For cluster analysis (Fig. 2f), we employed the k-means clustering algorithm. K-means clustering is an unsupervised clustering method that allows us to partition data points into arbitrary number of clusters such that the total distance from the individual points to their cluster centroids is minimized. The quality of such clusters can be evaluated by the mean silhouette value of the all data points43. The silhouette value (ranging from −1 to 1) for the i-th data point can be calculated as s(i) = (b(i) – a(i))/max{a(i), b(i)}, where a(i) is the average distance to the other points in the same cluster, and b(i) is the average distance to the points in the closest neighboring cluster. Thus, if data points form compact clusters that are well separated from each other and are appropriately partitioned, the mean silhouette value approaches 1. On the other hand, if clusters are diffuse and/or overlapping each other, a lower value is obtained, even when the clusters are optimally partitioned. In addition, even when there are nicely separated compact clusters, it gives a lower value if the partitioning pattern is inappropriate (e.g. dividing one cluster into halves or combining two clusters to one). Thus, by using k-means to explore a wide-ranging number of clusters (2 to 20), and searching for the partitioning that gave the highest silhouette value, we were able to determine the optimal number of clusters in MBON and KC odor representations. We examined the clustering in the data with different dimensionalities by gradually increasing the number of principal components (PCs) for the projection. To make the analysis comparable between KCs and MBONs, which consist of profoundly different numbers of cells, we matched the total fraction of variance captured as we increased dimensionality, rather than directly increasing the number of PCs. In other words, we increased dimensionality by using a sufficient number of PCs to capture the same amount of variance in KC and MBON populations. Cluster quality quickly diminished when too many PCs were added. This is presumably because these later PCs mainly contained noise rather than signals related to odors, which would simply make existing clusters more diffuse in higher-dimensional space. We used built-in functions of MATLAB to perform PCA and k-means clustering as well as to calculate silhouette values.
Extended Data
Extended Data Figure 1. Comparison of odor-evoked calcium responses across multiple cell compartments.
a, Odor responses were sequentially recorded at three different compartments (axon, blue; dendrite, orange and soma, black) in two different α2sc neurons with GCaMP5 imaging. Upper subpanel shows mean ΔF/F traces from different compartments (4 or 5 trials for each). Shaded areas indicate 1-s odor stimulations. Lower subpanel shows tuning profiles in axon and dendrites (normalized to the strongest response, mean ± SEM). Note that the time course, response magnitude and tuning profiles are largely consistent between the axon and dendrite in the same cell, while signals at the soma are small and slower (Cell2) or sometimes undetectable (Cell1). b–e, Data from 4 other types of MBONs. Scale of the traces is the same as a. Correlation between axons and dendrites is 0.92 ± 0.013 (Pearson’s r, mean ± SEM; n = 10 cells). f, Mean normalized tuning of the ten cells. Odors are sorted according to the rank order in each cell to visualize the tuning width. g, Kurtosis of tuning curves. There was no difference between axons and dendrites (p = 0.16, paired t-test).
Extended Data Figure 2. Raw traces of calcium imaging in MBONs.
For all 17 types/combination of types of MBONs, we show a projection image of confocal stacks from split- GAL4 lines (left), example ΔF/F images of the calcium responses to ten odors and air (middle) and ΔF/F time courses (right). Note that all the split-GAL4 lines used in this study label the target MBONs with extremely high specificity. The white squares indicate the approximate region scanned during calcium imaging. Grayscale images show baseline fluorescence (scale bar, 5 μm), while colormap images represent calcium responses (ΔF/F, color scale bottom right). Traces showing ΔF/F time courses on individual trials (gray; n = 4–7) are overlaid with the mean (red), scale bar, 50% ΔF/F.
Extended Data Figure 3. Relationship between response intensity and tuning selectivity.
Lifetime sparseness, an index of tuning selectivity1,44, was plotted against the magnitude of the largest odor response observed for each neuron (mean ΔF/F during the response window). Each dot corresponds to one of the 17 MBON types (mean ± SEM; n = 5 flies). There was no correlation between the two variables (Spearman’s ρ = 0.16, p = 0.54). Thus, the relatively selective tuning patterns observed in four MBONs (blue) are likely not related to the intensity of the response. Rather, for three of these cells, we noticed that their narrow tuning was accompanied by unusual dendritic anatomy. β′1 neuron is the only MBON with extensive dendritic processes outside the MB, and calyx neuron (MB-CP1) is the only MBON that samples from the MB calyx. α2p3p neuron’s dendrites seem to contact solely the α/βp KCs, whose dendrites arborize in the sub-region of the MB calyx known as the accessory calyx, where no olfactory input has been reported7. The narrow tuning patterns of the fourth neuron, γ5β′2a, seem to be related to the transient inhibitory epochs uniquely observed in this neuron (Extended Data Fig. 4).
Extended Data Figure 4. Diversity in response time courses across the MBON population.
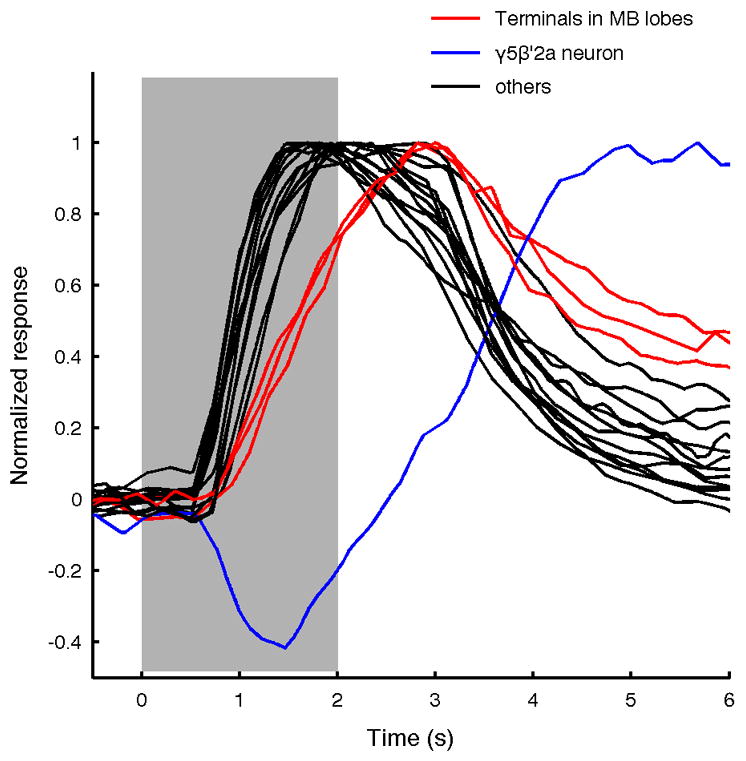
Normalized mean ΔF/F responses to yeast odor for all MBON types overlaid (shading indicates timing of odor presentation). Note that three MBONs (β1, γ1pedc, and γ4) that have axonal terminals in the MB lobes show slower time courses (red) than the others (black). The cell with the characteristic inhibitory period is the γ5β′2a neuron (blue).
Extended Data Figure 5. Population analysis of subpopulations of MBONs.
a, Distribution of MBON terminals in the brain (dark colors), based on the localization of a presynaptic marker8 (Syt::smGFP-HA). Anterior (top) and dorsal (bottom) views are shown. Axonal projections of MBONs converge heavily onto small areas inside four neighboring neuropils (light colors), crepine (CRE; orange), superior medial protocerebrum (SMP; green), superior intermediate protocerebrum (SIP; purple) and superior lateral protocerebrum (SLP; blue). We have found numerous cells that send widely branching neurites into one or all of these areas (database associated with ref. 45), indicating that downstream neurons likely read out activity from populations of MBONs. Lateral horn (LH, red) also receives sparse input. b, Pairwise correlations of MBON tuning patterns and the corresponding dendrogram are shown in the same way as Fig. 1d. The dots on the right show the axonal projection site of the different MBON types. None of the four major projection zones samples from particularly decorrelated set of MBONs. c, Odor representations in MBONs from a single virtual fly visualized by PCA (different virtual fly from Fig. 2c). Representations from the full MBON population (All) and subpopulations with the same axonal projection zones (CRE, SMP, SIP and SLP) are shown. Representations by subpopulations tend to be noisier than those from the full population, but they retain grossly similar structures. d, Correlation coefficients of neural representations of ten odors in KCs and MBONs (thick lines), as in Fig. 2g and h. Correlation values observed after artificially decorrelating KC and MBON tuning curves are shown for comparison (thin lines). e, Variance of the correlation coefficients shown in d (dark bars; mean ± SD; n = 1000 virtual flies), showing that values are more widely distributed in MBONs compared to KCs. Artificially decorrelating MBON tuning curves reduces the variance considerably (light bars), indicating that the pattern of activity in the MBONs contributes to the high variance. However, variance remains greater than that in the KCs, indicating that the breadth of tuning in the MBONs also contributes to wide range of correlation coefficients. The ratio of the contribution of those two factors seems to be different across subpopulations projecting different zones.
Extended Data Figure 6. Correlation of tuning between multiple MBON types measured in the same animal.
a, Odor tuning of α1 and α2sc neurons recorded sequentially in the same fly with GCaMP5 imaging (normalized to the strongest response, mean ± SEM). Data from five representative flies are shown. Two split-GAL4 drivers, MB319C and MB080C, were combined to label the two cell types. b, Similar to a but recordings are from α1, β1 and γ4 neurons. MB319C was combined with MB434B that labels both β1 and γ4 neurons. c, Correlation of tuning between different cell types, calculated within and across flies. Four different pairwise combinations of cell types were examined. Although within-fly correlations tended to be slightly higher than across-fly correlations, none of the four cases was significant (Mann-Whitney U-test). This is in sharp contrast with the comparisons of the same cell type, where we observed much higher correlations within the same fly than across flies (Fig. 3).
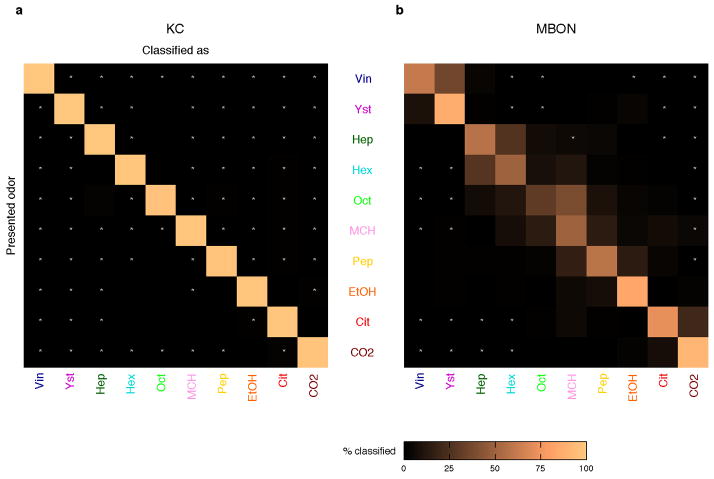
Extended Data Figure 7. Confusion matrices from odor classification analysis. Confusion matrices generated from the classification analysis in Fig. 2d.
a, KCs show nearly perfect classification performance. b, MBONs fail to discriminate some odors. Although the confusion matrix was generated using 100 different virtual flies (see Methods), a high rate of misclassifications is observed only between certain odor pairs that form overlapping clouds in MBON space (Fig. 2c). Odor pairs that were never misclassified with each other are indicated with white asterisks. Note that the group of vinegar and yeast were never misclassified with the group of CO2 and citronella.
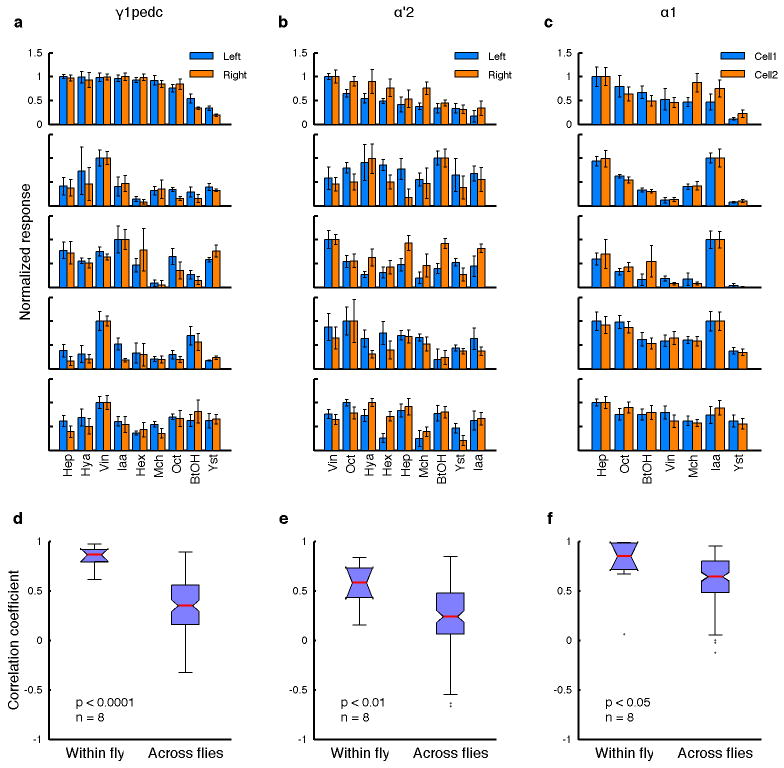
Extended Data Figure 8. Individualized tuning in multiple different MBON types.
a–c, Odor tuning of pairs of MBONs in the same fly, from GCaMP5 imaging at axons (normalized to the strongest response, mean ± SEM). Data from five representative flies are shown. For γ1pedc (a) and α′2 neurons (b), cells on the left and right hemispheres are compared. For α1 neuron (c), recordings were from ipsilateral cell pairs. d–f, For all three cell types, tuning patterns of the neurons from the same fly are more correlated than those from different flies (n = 8 flies per cell types; Mann-Whitney U-test).
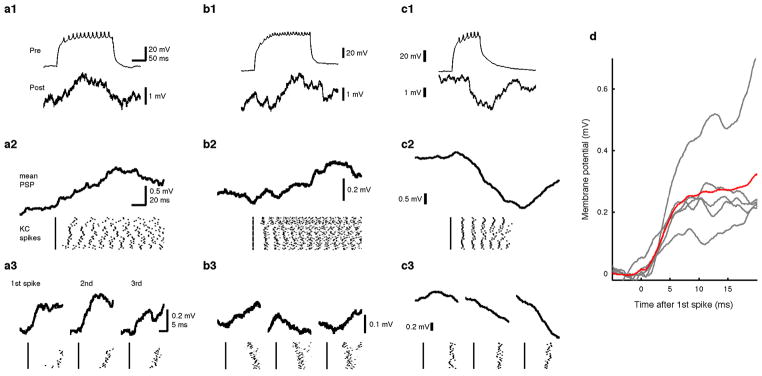
Extended Data Figure 9. Diverse functional connections between KCs and a MBON.
a, Another example of a monosynaptically connected pair of α/β KC and the α2sc neuron from experiments shown in Fig 4. (a1) Sample traces of simultaneously recorded KC (Pre) and the α2sc neuron (Post). (a2) The α2sc neuron’s membrane potential spike-trigger-averaged on the first KC spike of each trial. Raster plot of the KC spikes is shown below. (a3) Enlarged spike- trigger-averaged EPSPs for the first, second and third spikes in the train. b, A pair with small excitatory connection that we could not confirm as monosynaptic. In total, two of such pairs were found. c, A pair with an inhibitory connection, which is likely polysynaptic. Only one such pair was found. d, Summary of all five monosynaptically connected pairs. The spike-trigger-averaged EPSPS from the first spike in the train from five different recordings are shown overlaid in gray. The mean across cells is shown in red. Each of the five first-spike-trigger-averaged EPSPs are shown overlaid (gray) with the mean trace (red).
Extended Data Table 1.
MBON types and imaging conditions.
| Typed (Dendritic site in MB) | Axonal terminals in MBd | No. of cells per hemisphered | Imaged straind | Signal isolation | Imaged locus |
|---|---|---|---|---|---|
| α1 | - | 2 | MB310C | b | dendrite |
| α2p3p | - | 2 | MB062B | b | dendrite |
| α2sc | - | 1 | MB080C | a | dendrite |
| α3 | - | 2 | MB093C | b | dendrite |
| β1 | α | 1 | MB434B | a | dendrite |
| β2β′2a | - | 1 | MB399B | a | dendrite shaft |
| α′1 | - | 2 | MB543B | b | axon terminals |
| α′2 | - | 1 | MB018B | a | axon arbor |
| α′3ap | _ | 1 | MB027B | c | dendrite |
| α′3m | 2 | ||||
| β′1 | - | 8 | MB057B | b | axon arbor |
| β′2mp | - | 1 | MB002B | a | dendrite |
| β′2mp_bilateral | - | 1 | N.A. | N.A. | N.A. |
| γ1 pedc | α/β | 1 | MB085C | a | dendrite shaft |
| γ1γ2 | - | 1 | N.A. | N.A. | N.A. |
| γ2α′1 | - | 2 | MB051B | b | axon arbor |
| γ3 | - | 1 | MB083C | c | axon terminals |
| γ3β′1 | - | 1 | |||
| γ4 | γ1γ2 | 1 | MB298B | a | axon shaft |
| γ4γ5 | - | 1 | N.A. | N.A. | N.A. |
| γ5β′2a | - | 1 | MB011B | a | γ5 dendrite |
| calyx (MB-CP1) | - | 1 | MB242A | a | dendrite shaft |
Imaging signal is from single neuron.
Signal is from multiple cells of single cell type.
Signal is from multiple cell types.
Data from ref. 8.
Acknowledgments
We would like to thank Vivek Jayaraman, Joshua Dubnau and Kei Ito for fly strains. We are grateful to Hokto Kazama, Wanhe Li and Joshua Dubnau for helpful advice, and Vivek Jayaraman, Gonzalo Otazu and the members of Turner laboratory for valuable comments on the manuscript. This work was supported by NIH grant R01 DC010403-01A1 to G.C.T. T.H. was partially supported by a Postdoctoral Fellowship for Research Abroad from Japan Society for the Promotion of Science and a Postdoctoral Fellowship from the Uehara Memorial Foundation.
Footnotes
Author Contributions
T.H. and G.C.T. designed the experiments with help from Y.A. and G.M.R. T.H. performed all imaging and electrophysiology experiments and data analyses. Y.A. and G.M.R created fly strains and collected anatomical data for MBONs. T.H. and G.C.T. wrote the manuscript.
References
- 1.Perez-Orive J, et al. Oscillations and sparsening of odor representations in the mushroom body. Science. 2002;297:359–365. doi: 10.1126/science.1070502. [DOI] [PubMed] [Google Scholar]
- 2.Turner GC, Bazhenov M, Laurent G. Olfactory representations by Drosophila mushroom body neurons. J Neurophysiol. 2008;99:734–746. doi: 10.1152/jn.01283.2007. [DOI] [PubMed] [Google Scholar]
- 3.Honegger KS, Campbell RAA, Turner GC. Cellular-resolution population imaging reveals robust sparse coding in the Drosophila mushroom body. J Neurosci. 2011;31:11772–11785. doi: 10.1523/JNEUROSCI.1099-11.2011. [DOI] [PMC free article] [PubMed] [Google Scholar]
- 4.Davis RL. Olfactory memory formation in Drosophila: from molecular to systems neuroscience. Annu Rev Neurosci. 2005;28:275–302. doi: 10.1146/annurev.neuro.28.061604.135651. [DOI] [PubMed] [Google Scholar]
- 5.Campbell RAA, et al. Imaging a population code for odor identity in the Drosophila mushroom body. J Neurosci. 2013;33:10568–10581. doi: 10.1523/JNEUROSCI.0682-12.2013. [DOI] [PMC free article] [PubMed] [Google Scholar]
- 6.Lin AC, Bygrave AM, de Calignon A, Lee T, Miesenböck G. Sparse, decorrelated odor coding in the mushroom body enhances learned odor discrimination. Nat Neurosci. 2014;17:559–568. doi: 10.1038/nn.3660. [DOI] [PMC free article] [PubMed] [Google Scholar]
- 7.Tanaka NK, Tanimoto H, Ito K. Neuronal assemblies of the Drosophila mushroom body. J Comp Neurol. 2008;508:711–755. doi: 10.1002/cne.21692. [DOI] [PubMed] [Google Scholar]
- 8.Aso Y, et al. The neuronal architecture of the mushroom body provides a logic for associative learning. Elife. 2014;3:e04577. doi: 10.7554/eLife.04577. [DOI] [PMC free article] [PubMed] [Google Scholar]
- 9.Olsen SR, Bhandawat V, Wilson RI. Divisive normalization in olfactory population codes. Neuron. 2010;66:287–299. doi: 10.1016/j.neuron.2010.04.009. [DOI] [PMC free article] [PubMed] [Google Scholar]
- 10.Li Y, Strausfeld NJ. Morphology and sensory modality of mushroom body extrinsic neurons in the brain of the cockroach, Periplaneta americana. J Comp Neurol. 1997;387:631–650. [PubMed] [Google Scholar]
- 11.MacLeod K, Bäcker A, Laurent G. Who reads temporal information contained across synchronized and oscillatory spike trains? Nature. 1998;395:693–698. doi: 10.1038/27201. [DOI] [PubMed] [Google Scholar]
- 12.Cassenaer S, Laurent G. Conditional modulation of spike-timing-dependent plasticity for olfactory learning. Nature. 2012;482:47–52. doi: 10.1038/nature10776. [DOI] [PubMed] [Google Scholar]
- 13.Barlow H. In: Current Problems in Animal Behaviour. Thorpe WH, editor. Cambridge University Press; 1961. pp. 331–360. [Google Scholar]
- 14.Gupta N, Stopfer M. A temporal channel for information in sparse sensory coding. Curr Biol. 2014;24:2247–2256. doi: 10.1016/j.cub.2014.08.021. [DOI] [PMC free article] [PubMed] [Google Scholar]
- 15.Semmelhack JL, Wang JW. Select Drosophila glomeruli mediate innate olfactory attraction and aversion. Nature. 2009;459:218–223. doi: 10.1038/nature07983. [DOI] [PMC free article] [PubMed] [Google Scholar]
- 16.Knaden M, Strutz A, Ahsan J, Sachse S, Hansson BS. Spatial representation of odorant valence in an insect brain. Cell Rep. 2012;1:392–399. doi: 10.1016/j.celrep.2012.03.002. [DOI] [PubMed] [Google Scholar]
- 17.Suh GSB, et al. A single population of olfactory sensory neurons mediates an innate avoidance behaviour in Drosophila. Nature. 2004;431:854–859. doi: 10.1038/nature02980. [DOI] [PubMed] [Google Scholar]
- 18.Kwon Y, et al. Drosophila TRPA1 channel is required to avoid the naturally occurring insect repellent citronellal. Curr Biol. 2010;20:1672–1678. doi: 10.1016/j.cub.2010.08.016. [DOI] [PMC free article] [PubMed] [Google Scholar]
- 19.Wilson RI, Turner GC, Laurent G. Transformation of olfactory representations in the Drosophila antennal lobe. Science. 2004;303:366–370. doi: 10.1126/science.1090782. [DOI] [PubMed] [Google Scholar]
- 20.Murthy M, Fiete I, Laurent G. Testing odor response stereotypy in the Drosophila mushroom body. Neuron. 2008;59:1009–1023. doi: 10.1016/j.neuron.2008.07.040. [DOI] [PMC free article] [PubMed] [Google Scholar]
- 21.Caron SJC, Ruta V, Abbott LF, Axel R. Random convergence of olfactory inputs in the Drosophila mushroom body. Nature. 2013;497:113–117. doi: 10.1038/nature12063. [DOI] [PMC free article] [PubMed] [Google Scholar]
- 22.Gruntman E, Turner GC. Integration of the olfactory code across dendritic claws of single mushroom body neurons. Nat Neurosci. 2013;16:1821–1829. doi: 10.1038/nn.3547. [DOI] [PMC free article] [PubMed] [Google Scholar]
- 23.Séjourné J, et al. Mushroom body efferent neurons responsible for aversive olfactory memory retrieval in Drosophila. Nat Neurosci. 2011;14:903–910. doi: 10.1038/nn.2846. [DOI] [PubMed] [Google Scholar]
- 24.Wong AM, Wang JW, Axel R. Spatial representation of the glomerular map in the Drosophila protocerebrum. Cell. 2002;109:229–241. doi: 10.1016/s0092-8674(02)00707-9. [DOI] [PubMed] [Google Scholar]
- 25.Marin EC, Jefferis GSXE, Komiyama T, Zhu H, Luo L. Representation of the glomerular olfactory map in the Drosophila brain. Cell. 2002;109:243–255. doi: 10.1016/s0092-8674(02)00700-6. [DOI] [PubMed] [Google Scholar]
- 26.Cassenaer S, Laurent G. Hebbian STDP in mushroom bodies facilitates the synchronous flow of olfactory information in locusts. Nature. 2007;448:709–713. doi: 10.1038/nature05973. [DOI] [PubMed] [Google Scholar]
- 27.Aso Y, et al. Mushroom body output neurons encode valence and guide memory-based action selection in Drosophila. Elife. 2014;4:e04580. doi: 10.7554/eLife.04580. [DOI] [PMC free article] [PubMed] [Google Scholar]
- 28.Houk JC. In: Models of Information Processing in the Basal Ganglia. Houk JC, Davis JL, Beiser DG, editors. A Bradford Book; 1994. pp. 3–10. [Google Scholar]
- 29.Fişek M, Wilson RI. Stereotyped connectivity and computations in higher-order olfactory neurons. Nat Neurosci. 2014;17:280–288. doi: 10.1038/nn.3613. [DOI] [PMC free article] [PubMed] [Google Scholar]
- 30.Heimbeck G, Bugnon V, Gendre N, Keller A, Stocker RF. A central neural circuit for experience-independent olfactory and courtship behavior in Drosophila melanogaster. Proc Natl Acad Sci USA. 2001;98:15336–15341. doi: 10.1073/pnas.011314898. [DOI] [PMC free article] [PubMed] [Google Scholar]
- 31.Chen TW, et al. Ultrasensitive fluorescent proteins for imaging neuronal activity. Nature. 2013;499:295–300. doi: 10.1038/nature12354. [DOI] [PMC free article] [PubMed] [Google Scholar]
- 32.Akerboom J, et al. Optimization of a GCaMP Calcium Indicator for Neural Activity Imaging. J Neurosci. 2012;32:13819–13840. doi: 10.1523/JNEUROSCI.2601-12.2012. [DOI] [PMC free article] [PubMed] [Google Scholar]
- 33.Connolly JB, et al. Associative learning disrupted by impaired Gs signaling in Drosophila mushroom bodies. Science. 1996;274:2104–2107. doi: 10.1126/science.274.5295.2104. [DOI] [PubMed] [Google Scholar]
- 34.Aso Y, et al. The mushroom body of adult Drosophila characterized by GAL4 drivers. J Neurogenet. 2009;23:156–172. doi: 10.1080/01677060802471718. [DOI] [PubMed] [Google Scholar]
- 35.Han PL, Levin LR, Reed RR, Davis RL. Preferential expression of the Drosophila rutabaga gene in mushroom bodies, neural centers for learning in insects. Neuron. 1992;9:619–627. doi: 10.1016/0896-6273(92)90026-a. [DOI] [PubMed] [Google Scholar]
- 36.Ito K, et al. The organization of extrinsic neurons and their implications in the functional roles of the mushroom bodies in Drosophila melanogaster Meigen. Learn Mem. 1998;5:52–77. [PMC free article] [PubMed] [Google Scholar]
- 37.Yang MY, Armstrong JD, Vilinsky I, Strausfeld NJ, Kaiser K. Subdivision of the Drosophila mushroom bodies by enhancer-trap expression patterns. Neuron. 1995;15:45–54. doi: 10.1016/0896-6273(95)90063-2. [DOI] [PubMed] [Google Scholar]
- 38.Averbeck BB, Latham PE, Pouget A. Neural correlations, population coding and computation. Nat Rev Neurosci. 2006;7:358–366. doi: 10.1038/nrn1888. [DOI] [PubMed] [Google Scholar]
- 39.Gorczyca MG, Hall JC. Immunohistochemical localization of choline acetyltransferase during development and in Chats mutants of Drosophila melanogaster. J Neurosci. 1987;7:1361–1369. doi: 10.1523/JNEUROSCI.07-05-01361.1987. [DOI] [PMC free article] [PubMed] [Google Scholar]
- 40.Yasuyama K, Meinertzhagen IA, Schürmann FW. Synaptic organization of the mushroom body calyx in Drosophila melanogaster. J Comp Neurol. 2002;445:211–226. doi: 10.1002/cne.10155. [DOI] [PubMed] [Google Scholar]
- 41.Johard HAD, et al. Intrinsic neurons of Drosophila mushroom bodies express short neuropeptide F: relations to extrinsic neurons expressing different neurotransmitters. J Comp Neurol. 2008;507:1479–1496. doi: 10.1002/cne.21636. [DOI] [PubMed] [Google Scholar]
- 42.Brooks ES, et al. A Putative Vesicular Transporter Expressed in Drosophila Mushroom Bodies that Mediates Sexual Behavior May Define a Neurotransmitter System. Neuron. 2011;72:316–329. doi: 10.1016/j.neuron.2011.08.032. [DOI] [PMC free article] [PubMed] [Google Scholar]
- 43.Rousseeuw PJ. Silhouettes: A graphical aid to the interpretation and validation of cluster analysis. J Comput Appl Math. 1987;20:53–65. [Google Scholar]
- 44.Willmore B, Tolhurst DJ. Characterizing the sparseness of neural codes. Network (Bristol, England) 2001;12:255–270. [PubMed] [Google Scholar]
- 45.Chiang AS, et al. Three-dimensional reconstruction of brain-wide wiring networks in Drosophila at single-cell resolution. Curr Biol. 2011;21:1–11. doi: 10.1016/j.cub.2010.11.056. [DOI] [PubMed] [Google Scholar]


