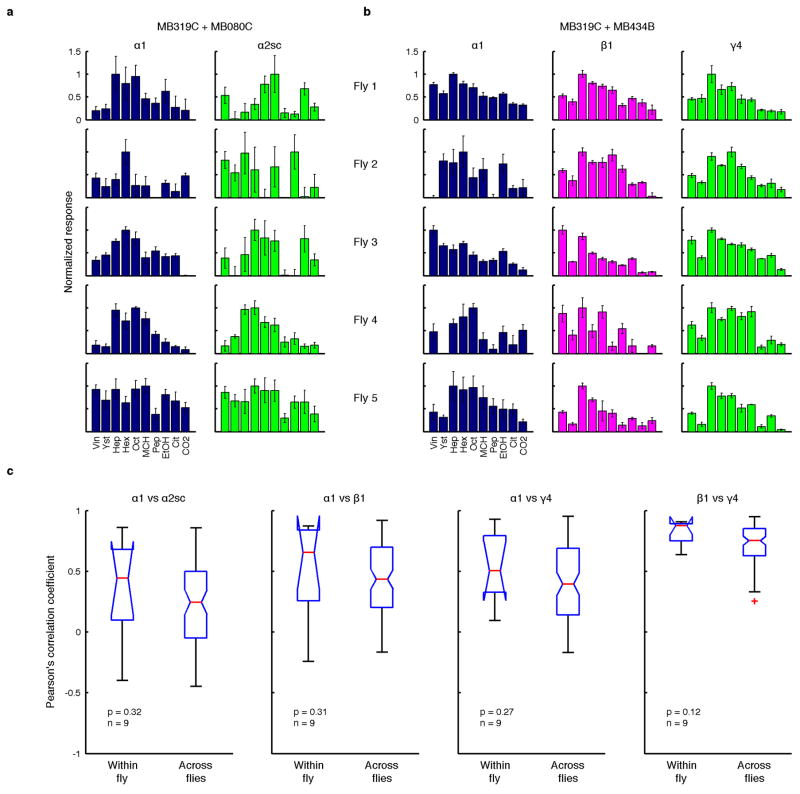
Extended Data Figure 6. Correlation of tuning between multiple MBON types measured in the same animal.
a, Odor tuning of α1 and α2sc neurons recorded sequentially in the same fly with GCaMP5 imaging (normalized to the strongest response, mean ± SEM). Data from five representative flies are shown. Two split-GAL4 drivers, MB319C and MB080C, were combined to label the two cell types. b, Similar to a but recordings are from α1, β1 and γ4 neurons. MB319C was combined with MB434B that labels both β1 and γ4 neurons. c, Correlation of tuning between different cell types, calculated within and across flies. Four different pairwise combinations of cell types were examined. Although within-fly correlations tended to be slightly higher than across-fly correlations, none of the four cases was significant (Mann-Whitney U-test). This is in sharp contrast with the comparisons of the same cell type, where we observed much higher correlations within the same fly than across flies (Fig. 3).

