

Abstract
Background
Recent studies have used cluster analysis to identify phenotypic clusters of asthma with differences in clinical traits, as well as differences in response to therapy with anti-inflammatory medications. However, the correspondence between different phenotypic clusters and differences in the underlying molecular mechanisms of asthma pathogenesis remains unclear.
Objective
To determine whether clinical differences among children with asthma in different phenotypic clusters corresponded to differences in levels of gene expression.
Methods
We explored differences in gene expression profiles of CD4+ lymphocytes isolated from the peripheral blood of 299 young adult participants in the Childhood Asthma Management Program (CAMP) study. We obtained gene expression profiles from study subjects between 9-14 years after they participated in a randomized, controlled longitudinal study examining the effects of inhaled anti-inflammatory medications over a 48 month study period, and we evaluated the correspondence between our earlier phenotypic cluster analysis, and subsequent follow-up clinical and molecular profiles.
Results
We found that differences in clinical characteristics observed between subjects assigned to different phenotypic clusters persisted into young adulthood, and that these clinical differences were associated with differences in gene expression patterns between subjects in different clusters. We identified a subset of genes associated with atopic status, and validated the presence of an atopic signature among these genes in an independent cohort of asthmatic subjects, and identified the presence of common transcription factor binding sites (TFBS) corresponding to glucocorticoid receptor (Gr) binding.
Conclusion
These findings suggest that phenotypic clusters are associated with differences in the underlying pathobiology of asthma. Further experiments are necessary to confirm these findings.
Keywords: childhood asthma, asthma phenotypes, gene expression profiling, microarray analysis, longitudinal study
Introduction
Asthma is a disease of increased airway hyperesponsiveness and airflow limitation that is increasingly being viewed as a heterogeneous syndrome composed of an assortment of disease subtypes with differing etiologies and natural histories.1 The observation that subsets of asthmatic patients exist who continue to have symptoms despite maximal medical therapy has motivated the search for distinct asthma subgroups with putative differences in disease mechanism. Recent multivariate analyses have uncovered phenotypic clusters with differing risk factors for and manifestations of asthma. Moore and colleagues demonstrated the presence of 5 distinct phenotypic clusters among adult asthmatics;2 and Fitzpatrick and colleagues performed a parallel analysis with analogous findings among childhood asthmatics.3 More recent work has highlighted the clinical importance of such clusters by demonstrating the presence of both longitudinal consistency,4 and different responses to medical therapy5 between different phenotypic clusters.
An important implication of recent advances in our understanding of asthma phenotypes is that we may use these clusters to uncover associated differences in pathogenetic mechanism, and thus have the potential to identify new therapeutic targets, with increased treatment specificity as well as new molecular biomarkers for improved clinical detection. Several studies have furthered our current understanding of the relationship between phenotypic clusters and molecular mechanism. Woodruff and colleagues profiled a selected subset of gene expression levels in asthmatic subjects and found that differences in gene expression corresponded to differences in multiple clinical measures of asthma severity, demonstrating a link between clinical phenotype and molecular mechanism.6 Baines and colleagues subsequently found a correspondence between transcriptional profiles and different clinical characteristics in an asthmatic population. However, the cross-sectional nature of these studies limits the clinical applicability of the findings.7
In the current analysis, our goal was to link differences in gene expression levels to longitudinally stable clinical phenotypes with demonstrated differences in response to medical therapy. In a prior analysis, we determined the presence of phenotypic clusters in a cohort of children with mild-moderate persistent asthma obtained from the Childhood Asthma Management Program (CAMP) study.8 Among these children, we identified 5 distinct phenotypic clusters with different degrees of airflow obstruction, rates of exacerbation and atopic characteristics. We further found that these clusters demonstrated both longitudinal stability over the 48-month study period and differences in response to medical therapy. In the current study we extend our earlier analysis through an exploration of differences in gene expression between these different phenotypic clusters, with the goals of identifying novel molecular biomarkers corresponding to different phenotypes and further elucidating the differences in molecular mechanism between subjects in different clusters.5 We uncovered the presence of a set of genes + in CD4 lymphocytes isolated from the peripheral blood of a subset of CAMP participants that were differentially expressed between more atopic and less atopic study subjects. Gene expression levels were also associated with different phenotypic clusters and were highly predictive of multiple clinical characteristics, such as levels of atopy and asthma control. We validated these results in an independent population, and evaluated for the presence of shared transcription factor binding sites among the genes of each module.
Methods
Study population
The Childhood Asthma Management Program (CAMP) was a multi-center randomized, double-masked clinical trial of the long-term effects of three inhaled treatments for mild to moderate childhood asthma, with 1041 subjects enrolled.9 Recruitment for the CAMP study took place from December 1993 and September 1995. Two subsequent 4-year observational follow-up studies of CAMP participants, CAMPCS/1 and CAMPCS/2 were carried out upon completion of the original CAMP study. We obtained blood samples and clinical data for the current study during routine CAMPCS/2 clinical visits between May 1, 2004 and July 31, 2007 from four clinical centers (Baltimore, Boston, Denver, St. Louis). The study visit included questionnaire assessments of asthma symptoms and medication use. From those specimens, we isolated CD4+ lymphocytes and obtained high-quality expression profiles from 299 patient samples using Illumina HumanRef8 v2 BeadChip arrays (Illumina, San Diego, CA, USA).10 Clinical characteristics and gene expression profiles of the 299 study subjects were assessed with respect to their membership in one of five phenotypic clusters assigned in a prior analysis of the complete CAMP cohort of 1041 study subjects. 5
RNA extraction and microarray preprocessing
From the CAMP study population, we isolated CD4 T cells from the collected mononuclear cell layer using anti- CD4+ microbeads by column separation (Miltenyi Biotec, Auburn, CA). 11, 12 Total RNA was extracted using the RNeasy Mini Protocol (Qiagen, Gaithersburg, MD). 13–15 Expression profiles were generated with the Illumina Human- Ref8 v2 BeadChip arrays (Illumina, San Diego, CA) according to protocol. Arrays were read using the Illumina BeadArray scanner and analyzed using BeadStudio (version 3.1.7) without background correction. Raw expression intensities were processed using the lumi package 16 of Bioconductor with background adjustment with Robust Multi-Array Average (RMA) convolution 17 and log2 transformation of each array. The combined samples were quantile normalized. The complete raw and normalized microarray data are available through the GeneExpression Omnibus of the National Center for Biotechnology Information (http://www.ncbi.nlm.nih.gov/geo/, accesion ID GSE22324).
Identification of differentially expressed genes
In order to classify gene expression levels from multiple phenotypic clusters into differential expression patterns, we used an empirical Bayes hierarchical modeling approach to calculate the posterior probability of each gene expression value fitting a particular pattern of expression.18–20 For example, for this analysis, we were interested in patterns of differential expression of genes across different phenotypic clusters. We developed a set of 49 theoretical pattern assumptions (Figure 1, Table E1), such as the assumption of the null hypothesis of no differential expression across clusters for a gene, or the assumption of differential expression across all clusters for a gene, and then calculated the posterior probability of each gene fitting a particular pattern of expression. We assigned genes to the gene pattern with maximum posterior probability. Further details of this methodology are described in the Online Repository.
Figure 1.

Graphical depiction of possible distributions of gene expression patterns for each phenotypic cluster. Each color denotes a particular genome-wide pattern of expression, and each row denotes a distribution of expression patterns across phenotypic clusters. Similar colors denote similar patterns of expression, whereas different colors denote different patterns of expression. For example, the top row of the figure depicts five red segments, indicating similar patterns of genome-wide expression across the five phenotypic clusters. A close-up view of the top five expression pattern distributions as determined by posterior probability is also shown.
Association of differential gene expression with clinical characteristics
In order to assess the potential functional relevance of the differentially expressed genes, we explored the relationship between the top pattern of differential expression and multiple clinical characteristics, obtained at the time blood samples were obtained for gene expression profiling. We used Kruskal-Wallis and χ2 tests to make comparisons between phenotypic clusters with different gene expression profiles. We calculated counts and percentages or arithmetic means and SDs for all variables measured. We also examined the temporal effects of differential gene expression by calculating correlations between gene expression levels and several longitudinal clinical outcomes, including measures of atopy and airway hyperresponsiveness.
Validation of gene expression signature
To assess the generalizability of the association between genes fitting the atopic expression pattern and atopy, we evaluated whether the genes in fitting the atopic expression pattern could be used to predict atopic status in an independent cohort (N = 88) of more atopic (N = 72) and less atopic (N = 16) subjects with (N = 68) and without asthma (N = 20). We used a gene expression dataset that was publicly available on the GEO website (GSE473).21 This dataset consisted of gene expression profiles obtained from CD4+ T-lymphocytes in the peripheral blood of 30 patients with and without atopy and asthma. We selected this dataset as a validation cohort due to the fact that it was similar to our study population in terms of the range of clinical phenotypes (atopic and asthmatic subjects), and in terms of the particular cell type from which RNA was obtained (CD4+ T-lymphocytes). Notably, this cohort was somewhat different from our study population because only a subset of subjects had asthma (68/88), whereas all of the 299 subjects in our study population had asthma.
We used the genes differentially expressed between more atopic and less atopic clusters to grow a binary recursive partitioning decision tree to predict phenotype cluster assignments within our patient population. 22, 23 Further details of this methodology are described in the Online Repository.
Identification of common regulatory domains
In order to map the set of 501 differentially expressed genes to biological functions, we used the ENCODE ChIP-Seq significance tool 24 to explore the presence of enriched transcription factors within each module. The ENCODE ChIP-Seq Significance Tool leverages a MySQL database of official unified peak calls from 708 ENCODE ChIP-Seq non-histone and non-control experiments, including 220 transcription factor and treatment combinations across 91 cell types. We designed the experiment so that for each transcription factor (TF)/treatment combination, the ENCODE ChIP-Seq Significance Tool would query the database to identify the number of genes within each co-expression module with at least one TF peak apex in the selected window around the gene. We calculated an enrichment score by using a one-tailed hypergeometric test followed by the FDR method to control the false discovery rate in multiple hypothesis testing.25
Results
Distribution of phenotypic traits
Clinical phenotype data was available for all 299 participants. We assessed clinical characteristics of study participants based upon their membership in a particular phenotypic cluster as previously assigned. The characteristics assessed within one month of the time blood was obtained for microarray analysis are presented in Table 1. The clinical characteristics presented in the table represent follow up data obtained between 9-14 years after the onset of the original CAMP study. The mean age of study subjects was 20.4 years of age, compared to 5-12 years in the original study. The ethnic and gender distributions were similar to those of the original study (Table E2).
Table I. Distribution of traits across cluster groups.
| Cluster 1 (n=102) | Cluster 2 (n=50) | Cluster 3 (n=49) | Cluster 4 (n=70) | Cluster 5 (n=28) | p-value | |
|---|---|---|---|---|---|---|
|
| ||||||
| AOE Classification | LLL | HLL | HM | MHH | HHH | |
|
| ||||||
| Demographics | ||||||
|
| ||||||
| Age (years) | 20.1 ± 2.0 | 20.3 ± 2.2 | 21.0 ± 2.2 | 20.7 ± 2.1 | 19.9 ± 2.4 | 0.54 |
|
| ||||||
| Male (%) | 59 (57.8) | 37 (74.0) | 24 (49.0) | 44 (62.9) | 20 (71.4) | 0.08 |
| Female (%) | 43 (42.2) | 13 (26.0) | 25 (51.0) | 26 (37.1) | 8 (28.6) | |
|
| ||||||
| White (%) | 84 (82.4) | 35 (70.0) | 34 (69.4) | 53 (75.7) | 21 (75.0) | 0.16 |
| African American (%) | 11 (10.8) | 13 (26.0) | 10 (20.4) | 16 (22.9) | 6 (21.4) | |
| Hispanic (%) | 7 (6.9) | 2 (4.0) | 5 (10.2) | 1 (1.4) | 1 (3.6) | |
|
| ||||||
| Atopic features | ||||||
|
| ||||||
| Total serum IgE levels (log10) | 0.63 | 0.70 | 0.64 | 0.80 | 0.66 | 0.001 |
|
| ||||||
| Total serum eosinophils (log10) | 2.17 ± 0.50 | 2.37 ± 0.46 | 2.42 ± 0.35 | 2.34 ± 0.32 | 2.44 ± 0.31 | 0.002 |
|
| ||||||
| Spirometry | ||||||
|
| ||||||
| Pre-bronchodilator FEV1 (% predicted) | 98.2 ± 13.2 | 98.5 ± 10.9 | 98.4 ± 11.3 | 94.1 ± 13.7 | 97.0 ± 11.1 | 0.48 |
|
| ||||||
| Pre-bronchodilator FEV1/FVC | 78.5 ± 7.67 | 78.5 ± 7.89 | 78.6 ± 7.55 | 76.2 ± 7.57 | 75.3 ± 9.64 | 0.22 |
|
| ||||||
| Pre-BD peak flow (L/min) | 576.6 ± 144.5 | 634.0 ± 157.1 | 564.0 ± 147.0 | 579.8 ± 137.8 | 598.8 ± 162.7 | 0.20 |
|
| ||||||
| Airway responsiveness | ||||||
|
| ||||||
| Methacholine PC20 (natural log) | 1.09 ± 0.56 | 0.91 ± 0.53 | 0.75 ± 0.47 | 0.92 ± 0.52 | 0.96 ± 0.58 | 0.08 |
|
| ||||||
| Environmental exposures | ||||||
|
| ||||||
| Tobacco Smoking | 0.18 | |||||
| Yes | 14 (13.7) | 7 (14.0) | 8 (16.3) | 3 (4.3) | 2 (7.1) | |
| No | 76 (74.5) | 38 (76.0) | 34 (69.4) | 60 (85.7) | 21 (75.0) | |
|
| ||||||
| Average cigarettes smoked per day | 1.3 ± 4.1 | 1.2 ± 3.7 | 1.9 ± 4.7 | 0.5 ± 2.8 | 0.5 ± 2.1 | 0.18 |
Several measures of atopic burden were obtained at the time of sample collection, including serum IgE and eosinophil levels. As was observed in our prior cluster analysis, the degree of atopy at the time of follow up was highest in Clusters 2,3 and 5 and lowest in Cluster 1 and Cluster 4. Similarly, the spirometric values at the time of follow up show a similar distribution to that obtained at baseline, with Cluster 4 and Cluster 5 showing the highest levels of airway obstruction.
The number of active smokers represented a minority of this cohort (11.4%), with the highest percentage of smokers in Cluster 3 (16.3%) and the lowest percentage of smokers in Cluster 4 (4.3%).
Gene transcripts demonstrate patterns of expression associated with atopic status
In order to understand the relative contribution of different genes to the formation of the asthma phenotypic clusters, we performed gene expression profiling of individuals from different phenotypic clusters to detect patterns of expression. For the set of phenotypic clusters, gene expression levels could be sorted into 49 distinct theoretical patterns (Figure 1, Table E1).
For each transcript in each phenotypic cluster, we calculated the posterior probability for each of the 49 patterns and assigned the transcript to the expression pattern with maximum posterior probability (MPP). Differentially expressed (DE) transcripts were defined as those with MPP greater than a specific threshold set to limit the false discovery rate (FDR) to < 0.05 for each of the DE patterns (Figure 1, 2-49 in Table E1). Using this approach, we found that 99.7 percent of the DE transcripts were confined to 2 of the 49 possible DE patterns.
The top five expression patterns as ranked by posterior probability are also shown in Figure 1. The expression pattern containing the highest number of differentially expressed transcripts (20,347 of 22,184 total transcripts) was the null hypothesis expression pattern, i.e. the pattern of no difference in expression between the different phenotypic clusters. The expression pattern containing the second highest number of differentially expressed transcripts (501 of 22,184 total transcripts) was the pattern of similar expression between Clusters 1 and 4 and between Clusters 2, 3 and 5. Our earlier analysis of the clinical data from the CAMP study demonstrated that Cluster 1 and Cluster 4 had the lowest atopic burden of the phenotypic clusters. That is, at the time of initial recruitment to the CAMP study, clusters 1 and 4 had the lowest levels of atopic dermatitis (Cluster 1 = Cluster 4 = 0%), the lowest history of hay fever (Cluster 1 = 20.3%, Cluster 4 = 52.9%), the lowest history of a positive skin test (Cluster 1 = 76.7%, Cluster 4 = 88%), and the lowest log10 total serum IgE levels (Cluster 1 = 2.37, Cluster 4 = 2.64). Thus, a large number of differentially expressed genes demonstrated an expression pattern that was associated with the degree of atopic burden present among study subjects at the time of enrollment in the CAMP study, suggesting atopic status was the primary driver of the change in gene expression for these transcripts.
Gene expression profiles are associated with differences between clinical traits
We explored the relationship between gene expression pattern and clinical traits by reorganizing our five phenotypic clusters into two subgroups (most atopic and least atopic), based upon the degree of atopic burden present. These two subgroups were associated with the pattern of expression of 501 genes that differed between subjects with different levels of atopy. We examined multiple clinical characteristics for differences between the two subgroups, and found statistically significant differences in the levels of serum IgE (p = 0.005), serum eosinophils (p = 0.0002), established markers for atopic burden (Table 2). We also found statistically significant differences in the level of methacholine PC20, a measure of airway hyperresponsiveness between the two subgroups. The group with the higher burden of atopy demonstrated a lower value for the methacholine PC20 (p = 0.04), indicating that in addition to having higher levels of atopy as adults this subgroup also had higher levels of airway hyperresponsiveness. We next examined the longitudinal trajectory of each clinical trait comparing more atopic and less atopic subjects. In general, for each subgroup, levels of atopic burden decreased over time, as exhibited by decreasing levels of serum IgE and serum eosinophils (Figure 2). In addition, levels of airway hyperresponsiveness decreased over time, as demonstrated by increasing levels of methacholine PC20. However, we also found that along the course of each trait, there were differences between more atopic and less atopic subgroups (p < 0.001). Overall, the differences between the more atopic and less atopic subgroups were more extreme in childhood, decreasing over time, yet persisting into young adulthood.
Table II. Characteristics of Study Subjects Dichotomized by Atopic Status.
| More Atopic N = 127 | Less Atopic N = 172 | P-value | |
|---|---|---|---|
|
| |||
| Demographics | |||
|
| |||
| Age (years) | 20.5 ± 2.3 | 20.4 ± 2.0 | 0.63 |
|
| |||
| Male (%) | 81 (63.8) | 103 (59.9) | 0.55 |
| Female (%) | 46 (36.2) | 69 (40.1) | |
|
| |||
| White (%) | 90 (70.9) | 137 (80.0) | 0.21 |
| African American (%) | 29 (22.8) | 27 (15.7) | |
| Hispanic (%) | 8 (6.3) | 8 (4.7) | |
|
| |||
| Atopic Features | |||
|
| |||
| Serum IgE (log10) | 2.69 ± 0.57 | 2.43 ± 0.63 | 0.005 |
|
| |||
| Serum Eosinophils (log10) | 2.41 ± 0.38 | 2.24 ± 0.44 | 0.0002 |
|
| |||
| Spirometry | |||
|
| |||
| Pre-bronchodilator FEV1 (% predicted) | 98.1 ± 11.0 | 96.5 ± 13.5 | 0.29 |
|
| |||
| Post-bronchodilator FEV1/FVC (% predicted) | 77.8 ± 8.22 | 77.4 ± 7.69 | 0.82 |
|
| |||
| Airway responsiveness | |||
|
| |||
| Methacholine PC20 (natural log) | 0.86 ± 0.52 | 1.03 ± 0.55 | 0.04 |
|
| |||
| Environmental Exposures | |||
|
| |||
| Tobacco Smoking (%) | 0.40 | ||
| Yes | 17 (13.4) | 17 (10.0) | |
| No | 93 (73.2) | 136 (79.1) | |
Figure 2.

Longitudinal trajectories of several clinical traits stratified by gene expression pattern (more atopic vs. less atopic). A) Depicts the trajectory of serum eosinophil levels, B) Depicts the trajectory of serum IgE levels, and C) Depicts the trajectory of methacholine PC20 levels.
Gene Expression Profiles are Predictive of Atopic Status
To explore the generalizability of the set of differentially expressed genes within our cohort, we assessed whether these genes were also predictive of atopic status in an independent dataset (see Figure 3). Of the 501 genes present in this gene expression pattern, five genes successfully classified all of the atopic patients in an independent cohort with a sensitivity of 100%, specificity of 81.3%, positive predictive value of 96.0%, and a negative predictive value of 100%. Details of the methodology leading to these results are provided in the Online Supplement.
Figure 3.

Decision Tree Classification Model for Atopic Status. There were five genes that were strongly predictive of atopic status in an independent population. These genes make up the branches of the tree, with each partition determined by the log2 gene expression level.
Expression levels for each of the five genes in the signature for atopic status were significantly different (p < 0.05) between more atopic and less atopic subgroups (Table 3). Levels of SRM were relatively down-regulated in more atopic compared to less atopic asthmatics, whereas levels of HDAC2, SLC33A1, P2RY10, and ADD3 were relatively up-regulated in more atopic compared to less atopic asthmatics.
Table III. Average expression levels of atopic signature genes.
| Gene | More Atopic N = 127 | Less Atopic N = 172 | P-value | Adj p-value |
|---|---|---|---|---|
|
| ||||
| Spermidine synthase (SRM) | 9.11 ± 0.53 | 9.27 ± 0.57 | 0.019 | 0.019 |
| Histone deacetylas 2 (HDAC2) | 10.5 ± 0.51 | 10.3 ± 0.63 | 0.0048 | 0.0060 |
| Solute carrier family 33 member 1 (SLC33A1) | 8.4 ± 0.40 | 8.2 ± 0.42 | 0.0018 | 0.0060 |
| Purinergic receptor P2Y, G-protein coupled, 10 (P2RY10) | 9.4 ± 0.71 | 9.2 ± 0.70 | 0.0027 | 0.0060 |
| Adducin 3 (gamma) (ADD3) | 11.3 ± 0.91 | 11.0 ± 0.93 | 0.0048 | 0.0060 |
We measured the correlation between the five-gene signature for atopic status and serum IgE, serum eosinophils, and methacholine PC20 levels. Serum IgE levels were positively correlated with all five genes in the gene signature, most notably with ADD3 (p = 0.04) (Figure 4), and serum eosinophils were positively correlated with SRM expression levels (p = 0.02).
Figure 4.
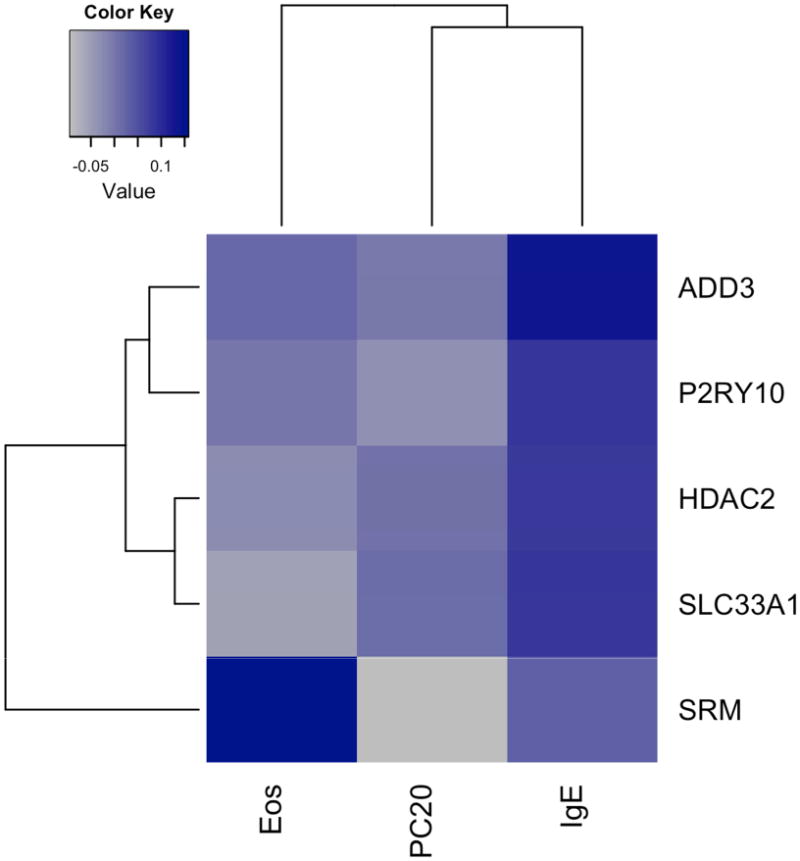
Correlation heatmap depicting correlation between clinical traits and gene expression levels. Blue denotes a higher positive level of correlation between gene and clinical trait, while grey denotes a higher negative level of correlation between gene and clinical trait.
Differentially expressed genes are enriched for glucocorticoid receptor binding sites
We queried the ENCODE Chip-Seq significance tool for evidence of transcription factor binding site (TFBS) enrichment among our set of 501 differentially expressed genes. Among the genes expressing atopic pattern differences, we found evidence that the promoter regions were significantly enriched for glucocorticoid receptor (Gr) binding sites. Gr binding sites were present in 144 of 476 genes queried using the tool (q-value = 4.99e-9). The list of genes with Gr binding sites is shown in Table S4). Three of the five genes present in the signature (SRM, SLC33A1, ADD3) were among those with TFBS enriched for Gr binding sites.
Discussion
Our analysis of gene expression profiles obtained from CAMP participants 9-14 years from the study onset is notable for several key findings. First and foremost, these results extend and enhance the results of our previous cluster analysis. In our previous cluster analysis, we detected 5 phenotypic clusters using the baseline clinical data from asthmatic study subjects that differed in their response to medical therapy. In the current analysis, we found that in the same patient population, even after 9-14 years there continued to be longitudinal consistency in the clinical characteristics of subjects within different phenotypic clusters. Second, subjects with a higher degree of atopic features demonstrated differential expression in a subset of genes with expression levels highly correlated with longitudinal measures of atopy and airway hyperresponsiveness. Third, a subset of these differentially expressed genes formed an atopic signature that we used to successfully determine atopic status from gene expression profiles obtained from an independent population of asthmatic subjects.
In our initial cluster analysis, performed using clinical data from participants in the CAMP study, we found that children could be characterized in terms of five distinct phenotypic clusters, which differed in terms of atopic burden, airway obstruction and rates of exacerbation. In this analysis, we found that an average of 12 years after the original study, participants continued to exhibit cluster-specific differences in several clinical characteristics, including differences in atopic features, spirometry and airway responsiveness. This is notable because at this time, in contrast to the physiologic differences, many of these patients described relatively mild symptoms. Furthermore, this finding, from the largest randomized, placebo-controlled clinical trial with extended follow-up for children with mild-moderate asthma, 26 suggests that the decreased symptoms many childhood asthmatics describe as they age, does not correspond to disease remission. In fact, the original pathogenetic mechanisms appear to persist into young adulthood, albeit with minimal subjective symptoms.
Gene expression profiles from CD4 T cells collected from the same set of patients allows us to integrate genomic factors into our analysis of phenotypic clusters. Our analysis of gene expression profiles further confirms the persistence of physiologic differences between asthmatics assigned to different clusters. A set of 501 out of 22,184 total genes assayed displayed an expression pattern that was associated with atopic status. Thus, these gene expression profiles allowed us to organize our phenotypic clusters into two subgroups based upon atopic burden. Study subjects with higher levels of atopic burden had a different pattern of expression of this set of genes from subjects with relatively lower levels atopic burden. Atopic subjects (clusters 2, 3, and 5) had higher levels of two peripheral blood markers of atopic burden, serum IgE, serum eosinophils compared to the other clusters (clusters 1 and 4). Additionally, levels of methacholine PC20 were lower in more atopic than less atopic subjects, suggesting that the set of genes responsible for atopy may also control aspects of airway hyperresponsiveness. Differences in these clinical traits were significant when these children were initially enrolled in the CAMP study, and persisted for at least 9-14 years into young adulthood.
A subset of differentially expressed genes formed a signature that was highly predictive of atopy in an independent population of mild-moderate asthmatics, a finding that lends further credibility to the hypothesis that different phenotypic clusters correspond to differences in the underlying pathobiological mechanisms of asthma, as well as validating the biological relevance of our longitudinal phenotypic clusters. Several genes in this signature have been previously linked to asthma pathogenesis, most notably histone deacetylase 2 (HDAC2), which had higher levels of expression in more atopic relative to less atopic study subjects. Studies have shown that reduction of histone acetylation by HDAC2 results in the suppression of multiple inflammatory genes through a glucocorticoid-mediated process and a reduction in asthmatic symptoms.27 Evidence has also linked inhibition of HDAC2 to steroid-resistant asthma. 28–32 The presence of Gr TFBS on numerous differentially expressed genes, suggests an association between steroid resistance and differences in the clinical characteristics we observed between our more atopic and less atopic subgroups.
Our study had several limitations. First, the analysis was retrospective, with gene expression profiles associated with existing clinical phenotypic data. The availability of longitudinal gene expression data from prospective studies could help to elucidate temporal changes in the expression of these genes and their role in the pathogenesis of childhood asthma. Second was the lack of longitudinal clinical data in our validation cohort. Further studies from multiple institutions will be necessary to confirm the correspondence between changes in gene expression, atopic status, and clinical characteristics corresponding to atopy and airway hyperresponsiveness. Third is the fact that our patient cohort was limited to subjects with mild and moderate asthma, excluding those with a more severe phenotype. We recognize that this limited the diversity of symptoms among our subjects and many young adults among the more mild phenotypes seemed outgrow their asthma symptoms. For this reason, the differential gene expression levels among different clusters is more likely to have clinical utility for patients at the extreme ends of the phenotype.
In summary, the current study represents the largest analysis to demonstrate differences in gene expression profiles associated with clinically significant phenotypic clusters. Further, differences among patients in different clusters and their gene expression profiles persist across time. Our findings lend further support to the hypothesis that asthma phenotypic clusters are associated with differences in the underlying molecular mechanisms of asthma pathogenesis, as demonstrated by differences in gene expression profiles among subjects in different phenotypic clusters. This finding has implications for drug development and personalized approaches to the treatment of this complex disease. Further work will be necessary to validate these early findings and explore the mechanistic differences between different clusters.
Clinical Implications.
There is evidence for asthma endotypes (subtypes), but less information about the relevance of such endotypes. In this article we link asthma endotypes to atopic patterns of gene expression.
Acknowledgments
We thank all subjects for their ongoing participation in this study. We acknowledge the CAMP investigators and research team, supported by NHLBI, for collection of CAMP Genetic Ancillary Study data. Special thanks to Anne Plunkett, Teresa Concordia, Debbie Bull, Denise Rodgers, and D. Sundstrom for their assistance with sample collection. All work on data collected from the CAMP Genetic Ancillary Study was conducted at the Channing Laboratory of the Brigham and Women's Hospital and Harvard Medical School under appropriate CAMP policies and human subject's protections.
Funding: This work is supported by grant R01 HL086601 from the National Heart, Lung and Blood Institute, National Institutes of Health (NIH/NHLBI). The CAMP Genetics Ancillary Study is supported by U01 HL075419, U01 HL65899, P01 HL083069 and T32 HL07427 from the NIH/NHLBI.
Abbreviations
- CAMP
Childhood asthma management program
- FEV1
One-second forced expiratory volume
- FEV1/FVC
Ratio of the one-second forced expiratory volume and forced vital capacity
- FVC
Forced vital capacity
- PC20
The dose of methacholine provoking a 20% drop in FEV1
- TFBS
Transcription factor binding site
Footnotes
This paper is subject to the NIH Public Access Policy (http://publicaccess.nih.gov).
Author Contributions: All authors have seen and approved the manuscript. J.A.H. and E.P.X conceived and designed the research. J.A.H. performed the data analysis. J.A.H., W.W, M.M., B.A.R., E.P.X and S.T.W. contributed critical feedback and assisted in writing the manuscript.
Conflicts of Interest: All authors report no conflicts of interest.
Publisher's Disclaimer: This is a PDF file of an unedited manuscript that has been accepted for publication. As a service to our customers we are providing this early version of the manuscript. The manuscript will undergo copyediting, typesetting, and review of the resulting proof before it is published in its final citable form. Please note that during the production process errors may be discovered which could affect the content, and all legal disclaimers that apply to the journal pertain.
References
- 1.Wenzel SE. Asthma phenotypes: the evolution from clinical to molecular approaches. Nat Med. 2012 May;18(5):716–25. doi: 10.1038/nm.2678. [DOI] [PubMed] [Google Scholar]
- 2.Moore WC, Meyers DA, Wenzel SE, Teague WG, Li H, Li X, et al. Identification of asthma phenotypes using cluster analysis in the Severe Asthma Research Program. Am J Respir Crit Care Med. 2010 Feb;181(4):315–23. doi: 10.1164/rccm.200906-0896OC. [DOI] [PMC free article] [PubMed] [Google Scholar]
- 3.Fitzpatrick AM, Teague WG, Meyers DA, Peters SP, Li X, Li H, et al. Heterogeneity of severe asthma in childhood: confirmation by cluster analysis of children in the National Institutes of Health/National Heart, Lung, and Blood Institute Severe Asthma Research Program. J Allergy Clin Immunol. 2011 Feb;127(2):382–389. doi: 10.1016/j.jaci.2010.11.015. [DOI] [PMC free article] [PubMed] [Google Scholar]
- 4.Boudier A, Curjuric I, Basagana X, Hazgui H, Anto JM, Bousquet J, et al. Ten-year follow-up of cluster-based asthma phenotypes in adults. A pooled analysis of three cohorts. Am J Respir Crit Care Med. 2013 Sep;188(5):550–60. doi: 10.1164/rccm.201301-0156OC. [DOI] [PubMed] [Google Scholar]
- 5.Howrylak JA, Fuhlbrigge AL, Strunk RC, Zeiger RS, Weiss ST, Raby BA. Classification of childhood asthma phenotypes and clinical responses to inhaled anti-inflammatory medications. J Allergy and Clin Immunol. 2014 May;133(5):1289–300. doi: 10.1016/j.jaci.2014.02.006. [DOI] [PMC free article] [PubMed] [Google Scholar]
- 6.Woodruff PG, Modrek B, Choy DF, Jia G, Abbas AR, Ellwanger A, et al. T-helper type 2-driven inflammation defines major subphenotypes of asthma. Am J Respir Crit Care Med. 2009 Sep;180(5):388–95. doi: 10.1164/rccm.200903-0392OC. [DOI] [PMC free article] [PubMed] [Google Scholar]
- 7.Baines KJ, Simpson JL, Wood LG, Scott RJ, Gibson PG. Transcriptional phenotypes of asthma defined by gene expression profiling of induced sputum samples. J Allergy Clin Immunol. 2011 Jan;127(1):153–60, 160. doi: 10.1016/j.jaci.2010.10.024. [DOI] [PubMed] [Google Scholar]
- 8.Long-term effects of budesonide or nedocromil in children with asthma. The Childhood Asthma Management Program Research Group. N Engl J Med. 2000 Oct;343(15):1054–63. doi: 10.1056/NEJM200010123431501. [DOI] [PubMed] [Google Scholar]
- 9.The Childhood Asthma Management Program (CAMP): design, rationale, and methods. Childhood Asthma Management Program Research Group. Control Clin Trials. 1999 Feb;20(1):91–120. [PubMed] [Google Scholar]
- 10.Murphy A, Chu JH, Xu M, Carey VJ, Lazarus R, Liu A, Szefler SJ, Strunk R, Demuth K, Castro M, Hansel NN, Diette GB, Vonakis BM, Adkinson NF, Jr, Klanderman BJ, Senter-Sylvia J, Ziniti J, Lange C, Pastinen T, Raby BA. Mapping of numerous disease-associated expression polymorphisms in primary peripheral blood CD4+ lymphocytes. Hum Mol Genet. 2010 Dec 1;19(23):4745–57. doi: 10.1093/hmg/ddq392. [DOI] [PMC free article] [PubMed] [Google Scholar]
- 11.Jonuleit H, Schmitt E, Schuler G, Knop J, Enk AH. Induction of interleukin 10-producing, nonproliferating CD4(+) T cells with regulatory properties by repetitive stimulation with allogeneic immature human dendritic cells. J Exp Med. 2000 Nov;192(9):1213–22. doi: 10.1084/jem.192.9.1213. [DOI] [PMC free article] [PubMed] [Google Scholar]
- 12.Zorn E, Miklos DB, Floyd BH, Mattes-Ritz A, Guo L, Soiffer RJ, et al. Minor histocompatibility antigen DBY elicits a coordinated B and T cell response after allogeneic stem cell transplantation. J Exp Med. 2004 Apr;199(8):1133–42. doi: 10.1084/jem.20031560. [DOI] [PMC free article] [PubMed] [Google Scholar]
- 13.Chambers J, Angulo A, Amaratunga D, Guo H, Jiang Y, Wan JS, et al. DNA microarrays of the complex human cytomegalovirus genome: profiling kinetic class with drug sensitivity of viral gene expression. J Virol. 1999 Jul;73(7):5757–66. doi: 10.1128/jvi.73.7.5757-5766.1999. [DOI] [PMC free article] [PubMed] [Google Scholar]
- 14.Gonzalez P, Zigler JS, Jr, Epstein DL, Borrás T. Identification and isolation of differentially expressed genes from very small tissue samples. Biotechniques. 1999 May;26(5):884–6. 888–92. doi: 10.2144/99265st01. [DOI] [PubMed] [Google Scholar]
- 15.Gu L, Tseng S, Horner RM, Tam C, Loda M, Rollins BJ. Control of TH2 polarization by the chemokine monocyte chemoattractant protein-1. Nature. 2000 Mar;404(6776):407–11. doi: 10.1038/35006097. [DOI] [PubMed] [Google Scholar]
- 16.Du P, Kibbe WA, Lin SM. lumi: a pipeline for processing Illumina microarray. Bioinformatics. 2008 Jul;24(13):1547–8. doi: 10.1093/bioinformatics/btn224. [DOI] [PubMed] [Google Scholar]
- 17.Irizarry RA, Hobbs B, Collin F, Beazer-Barclay YD, Antonellis KJ, Scherf U, et al. Exploration, normalization, and summaries of high-density oligonucleotide array probe level data. Biostatistics. 2003 Apr;4(2):249–64. doi: 10.1093/biostatistics/4.2.249. [DOI] [PubMed] [Google Scholar]
- 18.Newton MA, Kendziorski CM, Richmond CS, Blattner FR, Tsui KW. On differential variability of expression ratios: improving statistical inference about gene expression changes from microarray data. J Comput Biol. 2001;8(1):37–52. doi: 10.1089/106652701300099074. [DOI] [PubMed] [Google Scholar]
- 19.Kendziorski CM, Chen M, Yuan M, Lan H, Attie AD. Statistical meth- ods for expression quantitative trait loci (eQTL) mapping. Biometrics. 2006 Mar;62(1):19–27. doi: 10.1111/j.1541-0420.2005.00437.x. [DOI] [PubMed] [Google Scholar]
- 20.Yuan M, Kendziorski C. A unified approach for simultaneous gene clustering and differential expression identification. Biometrics. 2006 Dec;62(4):1089–98. doi: 10.1111/j.1541-0420.2006.00611.x. [DOI] [PubMed] [Google Scholar]
- 21.Mobini R, Andersson BA, Erjefalt J, Hahn-Zoric M, Langston MA, Perkins AD, et al. A module-based analytical strategy to identify novel disease-associated genes shows an inhibitory role for interleukin 7 Receptor in allergic inflammation. BMC Syst Biol. 2009;3:19. doi: 10.1186/1752-0509-3-19. [DOI] [PMC free article] [PubMed] [Google Scholar]
- 22.Breiman L. Classification and regression trees. Belmont, Calif: Wadsworth International Group; 1984. [Google Scholar]
- 23.Ripley BD. Pattern recognition and neural networks. Cambridge: Cambridge University Press; 1996. [Google Scholar]
- 24.Auerbach RK, Chen B, Butte AJ. Relating genes to function: identifying enriched transcription factors using the ENCODE ChIP-Seq significance tool. Bioinformatics. 2013 Aug;29(15):1922–4. doi: 10.1093/bioinformatics/btt316. [DOI] [PMC free article] [PubMed] [Google Scholar]
- 25.Benjamini Y, Hochberg Y. Controlling the false discovery rate: a practical and powerful approach to multiple testing. J Roy Stat Soc Series B Stat Methodol. 1995;57:289–300. [Google Scholar]
- 26.Covar RA, Fuhlbrigge AL, Williams P, Kelly HW the Childhood Asthma Management Program Research Group. The Childhood Asthma Management Program (CAMP): Contributions to the Understanding of Therapy and the Natural History of Childhood Asthma. Curr Respir Care Rep. 2012 Dec;1(4):243–250. doi: 10.1007/s13665-012-0026-9. [DOI] [PMC free article] [PubMed] [Google Scholar]
- 27.Barnes PJ. Corticosteroid resistance in patients with asthma and chronic obstructive pulmonary disease. J Allergy Clin Immunol. 2013 Mar;131(3):636–45. doi: 10.1016/j.jaci.2012.12.1564. [DOI] [PubMed] [Google Scholar]
- 28.Li LB, Leung DYM, Martin RJ, Goleva E. Inhibition of histone deacetylase 2 expression by elevated glucocorticoid receptor beta in steroid-resistant asthma. Am J Respir Crit Care Med. 2010 Oct;182(7):877–83. doi: 10.1164/rccm.201001-0015OC. [DOI] [PMC free article] [PubMed] [Google Scholar]
- 29.Ito K, Chung KF, Adcock IM. Update on glucocorticoid action and resistance. J Allergy Clin Immunol. 2006 Mar;117(3):522–43. doi: 10.1016/j.jaci.2006.01.032. [DOI] [PubMed] [Google Scholar]
- 30.Adcock IM, Ford PA, Bhavsar P, Ahmad T, Chung KF. Steroid resistance in asthma: mechanisms and treatment options. Curr Allergy Asthma Rep. 2008 Apr;8(2):171–8. doi: 10.1007/s11882-008-0028-4. [DOI] [PubMed] [Google Scholar]
- 31.Barnes PJ, Adcock IM. Glucocorticoid resistance in inflammatory diseases. Lancet. 2009 May;373(9678):1905–17. doi: 10.1016/S0140-6736(09)60326-3. [DOI] [PubMed] [Google Scholar]
- 32.Barnes PJ. Mechanisms and resistance in glucocorticoid control of inflammation. J Steroid Biochem Mol Biol. 2010 May;120(2-3):76–85. doi: 10.1016/j.jsbmb.2010.02.018. [DOI] [PubMed] [Google Scholar]