Abstract
The mechanical index (MI) is a theoretical exposure parameter for cavitational bioeffects of diagnostic ultrasound. The theory for the MI assumed that bubbles of all relevant sizes exist in tissue, a condition that is approximated for tissues that include a microbubble contrast agent. Therefore, the MI should allow science-based safety guidance for contrast-enhanced diagnostic ultrasound. However, theoretical predictions of bioeffects thresholds based on the MI typically do not concur with the frequency dependence of experimentally measured thresholds for bioeffects. For example, experimental thresholds for glomerular capillary hemorrhage in rats infused with contrast microbubbles increased approximately linearly with frequency (Miller et al. UMB 2008b; 34:1678), while the MI predicted a square-root dependence. Here, cavitation thresholds were computed for linear versions of the acoustic pulses used in that study assuming bubbles containing either air, C3F8, or a 1:1 mixture of the two and surrounded by either blood or kidney tissue. While no single threshold criterion was successful, combining results for one criterion that maximized circumferential stress in the capillary wall with another that ensured an inertial collapse produced thresholds that were consistent with experimental data. This suggests that a contrast-specific safety metric may be achieved following validation of this 2-criterion model.
Keywords: Bioeffects, Contrast bubbles, Cavitation threshold, Diagnostic ultrasound, Bubble modeling
Introduction
It goes without saying that it would be next to impossible to predict the effects of inertial cavitation on a physical system without some knowledge of the composition of the gas and vapor within the bubble as well as the nature of the surrounding material. Another factor of obvious importance is the size distribution of the bubbles involved. While it has always been known that bubbles in tissue must contain primarily nitrogen, oxygen and water vapor, and while there is also some information on the physical responses of tissue at MHz frequencies (Frizzell et al. 1977; Madsen et al. 1983; Yang and Church 2006), essentially nothing is known about the sizes of bubbles in tissues, including whether they exist at all. It was this very fact that forced Apfel and Holland (1991) to assume the existence of optimally sized bubbles in vivo when they developed the theory underlying the mechanical index (MI), a state of affairs that continues to this day (AIUM/NEMA 2004; IEC 2010, 2015).
There is one well-known and significant exception to this general state of ignorance. When an ultrasound contrast agent is used as part of an animal experiment or clinical study, then the size distribution of bubbles suspended in the blood in vivo is known, at least initially. The qualification “initially” is necessary for two reasons. First, because the bubble suspension in the syringe is at room temperature (e.g., ~22° C) while the animal’s blood is warmer (~37° C), the volume of each bubble will increase by about 5%. Second, when the encapsulating material is permeable to one or more of the gases within or outside the bubble, gas diffusion will occur. For example, if such a bubble contains air, then the oxygen content of the blood will be lower than that in the bubble, oxygen will tend to diffuse out, and the bubble will shrink. Conversely, if the bubble contains a significant fraction of a low-solubility gas, then the bubble will grow by counter-diffusion, a process in which the higher solubility gases dissolved in the blood, primarily nitrogen and oxygen, move into the bubble more quickly than the low-solubility gas moves out (van Liew and Burkard 1995). The unequal rates of diffusion result in the radius of a bubble being a function of time post injection (Katiyar and Sarkar 2010; Sarkar et al. 2009), although the change in size is not necessarily very great. The significance of using a contrast agent in studies of biological effects is that if the bubble size distribution is known or calculable, and for tissues having a known stress-strain relation, then in principle it should be possible to predict the threshold for bubble-related adverse effects in vivo.
This report moves toward that goal by combining evidence from several recent publications. These include: experimental results for the frequency-dependence of the threshold for capillary hemorrhage in the kidneys of rats infused with Definity™ obtained by Miller et al. (2008b), measurements of the size distribution of Definity™ microbubbles immediately prior to dosing reported by Goertz et al. (2007), the probability that a bubble of a given size will cross the capillary bed of the mammalian lung derived from data on the sizes of lung capillaries given by Hogg (1987), the model for the dynamics of spherical gas bubbles in soft tissue developed by Yang and Church (2005), the finding that assuming a bubble pulsating within a blood vessel remains spherical provides both a tractable problem and reasonable agreement with observations as discussed in Chen et al. (2011), and the method for estimating the threshold for inertial cavitation in vivo described by Church et al. (2015). The more significant portions of these are described in the Background and Methods, with some of the text below having been taken rather liberally from the original articles. Since many important details are necessarily omitted here, interested readers should consult the original works for additional information. This section is followed by results for various theoretical fits to the experimental data. Finally, there is a brief discussion of potential uses for this approach.
In considerations of bioeffects, the details of the microscopic physical mechanisms of action are uncertain for cavitational bioeffects in tissue. However, contrast microbubbles are confined to the blood vessels. The salient bioeffect of contrast-enhanced diagnostic ultrasound reported for various tissues, including muscle, heart, brain, and kidney, is capillary rupture producing a petechial hemorrhage (Miller et al. 2008a). This bioeffect is readily observable, of clear biological significance and serves as the threshold of concern for patient risk. While the modeling of specific mechanisms of capillary injury, such as capillary stretching (Qin and Ferrara, 2006; Miao et al. 2008), vessel invagination (Hosseinkhah et al. 2013), jet impingement (Chen et al. 2011), and fluid stress (Hosseinkhah et al. 2015), and possibly others, is an ultimate goal, such modeling likely would require extensive detailed theoretical analysis by three-dimensional finite-amplitude methods for any full accounting of the complex microbubble-capillary problem. Here, we pursue the general approach of the MI which was based primarily on theoretical microbubble behavior in an effort to obtain general insights into the problem. The philosophy of the MI as an exposure parameter was that the cavitation microbubble collapse threshold could be modeled as a surrogate to an actual theory of a specific bioeffect mechanism. Then, the bioeffect potential should be proportional to the MI, and the threshold for a bioeffect should fall at a constant value of the MI for different frequencies.
However, when the MI was developed as an exposure parameter, there was virtually no experimental research available for validation of the underlying model as a predictor of actual bioeffects. The situation has changed dramatically in the intervening 25 years. For example, if the MI is applied to the endpoint of capillary rupture, the microbubble having the minimum threshold for collapse, i.e., the optimally sized bubble, becomes smaller as frequency is increased. Because the capillaries are the same size regardless of ultrasonic frequency, the model underlying the MI implicitly assumes that the smaller and smaller volumes of perturbation produced by those ever smaller microbubbles at ever higher frequencies will still produce the same capillary rupture. This etiology seems faulty when considered on the basis of the simple concept that equal bioeffects at different frequencies should require equal levels of perturbation. In fact, experimental observations of the frequency dependence of capillary rupture in contrast-enhanced diagnostic ultrasound do not appear to follow the square-root dependence of the MI, at least for the case of glomerular capillary hemorrhage (GCH) in kidney. For the experimental findings, the threshold peak rarefactional pressure amplitude (PRPA) was approximately pr = 0.5f MPa where f is the exposure frequency normalized to 1 MHz, giving, for example, 2 MPa at 4 MHz. The present MI would relatively underestimate risk at low frequencies and overestimate risk at higher frequencies, if used for safety guidance in contrast-enhanced diagnostic ultrasound. The analysis of Apfel and Holland (1991) for blood would give a threshold dependence of pr = 0.29f0.6 MPa (e.g. 0.67 MPa at 4 MHz), which represents a substantially different frequency dependence than was discovered experimentally. The value of the MI at this threshold would be approximately 0.34. Here, the approach used for the MI to create a general exposimetry parameter is revisited and reconstructed for reconciliation with recent experimental observations. This study tested the hypothesis that concomitant use of two criteria, one for a traditional microbubble collapse threshold and the other for the requirement that the maximum bubble radius, Rmax, attain some minimum value, could provide a model and general exposimetric framework predictive of the capillary hemorrhage effect of contrast-enhanced diagnostic ultrasound.
Before continuing, it is useful to place this work in its proper context. A theoretical study of cavitation dynamics as it relates to capillary injury has recently appeared (Patterson et al. 2012). Their results for thresholds were dependent on the acoustic frequency, the gas content of the microbubbles, and the values chosen for the elastic constants of the tissue. In addition, the thresholds for bioeffects were above inertial cavitation thresholds previously reported. Patterson et al. (2012) concluded that two threshold criteria previously used to define inertial cavitation, i.e., the maximum temperature inside the bubble, Tmax = 5000 K and the maximum bubble radius Rmax = 2R0, are not appropriate for cavitation in a viscoelastic medium. In this work, two additional threshold criteria are employed, viz., that the maximum collapse speed is equal to the speed of sound in the surrounding medium Umax = C0, or that the maximum bubble radius is equal to a fixed value, e.g., 7 µm, rather than a multiple of the initial radius, e.g., 2R0. More significantly, the effect of combining two independent threshold criteria is also explored. This work, then, is properly viewed as an extension of the valuable and stimulating work of Patterson et al. (2012).
Background and Methods
Results for glomerular capillary hemorrhage (Miller et al. 2008b)
This study investigated the frequency dependence of glomerular capillary hemorrhage (GCH) induced in rats by diagnostic ultrasound (DUS) in the presence of an infusion of the contrast agent Definity™; the frequencies studied were 1.5, 2.5, 3.2, 5.0 and 7.4 MHz. A laboratory exposure system (LAB) was also used to simulate DUS exposures at PRPAs higher than were available from the clinical DUS systems; the frequencies studied were 1.0, 1.5, 2.25, 3.5, 5.0 and 7.5 MHz. Rats were mounted in a water bath, and their right kidneys were exposed to intermittent image pulse sequences at 1-second intervals during infusion of diluted contrast agent. To compensate for the progressive decrease in exposure volume with increasing frequency of the LAB system, multiple adjacent sites were exposed at frequencies above 1 MHz. The magnitude of GHC was quantified as a function of the PRPA at each frequency available. It is the threshold PRPA that is of interest here.
The values of the apparent threshold PRPA, pt, were roughly proportional to the ultrasound frequency, f, such that pt/f was approximately 0.5 MPa/MHz for DUS and 0.6 MPa/MHz for LAB exposures. In other words, the threshold was proportional to frequency over the tested frequency range rather than to the square root of frequency as postulated by the MI. These differences were statistically significant, which suggests that there is a fundamental disparity between experiment and theory when bubbles are known to be present.
It is important to note here that the values for PRPA reported by Miller et al. (2008b) were obtained by a method discussed in Miller et al. (2007). Briefly, the PRPA was first measured in water, then derated by an attenuation factor, which was measured by insertion of abdominal wall tissue samples from four rats between the probe and hydrophone, to provide the in situ value at the kidney. Thus the values for PRPA reported by Miller et al. (2008b) are derated water values. However, the method for derating, which was intended to provide a better estimate of the actual values of PRPA in vivo (which are necessary for optimal comparison with the computational results included in this report), was quite different from the method used for the MI. The latter method simply assumes a value for the slope of the total total attenuation coefficient for use with all tissues and exposure conditions (IEC 2010), rather than measuring it for a specific tissue and condition.
Results for Definity™ size distribution (Goertz et al. 2007)
This study characterized the frequency-dependant attenuation properties of Definity™ and populations of Definity™ that had been modified to preferentially isolate smaller bubbles through decantation or mechanical filtration. Although of considerable interest in its entirety, the principal value of the study to this work lay in the measurements of the initial size distribution of Definity™ microbubbles prior to dilution and infusion into the experimental animals. The relative number concentration per increment in diameter was calculated by dividing the relative volume concentration data given by Goertz et al. (2007) by the cube of the radius and renormalizing the result. The resulting data were skewed to the smaller diameters since most bubbles are in that region. The peak of the distribution for number concentration is at a diameter of 0.63 µm, a rather small value, but one that is consistent with the high-frequency response often observed with Definity™.
Results for gas bubble dynamics in soft tissue (Yang and Church 2005)
This study re-derived the Keller-Miksis equation for the dynamics of spherical gas bubbles in liquids in combination with the Voigt model for linear viscoelasticity to account for the strain-stress relation often observed in biological tissues. It was assumed that: (1) a spherical bubble is initially at rest (i.e., dR/dt = Ṙ = 0) in an infinite material, (2) there is no exchange of gas with the surrounding material, and (3) the bubble radius is small compared to the acoustic wavelength. The final equation is given by the following:
| (1) |
where R is the bubble radius, C0 is the speed of sound in the tissue, ρ is the density of the surrounding tissue, t is time, pa is the pressure at the bubble surface, and pI is the pressure at infinity; single and double overdots indicate the first and second derivatives with respect to time, respectively,
| (2) |
κ is the ratio of specific heats, σ is the surface tension, pg is the pressure of the gas in the bubble, p0 is the hydrostatic pressure (approximately 110 kPa in the glomerulus), PA is the acoustic pressure amplitude, g(t) gives the shape of the driving pressure wave, G is the shear modulus (modulus of rigidity), µ is the shear viscosity, and R0 is the initial value of the bubble radius. For convenience in these computations, the gas within the bubble is assumed to pulsate adiabatically, . Consideration of the behavior and influence of the microbubble stabilization shell is omitted here because only relatively high-amplitude conditions are evaluated, for which a free microbubble is liberated almost immediately (Sboros et al. 2002; Marmottant et al. 2005).
In general, the model predicts that the presence of the elasticity of the tissue, as well as its increased viscosity (above that of water or blood), can suppress bubble responses. For example, sub-harmonic signals may only be detectable in certain ranges of bubble radius and pressure amplitude. Further, and of greater interest here, the threshold acoustic pressure required for a bubble to undergo inertial cavitation may also increase (also see Patterson et al. 2012; Church and Yang 2006).
Results for cavitation in tissue due to ARFI pulses (Church et al. 2015)
This study investigated the likelihood that acoustic radiation force impulse (ARFI) imaging, which employs high-intensity pulses up to several hundred acoustic periods long, could induce inertial cavitation in water, blood, urine and six representative soft tissues. Thresholds were determined by performing numerical computations similar to the analytical work underlying the MI but varying the pulse length over the range 1 – 100 acoustic periods. Four criteria for the threshold acoustic pressure (Pt) were used, three assuming adiabatic conditions within the bubble: Rmax = 2R0, Umax,a = 1C0, and Tmax = 5000 K (the criterion used for the MI), and one assuming isothermal conditions for the gas: Umax,i = 1C0,. The method used to define the threshold for inertial cavitation, pt, was essentially the same as that used by Apfel and Holland (1991). For a given combination of parameters, the minimal pressure amplitude required to satisfy the cavitation threshold criterion was determined for each equilibrium bubble radius in the range studied, 0.1 – 10.0 µm, and the global value for pt, was then taken from the threshold for the bubble requiring the least acoustic pressure to satisfy the given threshold criterion; that bubble was described as being “optimally sized”. This procedure was repeated for each frequency, pulse length, and material studied.
It was found that the effect of pulse duration on cavitation thresholds in the liquids can be considerable, reducing them by, e.g., 6% – 24% at 1 MHz. In contrast, the effect in tissue is minor, with the reduction in threshold being no more than 2% – 4%. In addition, while the threshold data were well fit by the equation pt = bfa, equivalent to the expression used by Apfel and Holland (1991), the value of the exponent on frequency, a, is greater than the 0.5 assumed for the MI, with the value for the temperature threshold criterion (Tmax = 5000 K) being approximately 0.75.
The results for kidney are of particular interest here. The thresholds from Church et al. (2015) are closer to the experimental results of Miller et al. (2008b), particularly for the calculations performed using values of parameters appropriate for kidney tissue at the lower frequencies, G = 180 kPa and µ = 5 mPa·s. However, the values of the exponents on frequency a, equivalent to the slopes of the two theoretical threshold curves when given on log-log plots, are still less than the experimental values, ~0.70 vs ~1.00.
New methods
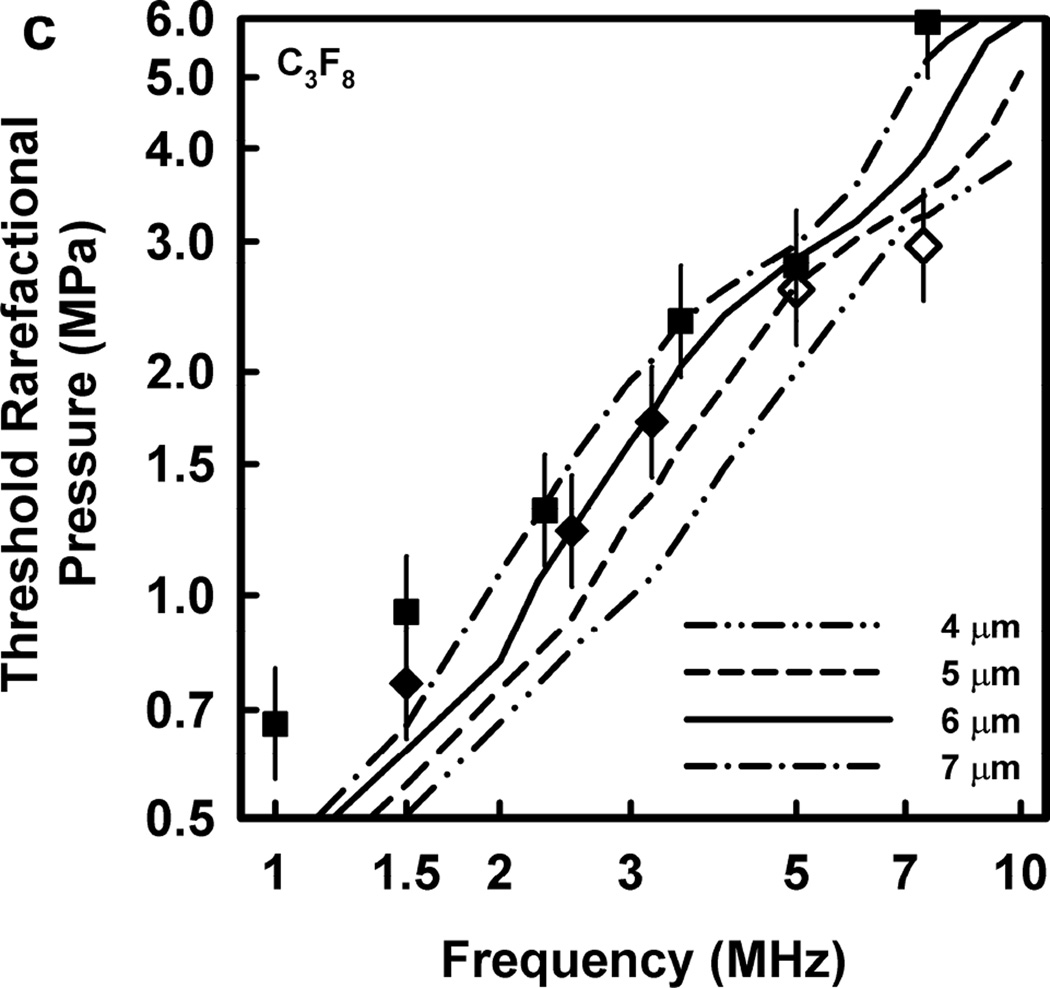
The foregoing results and approaches to the problem were extended in the following ways. First, because the gas in microbubbles of Definity™ [the contrast agent used by Miller et al. (2008b)] is C3F8 (perfluoropropane or Perflutren), the value for the ratio of the specific heats (κ) was modified from the 1.4 of air to a value appropriate for that gas, 1.06 (Yaws, 2001). Second, the collapse temperature of a bubble containing a polyatomic gas such as C3F8 will not increase very much unless the collapse is very violent indeed. In order to avoid spurious results due to this effect, the threshold criterion was changed from that used for the MI, Tmax = 5000 K, to one that has a similar threshold for air bubbles and thus appears to involve a similarly violent collapse. This was Umax = C0, i.e., that the maximum collapse speed is equal to the speed of sound in the surrounding medium. Third, because the gas content of the microbubbles is not constant, three different gases were studied: pure C3F8, a 1:1 mixture of C3F8 and air, and pure air; the values of κ were 1.06, 1.24, and 1.4, respectively. Finally, in addition to assuming that the threshold for capillary bioeffects is equal to the lowest value of pr for collapse found for any bubble in the range of radii studied (0.1 – 10.0 µm), the effect of applying two threshold criteria simultaneously was investigated, Umax = C0 and Rmax = X µm. The first is the criterion on collapse speed mentioned above calculated assuming the thermal behavior of the gas is adiabatic. The second criterion is a requirement that the maximum bubble radius attain a particular, fixed value, with X = 4, 5, 6 or 7 µm. In essence this second criterion provides a constant geometric scaling relevant to the constant capillary diameter.
The reason for considering this new and perhaps unorthodox criterion is to ensure that the stress on the capillary wall is maximized. This requires that the fluid between it and the bubble wall be displaced such that the tissue itself form part of the interface with the gas. Once this is accomplished, the capillary wall is sufficiently flexible that it will “follow” the radial motion of the bubble and thus allow little or no fluid to reinsert itself between the bubble and capillary wall. This assumption is based on the results of Hosseinkhah and Hynynen (2012) and Hosseinkhah et al. (2013) who modeled the responses of bubbles in capillaries of various sizes. In general, they found that the shear stress was greater when the ratio of the bubble radius to the vessel radius was larger, and the circumferential stress was largest when the bubble wall was closest to the vessel wall. The concept is illustrated by Fig. 4 of Chen et al. (2010), reproduced here as Fig. 1. Thus it may be assumed that the stresses and strains in the capillary wall will be maximized under these conditions, which provides a connection of our general approach to specific mechanisms of action.
Figure 1.
Four selected frames from a high-speed image sequence of a bubble cluster in a vessel in rat mesentery having an initial diameter ~50 µm, exposed to a 1-MHz pulse with PRPA ~6.5 MPa. The sequence shows that under conditions of low tissue rigidity, a bubble can easily expand to a size much greater than the equilibrium radius of the vessel, thus removing the fluid between the vessel wall and the bubble. The sequence also suggests that vessel invagination may play a more important role in causing vessel rupture than distention since invagination appears to generate higher strains on the wall than does distention. Reproduced from Fig. 4 of Chen et al. (2010).
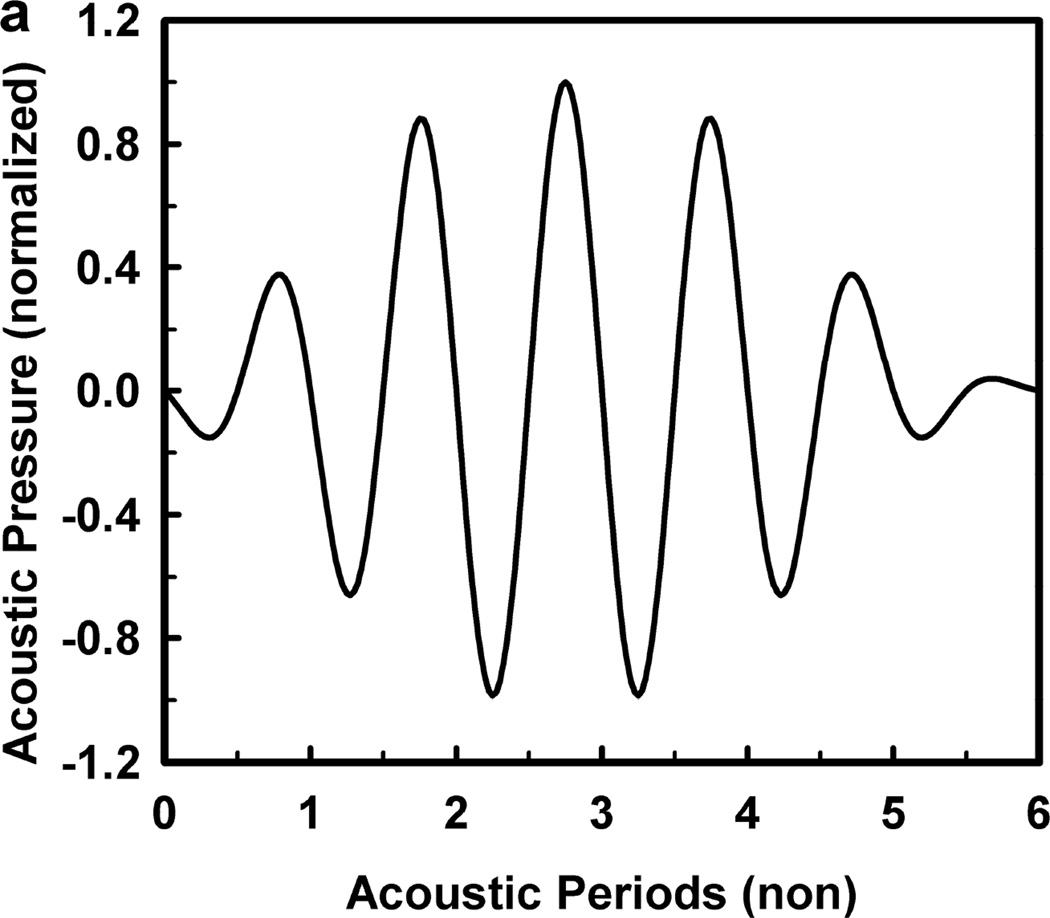
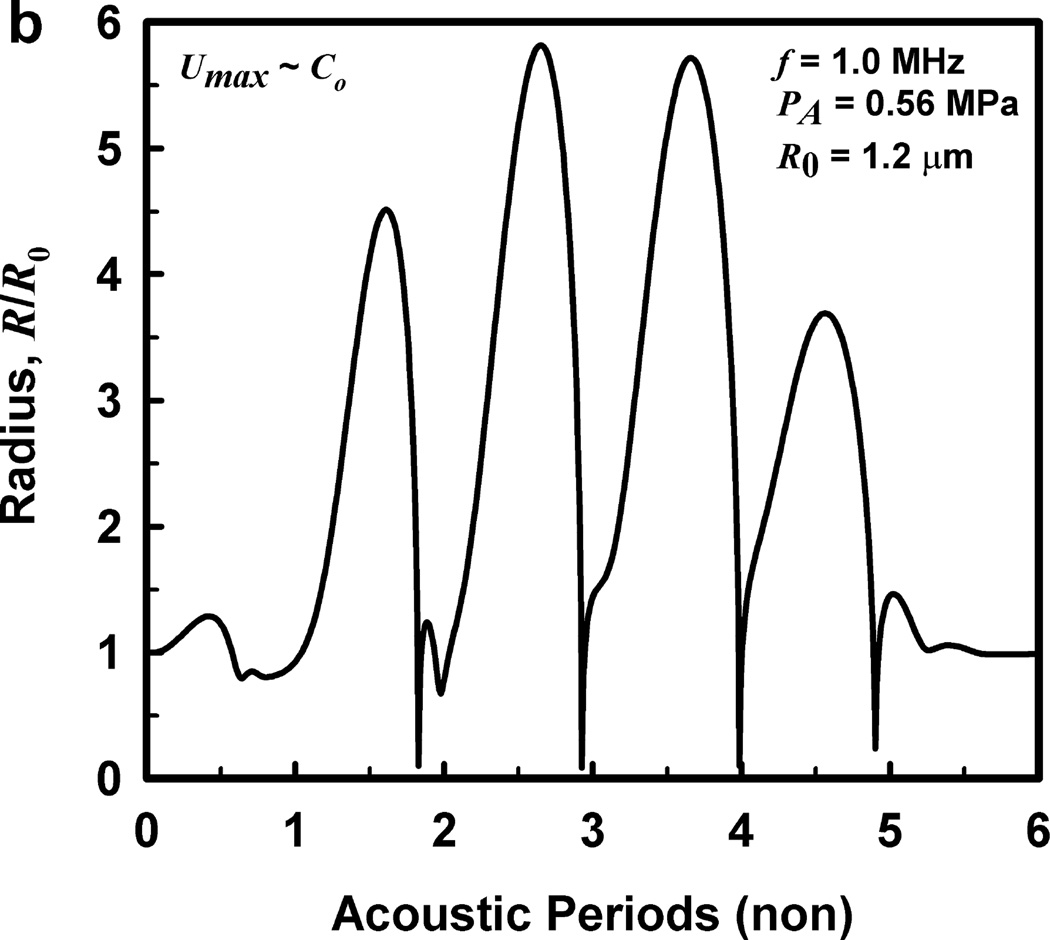
For these computations, the acoustic frequency ranged from 0.5 to 10.0 MHz, and the pulse duration was fixed at three acoustic periods in keeping with the experimental protocol of Miller et al. (2008b). The driving pressure was symmetrical, a sine wave within a modified Gaussian envelope, defined by the equation where ω is the angular frequency and tc and tw specify the center and the width of the pulse, respectively. The shape of the waveform is shown in Fig. 2, as is the radial response for a 1-µm air bubble in a weakly viscoelastic material (G = 2 kPa, µ = 5 mPa·s) driven by a 1-MHz pulse at 0.46 MPa (the cavitation threshold for Tmax = 5000 K). The symmetrical waveform used in this study is in contrast to the experimental waveforms which were distorted by the effects of nonlinear propagation, and is a convenient simplification for the theoretical analysis (Patterson et al. 2012). Fortunately, the error produced by this simplification is relatively small (Aymé and Carstensen 1989), although it will increase with increasing frequency. The values of the density (ρ), interfacial tension (σ), rigidity (G) and viscosity (µ) for blood were 1050 kg m−3, 0.056 N m−1, 0.0 kPa and either 3 or 5 mPa·s, respectively, while those for kidney tissue were 1100 kg m−3, 0.056 N m−1, either 0 kPa, 1 kPa, 2 kPa or 0.18 MPa and 3 – 23 mPa·s, respectively. These values encompass bulk-tissue values for rigidity reported for kidney from ultrasound elastography methods for frequencies below 1 kHz (Arda et al. 2011; Amador et al. 2011;Derieppe et al. 2012; Gennisson et al. 2012; Grenier et al. 2013; Moon et al. 2015) and a direct shear-wave method for frequencies above 6 MHz (Yang and Church 2006). It is worth noting here that in all cases for which sufficient data are available for comparison over several orders of magnitude for frequency, the values for the modulus of rigidity in tissue tend to remain the same, while values for viscosity decrease by a factor of 100 (see also Madsen et al. 1983; Deffieux et al. 2009; Chen et al. 2013). The effect of this decrease on bubble dynamics will be the subject of a separate report.
Figure 2.
The acoustic pressure waveform used in these studies (a), and (b) a representative radius-time curve for a 1.2 µm bubble driven by a 1-MHz pulse at 0.56 MPa.
The relatively large ranges in the values for the rigidity and viscosity of renal tissue were used in an initial study to determine whether an unexpected combination of parameters that might exist in the microscopic vicinity of microbubbles in capillaries could produce a more satisfactory agreement between theoretical and experimental values for the threshold for GCH. The range of equilibrium bubble radii (R0) studied was 0.1–10.0 µm, or somewhat broader than the actual distribution of sizes likely to be present in vivo (Hogg 1987; Weibel 1963). A fourth-order Runge–Kutta technique was used to solve a series of initial value problems to determine the threshold pressure to within 1% for each combination of parameters at each frequency and value of R0, see Church et al. (2015) for details.
Statistics
The best fit of each set of threshold data in the range 0.5 – 10 MHz to the equation pt = bfa was found using a least-squares analysis in TableCurve 2D (Systat Software, Inc., San Jose, CA). The goodness of fit for each line was assessed using the square of the correlation coefficient (r2) adjusted for the degrees of freedom, the standard error of the fit, and the F-ratio. The 95%-confidence intervals were calculated for the fitting parameters as well as the best-fitting line. The confidence intervals on the parameters for the fits to the theoretical thresholds were used to judge the agreement between the frequency responses determined theoretically and experimentally. In some cases, the RMS error between experimental and theoretical values was calculated using Excel® (Microsoft Corp., Redmond, WA).
Results and Discussion
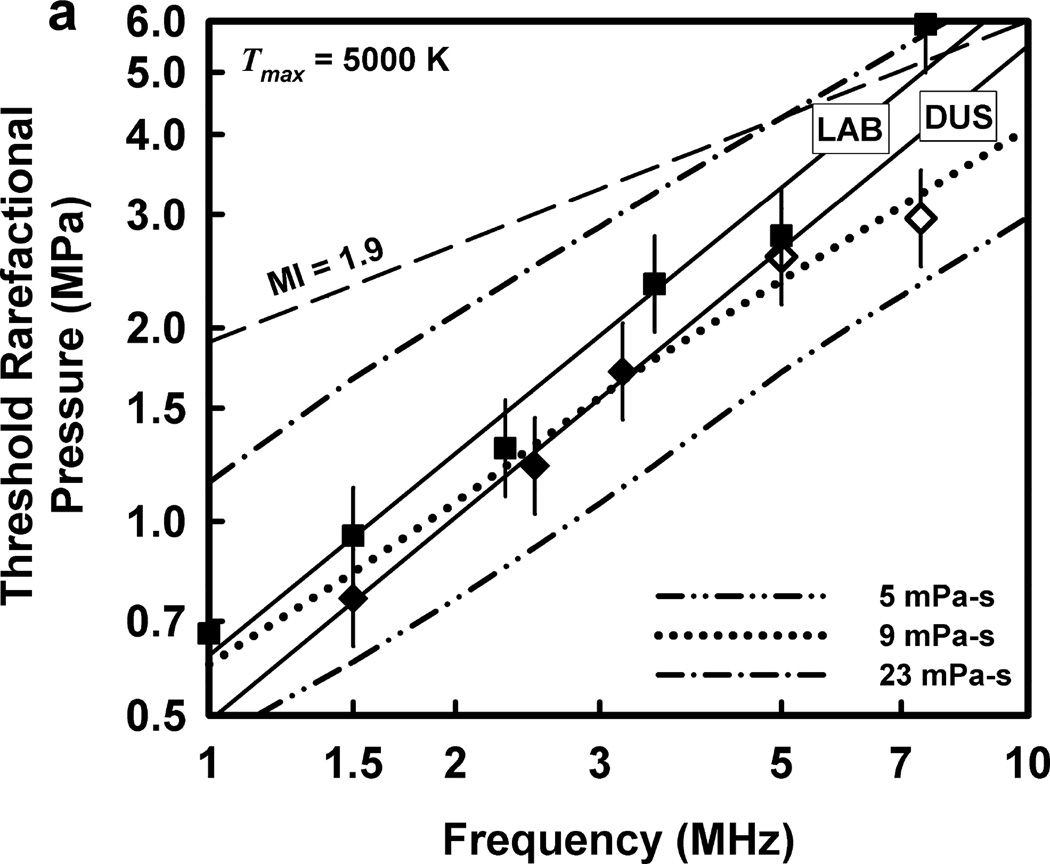
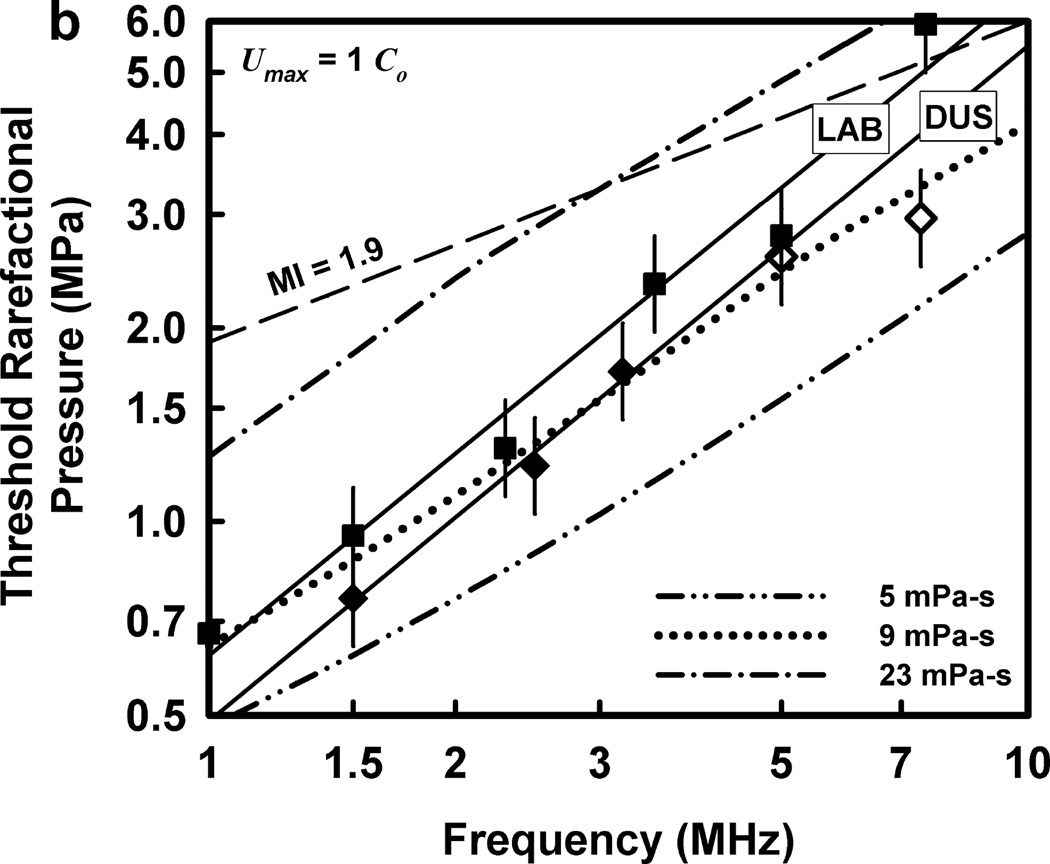
The thresholds calculated for optimally sized bubbles filled with 100% air are given in Fig. 3 for the two threshold criteria, Tmax = 5000 K and Umax = C0, respectively, a rigidity of 2 kPa and viscosities in the range 5–23 mPa·s. The dash-dotted curves show the predictions for cavitation thresholds for the pulse waveform in Fig. 2 at the lowest and highest values of viscosity studied. The curves in Fig. 3 labeled “5 mPa·s” are nearly identical to those of Church et al (2015), indicating that neither the specific shape of the waveform nor the effect of a low value of rigidity (180 kPa vs 2 kPa in Fig. 3) has a significant influence on the theoretical thresholds. Note too that the corresponding theoretical curves for the two threshold criteria are also nearly identical, showing that air-filled bubbles collapse with approximately equal mechanical violence in the two cases. To maintain this approximate equality across results for all gases used in this study, only the collapse-speed criterion will be used for the remainder of this report.
Figure 3.
Theoretical threshold values of PRPA for threshold criteria of (a) Tmax = 5000 K and (b) Umax = Co for G = 2 kPa and µ = 5, 9 and 23 mPa·s. Also shown are the results of Miller et al. (2008b) for experimental thresholds of GCH for the LAB exposure system (squares) and the DUS system (diamonds, open symbols show the “no-effect” level at the highest outputs available); the straight lines are the best fits through the positive results for the two systems. The dashed line labeled MI =1.9 represents the upper limit on the MI for diagnostic scanners approved under the FDA’s track 3 process.
The dotted curves in Figs. 3 are for an intermediate value of viscosity, 9 mPa·s. This value produces the lowest rms error relative to the data for the DUS exposures, i.e., the diamond-shaped points. The viscosities yielding the lowest rms errors for the LAB exposures were higher, 15 and 17 mPa·s for Umax,a = C0 and Tmax = 5000 K, respectively. The rms error was calculated for each of the viscosities for both threshold criteria and both sets of experimental data in an attempt to obtain a single value providing a best fit, but no such value was found. In any case, the slopes of the theoretical curves are less than the slope of the best-fitting lines for both the DUS and LAB exposure systems. This is taken as evidence that thresholds determined in this way cannot provide satisfactory fits to the experimental data.
An additional piece of information regarding these thresholds is that the optimally sized radii are rather small. For example, for the results shown in Fig. 3, the optimal radii are in the range 0.60 – 0.28 µm from 1.0 – 10.0 MHz, respectively, at 5 mPa·s. Because these bubbles are so small, there is no obvious interaction between the bubble and the surrounding tissue that could produce the magnitude of damage required for GCH or petechial hemorrhage; NB – the mechanism is thought to be the same for both endpoints. Consider the case in which the bubble is immediately adjacent to the tissue when it collapses. Even if a liquid jet forms and punctures the capillary wall, the resulting hole would be so small that few (if any) blood cells could leak through it in the few minutes between exposure and sacrifice. The alternative mechanism, a radiated shock wave, also seems unlikely to produce sufficient damage. Since the acoustic impedance of the capillary wall is similar to that of the blood and urine, a shock wave will not “push” the tissue hard enough for long enough to burst the capillary wall. Apparently a different general mechanism is needed, one that involves repeated high-stress interaction with the capillary.
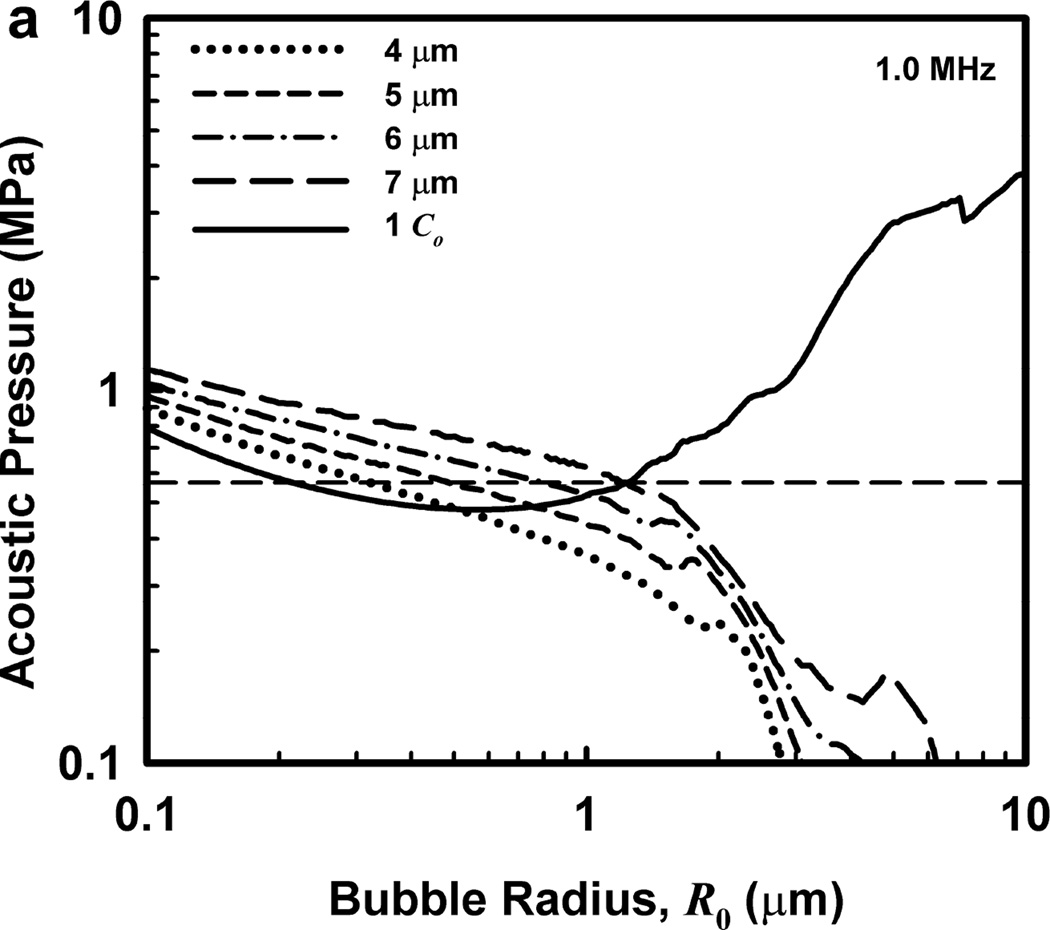
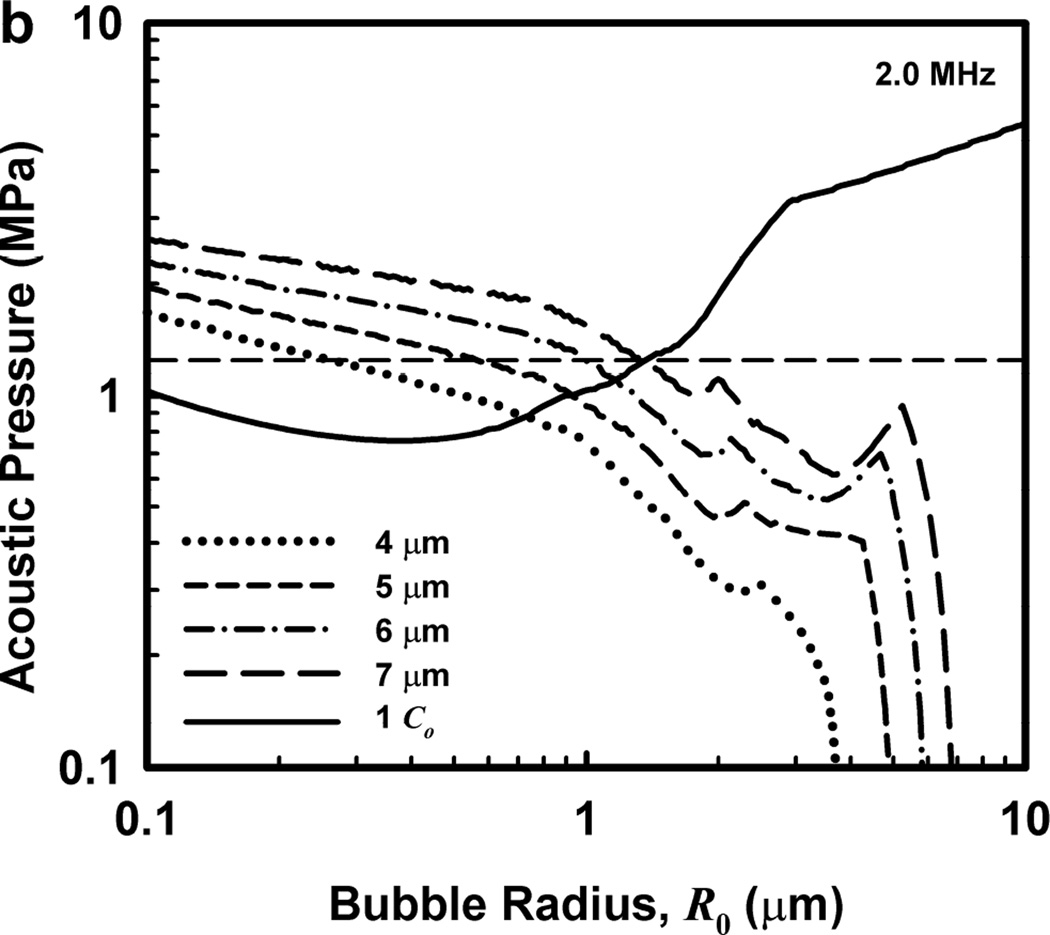
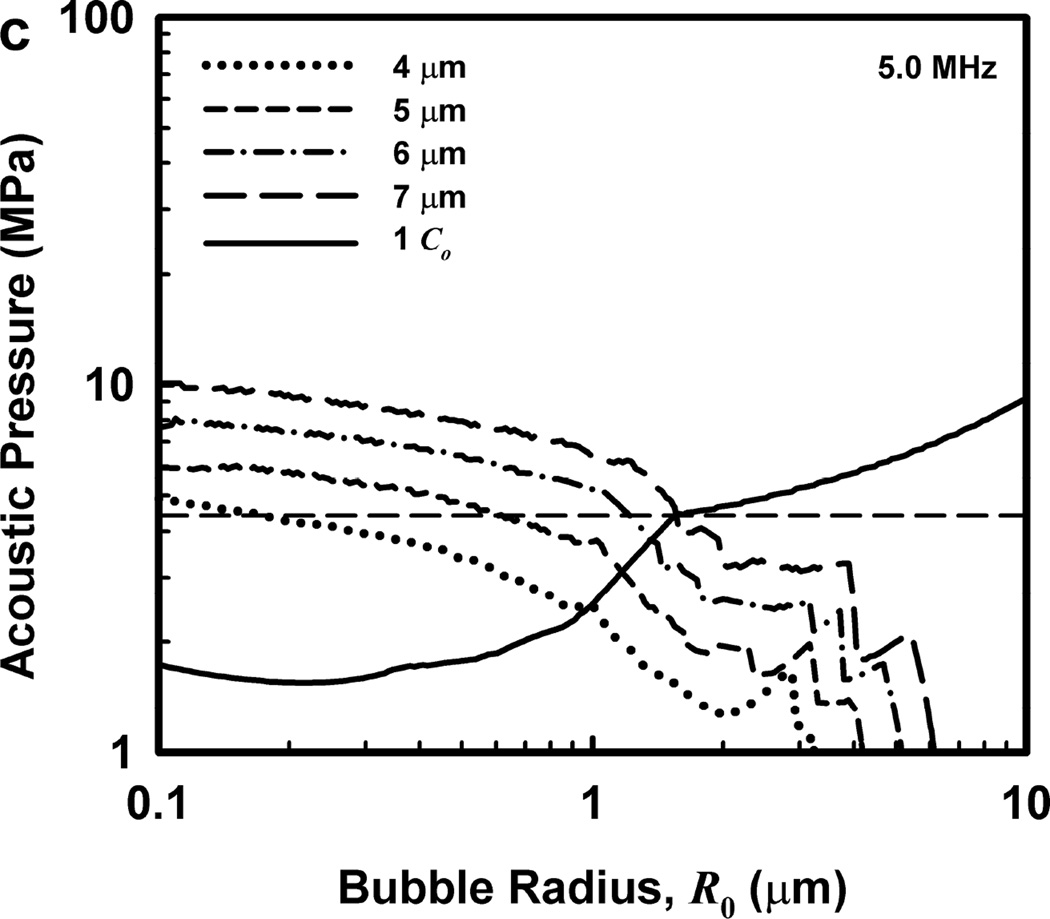
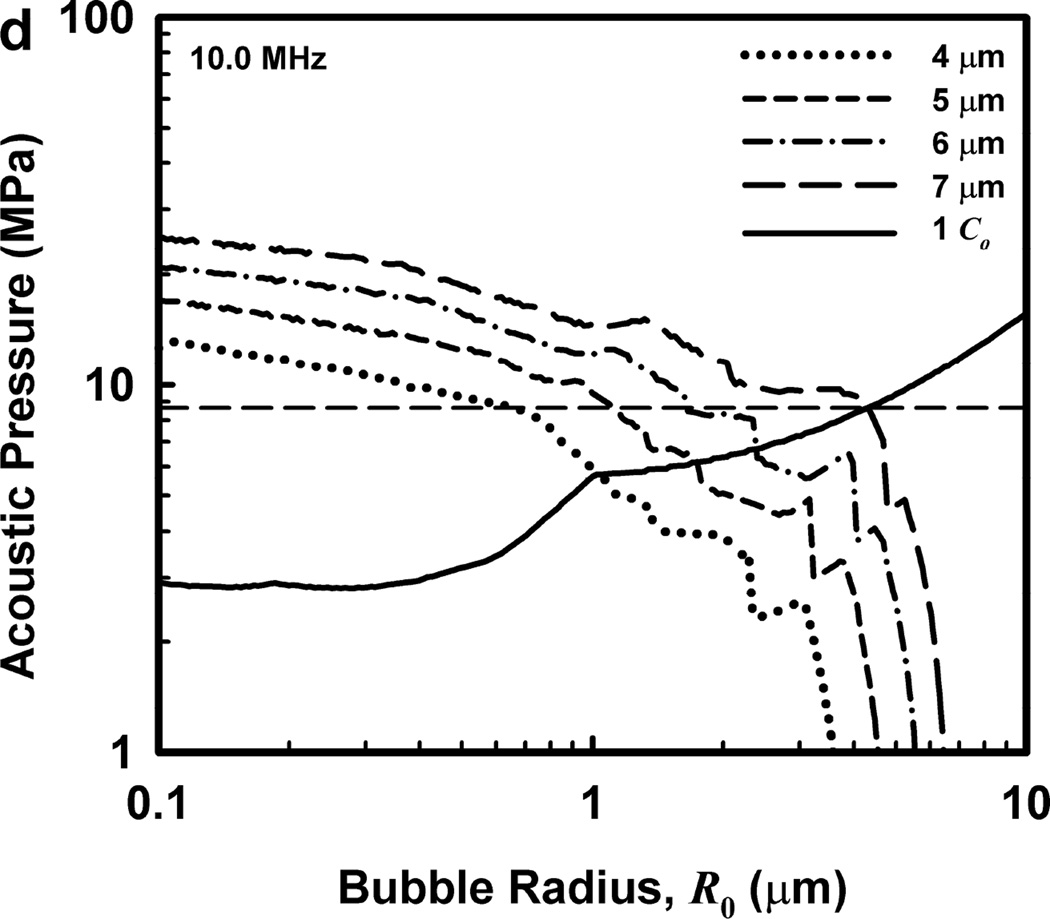
Illustrative results for the new threshold criterion, i.e., that the bubble must attain a maximum radius of 4, 5, 6, or 7 µm in order for capillary rupture to occur, are presented in Fig. 4. It is important to note that the requirement for a bubble to attain a fixed value of radius means that small microbubbles must expand to many times their initial size while larger ones may need to grow only marginally. This is reflected in the threshold curves in Fig. 4, again calculated for G = 2 kPa and µ = 5 mPa·s, which fall toward zero as R0 approaches their respective criteria on Rmax.
Figure 4.
Cavitation thresholds for air bubbles at 1, 2, 5 and 10 MHz for threshold criteria of Rmax = 4, 5, 6, and 7 µm (dotted, short-dashed, dot-dashed and long-dashed curves, respectively) and Umax = Co (solid curve). The horizontal dashed lines show the 2-criterion threshold for Rmax = 7 µm.
Also shown in Fig. 4 is the threshold for Umax = Co, which is used here as a surrogate for the requirement that a high level of stress be induced in the material immediately adjacent to the bubble during a collapse; the precise magnitude of the stress required for capillary rupture is not known. The guiding principle of this paper is that both threshold criteria must be met in order for capillary rupture, and thus GCH, to occur. The size criterion ensures that tissue is adjacent to the bubble during its collapse, and the collapse-speed criterion ensures that the tissue is exposed to sufficient stress that rupture will inevitably follow. This mechanical process would first create moderate outward stress, followed by strong inward stress and invagination possibly comparable to that observed by Hosseinkhah et al. (2013). The threshold acoustic pressure pt, is taken as the lowest value required to satisfy both criteria for any bubble radius in the range investigated. This is the same approach taken by Apfel and Holland (1991) during the development of the MI. It is also worth pointing out that in this model, both the magnitude of the strain as well as the rate of strain are, or may be, important aspects of the mechanism for capillary rupture.
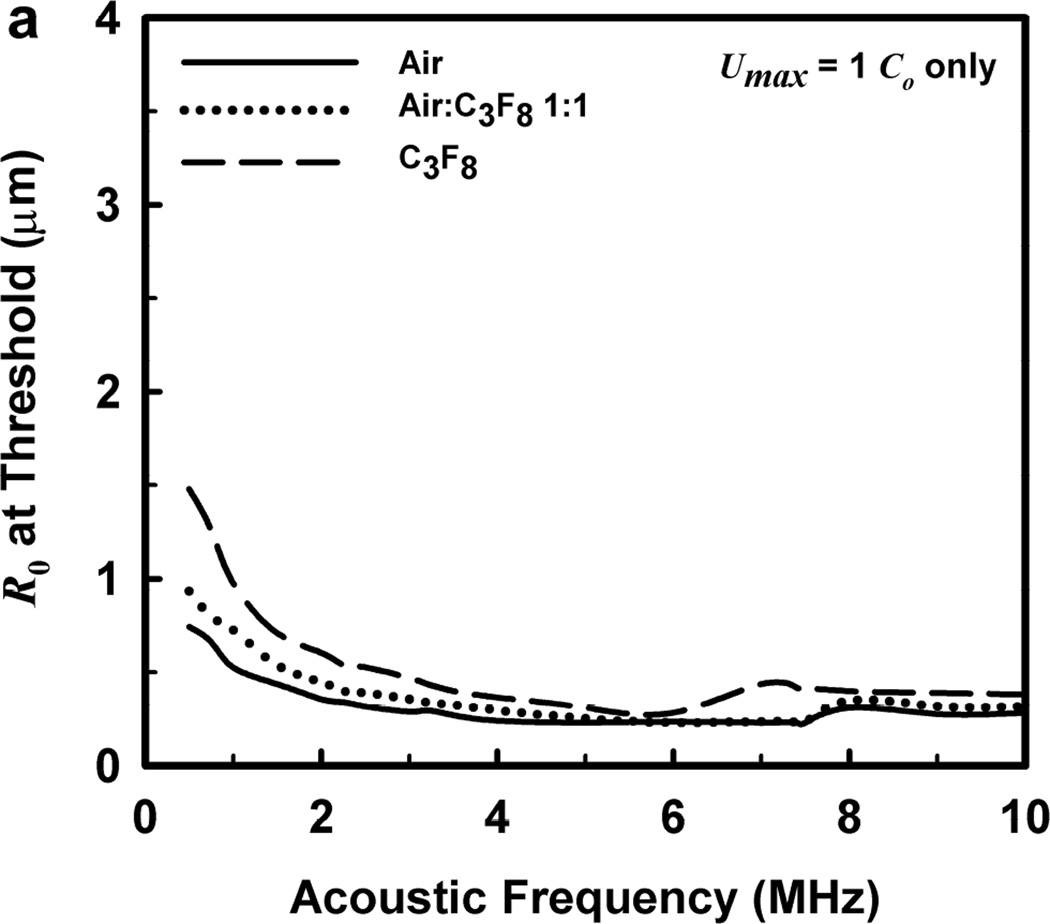
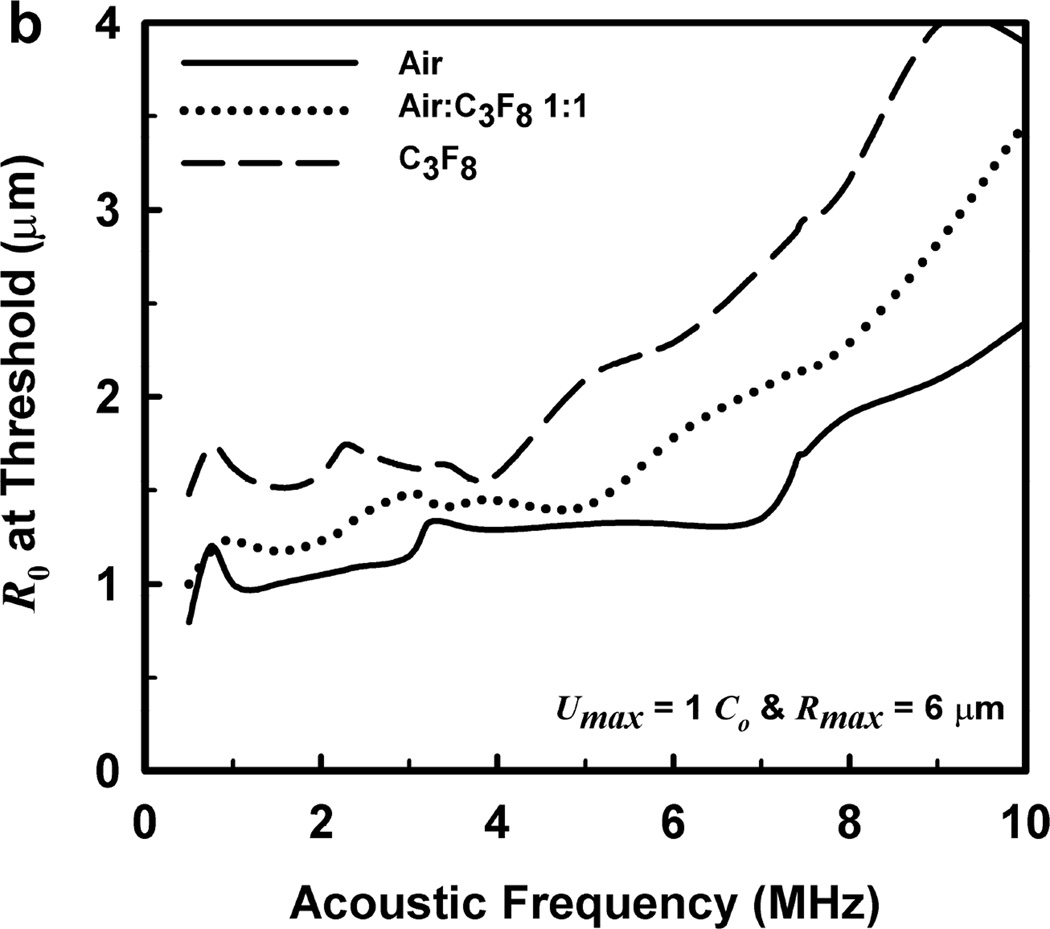
One other aspect of the 2-criterion model is apparent from consideration of the plots in Fig. 4. Specifically, the value of the radius of optimally sized bubbles increases as the driving frequency increases. This is in stark contrast to the usual rule that higher frequencies drive smaller bubbles to cavitate before larger bubbles. As shown in Fig. 5, this rule holds for the MI but not for the 2-criterion model. At the lowest frequency shown, 0.5 MHz, the values for R0 are about the same for each of the three gases, but they immediately begin to diverge as frequency increases. For example, at 0.5 MHz, the optimal radii for the 2-criterion model are 0.79, 1.00 and 1.48 µm for bubbles of air, air:C3F8 1:1, and C3F8, respectively, and they are 0.74, 0.93 and 1.48 µm when only the collapse-speed criterion must be satisfied. When the frequency is 5 MHz however, the former set of radii has increased to 1.32, 1.41 and 2.09 µm while the latter has decreased to 0.23, 0.25 and 0.31 µm. This difference immediately suggests a potential method for experimental verification of the new model.
Figure 5.
Equilibrium bubble radii at the cavitation threshold as a function of exposure frequency for the three gases of interest. The curves in (a) are obtained when only the collapse-speed criterion must be satisfied, while those in (b) show the results for the 2-criterion model when Rmax = 6 µm; results for other values of Rmax are similar.
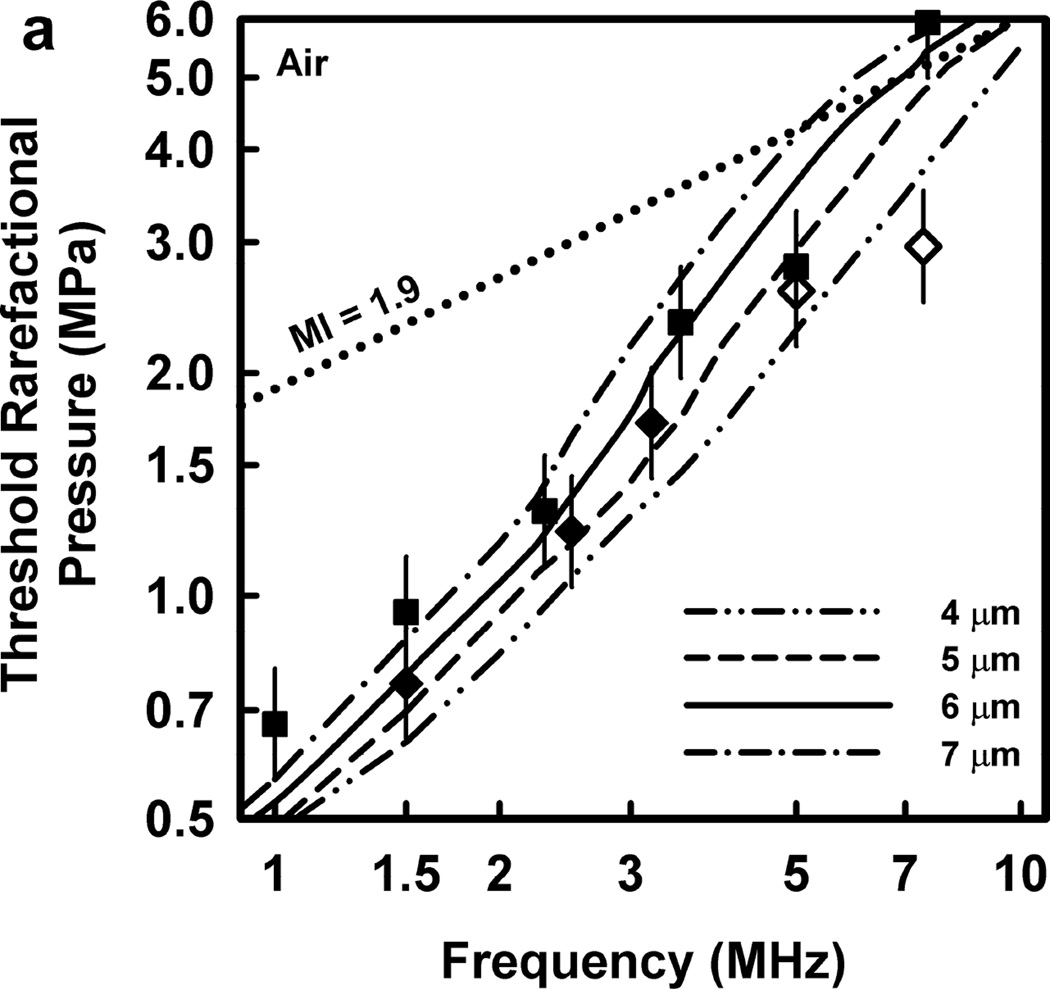
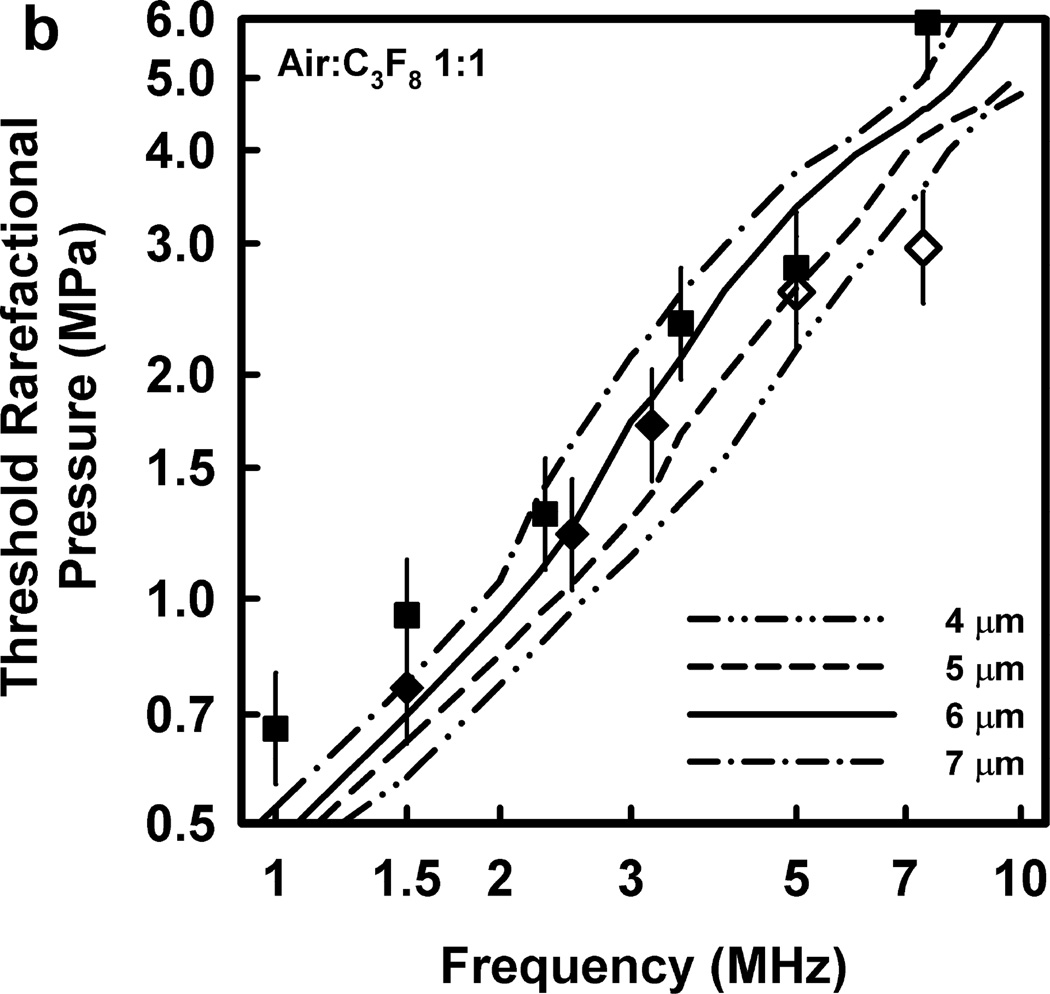
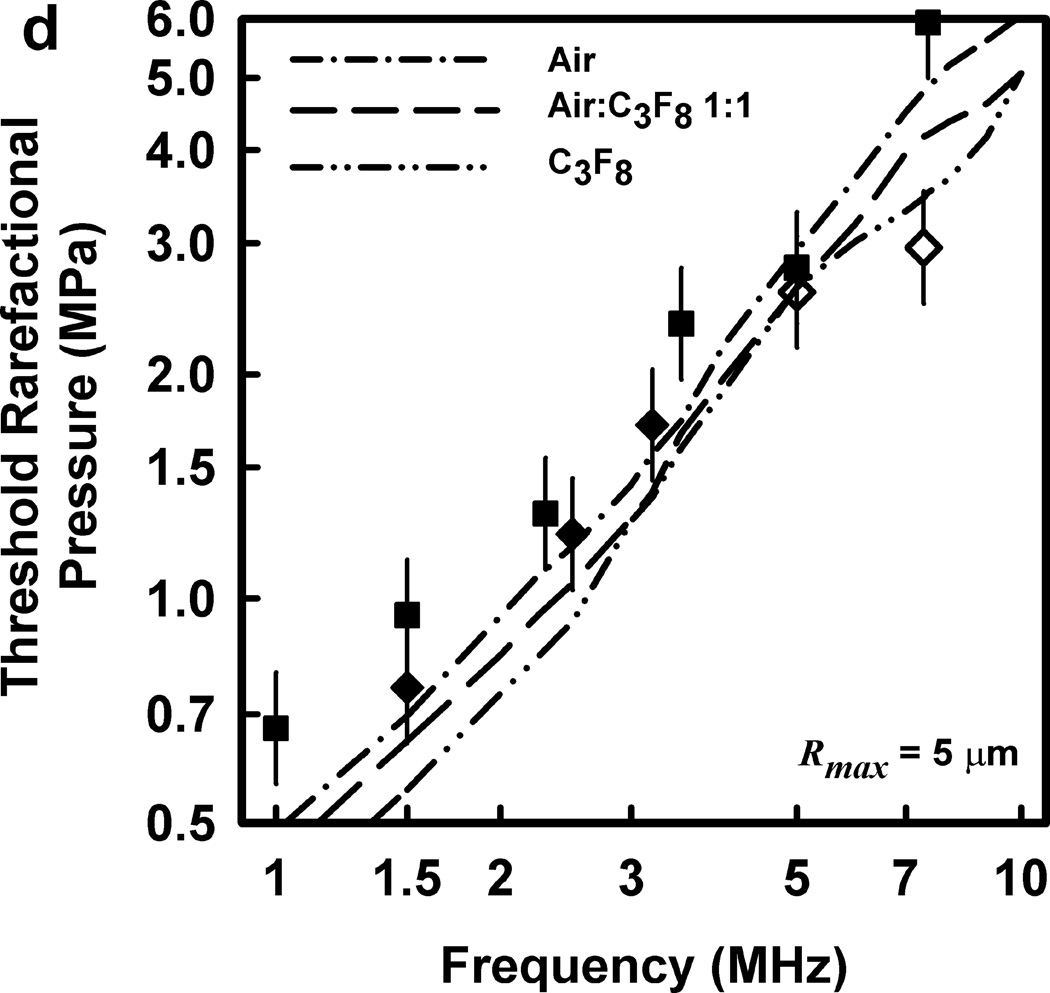
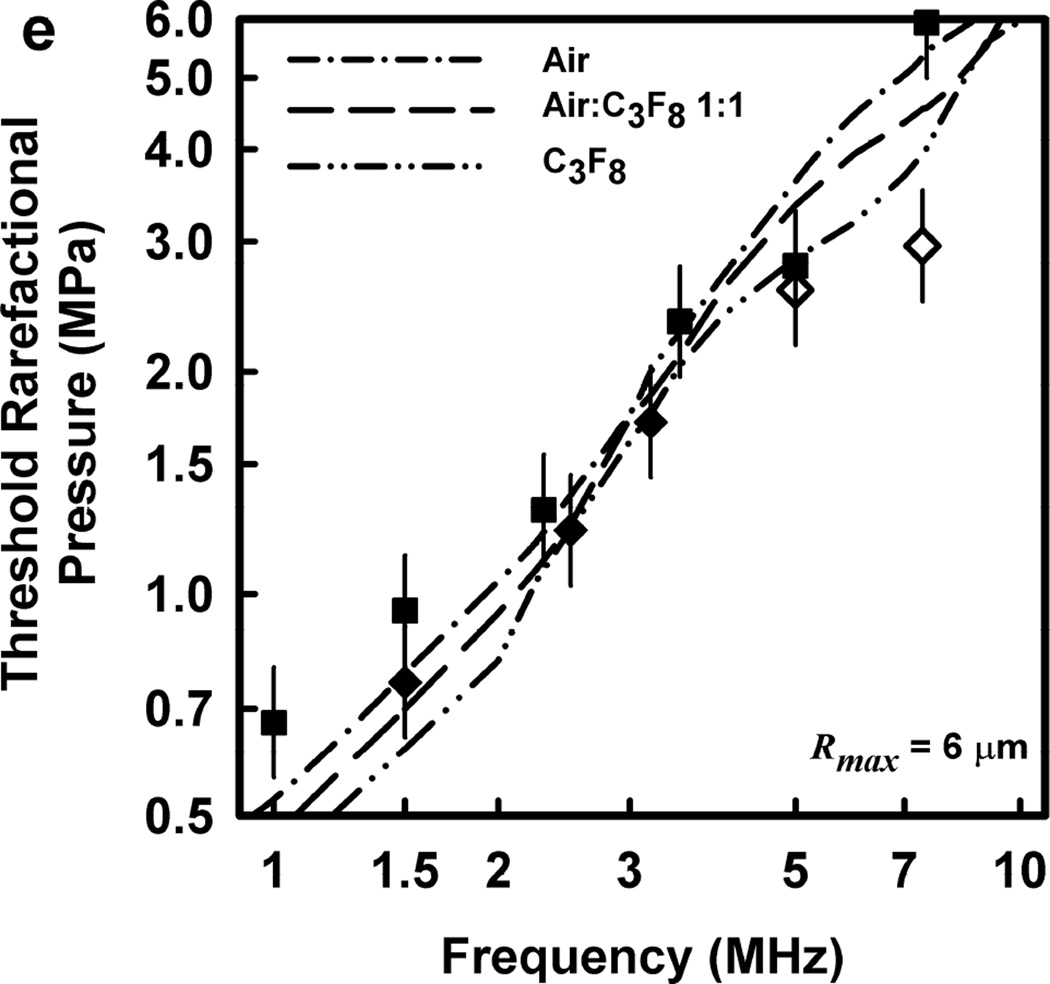
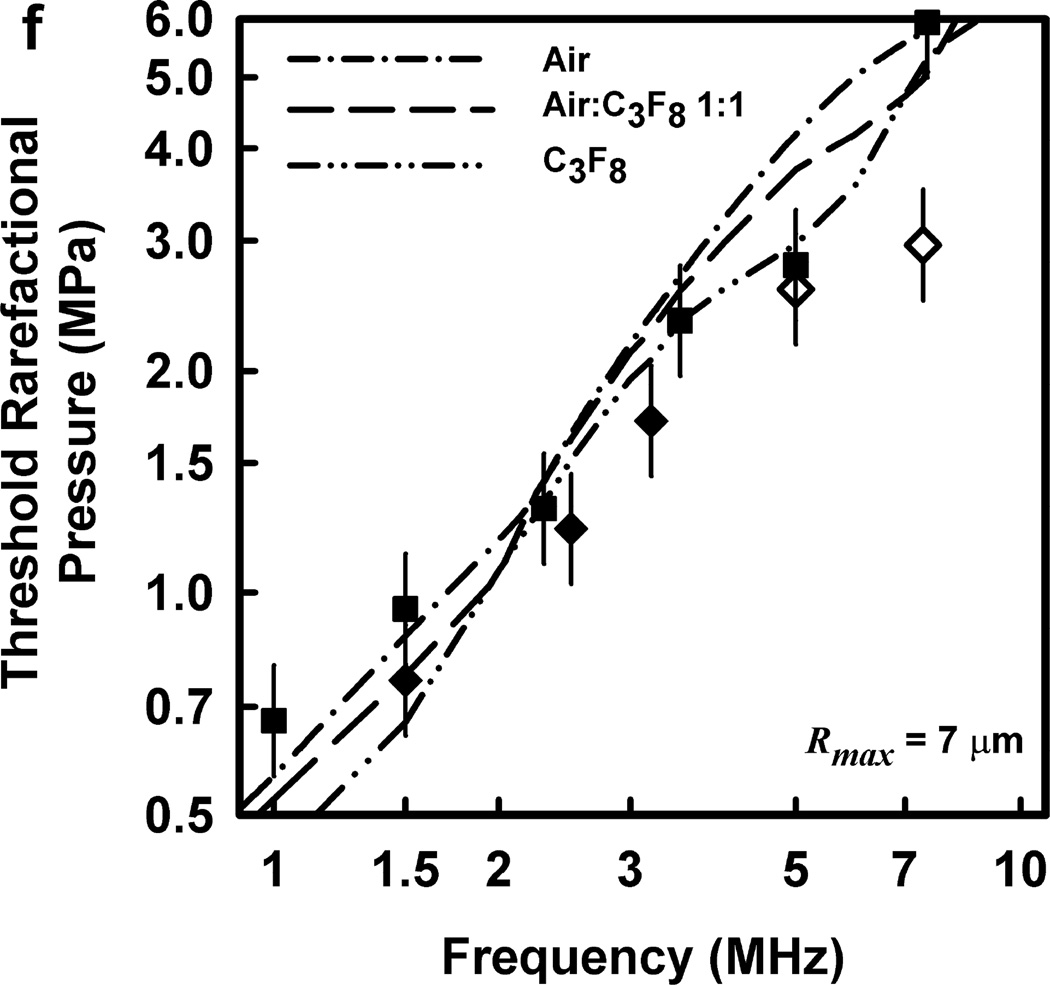
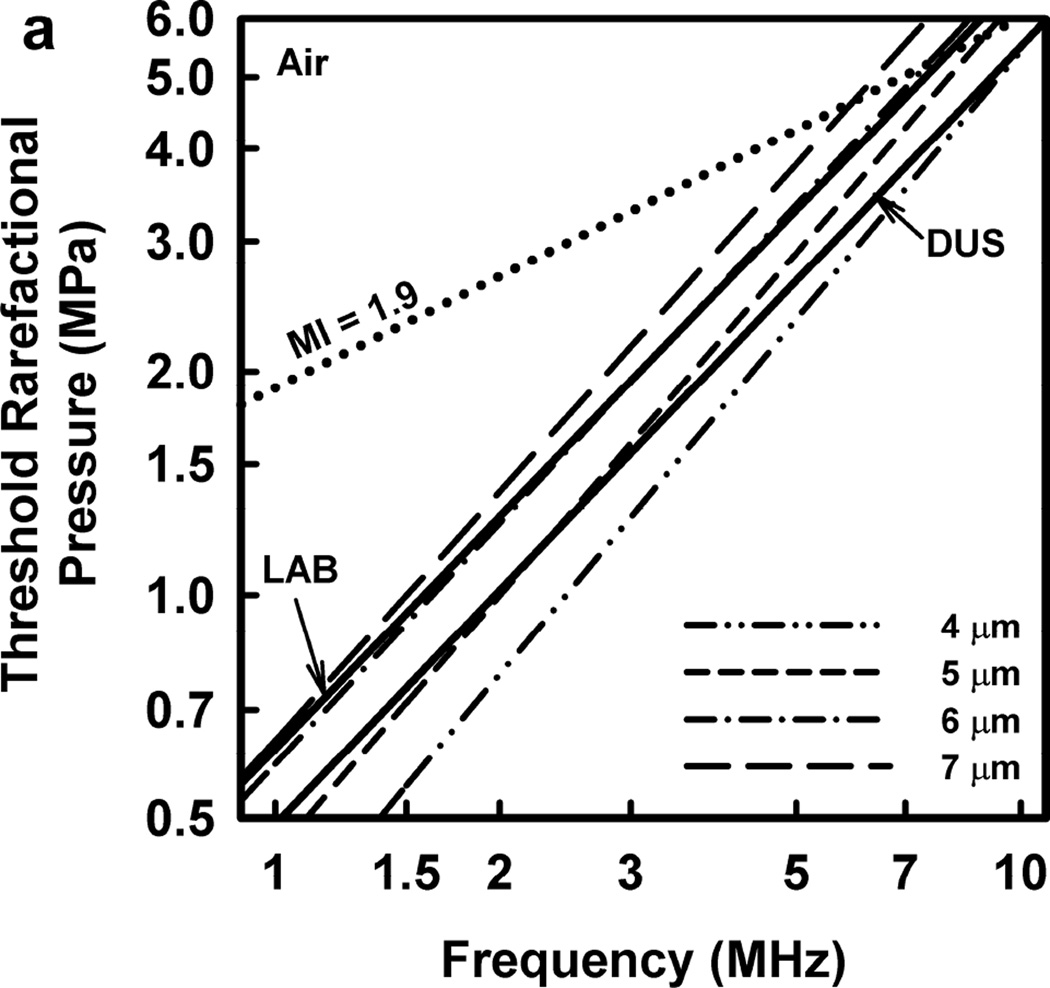
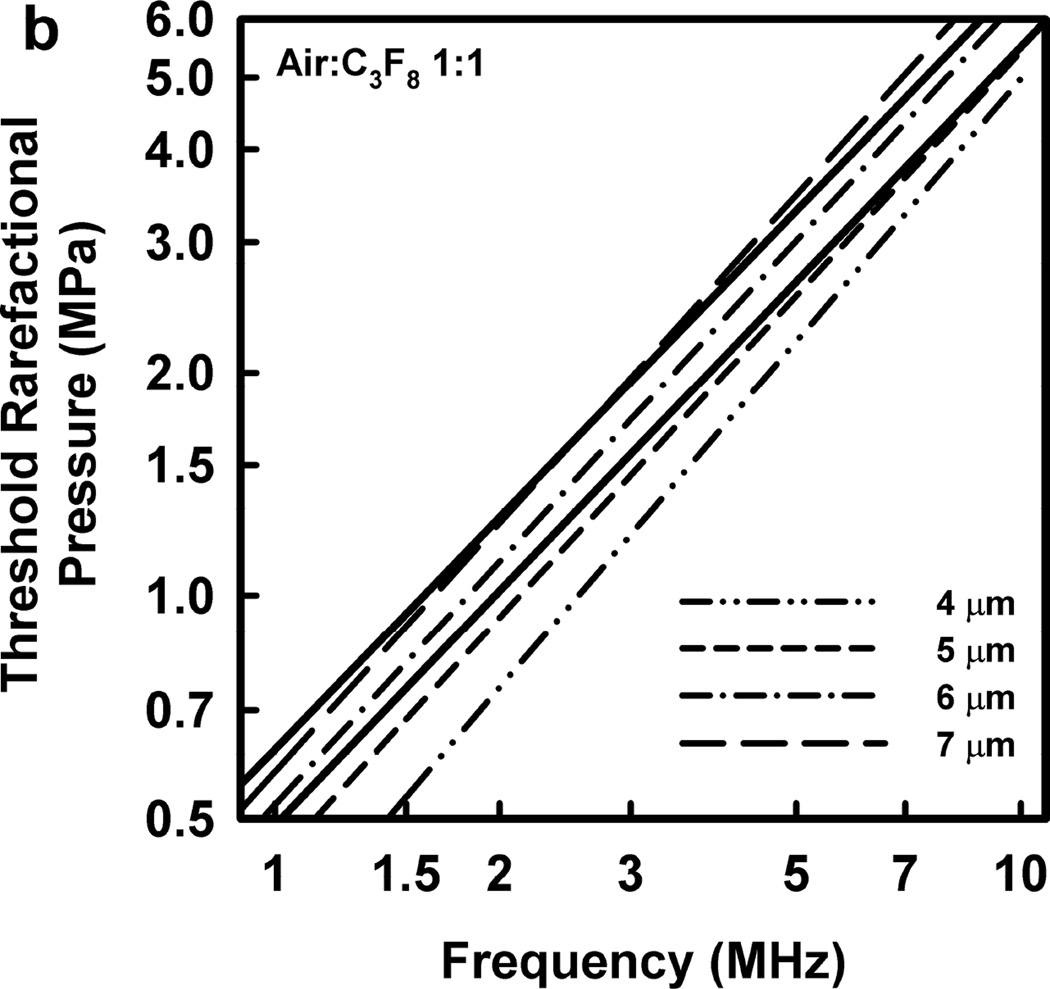
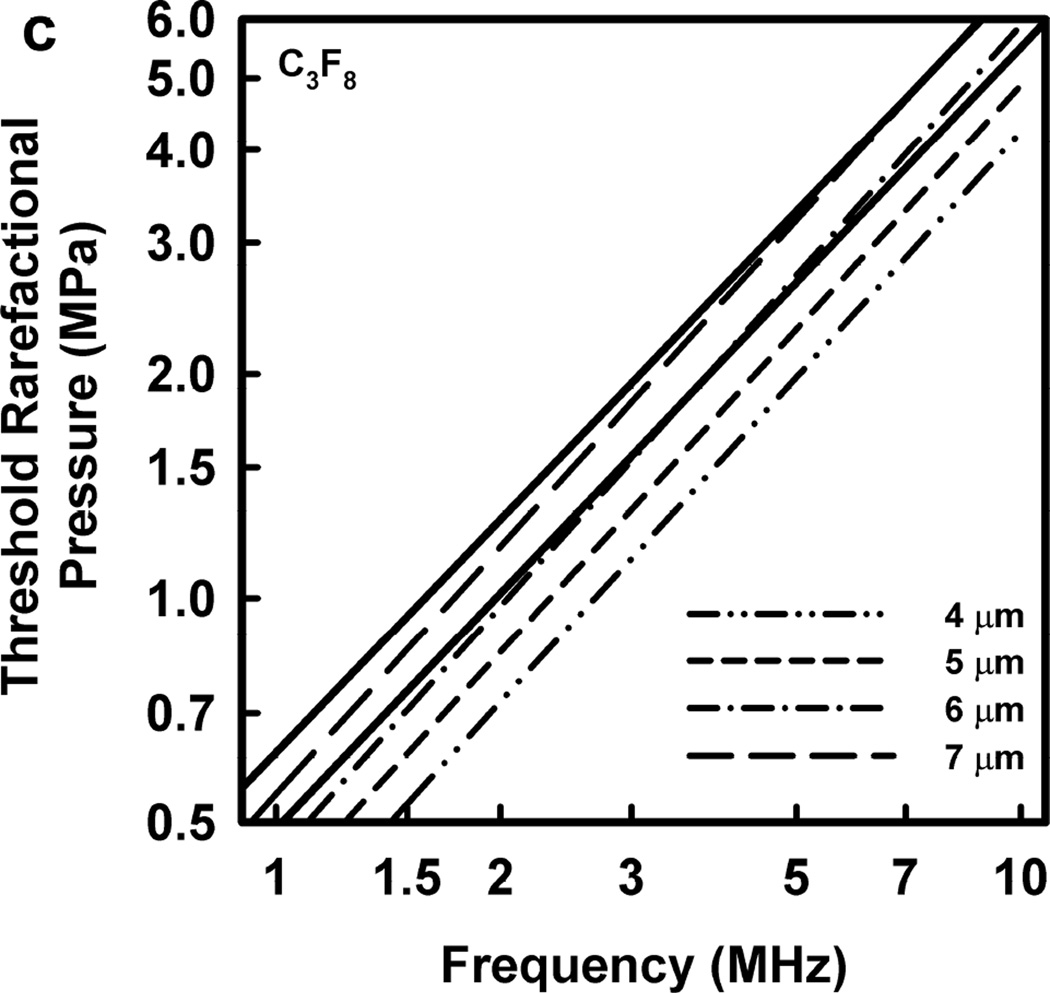
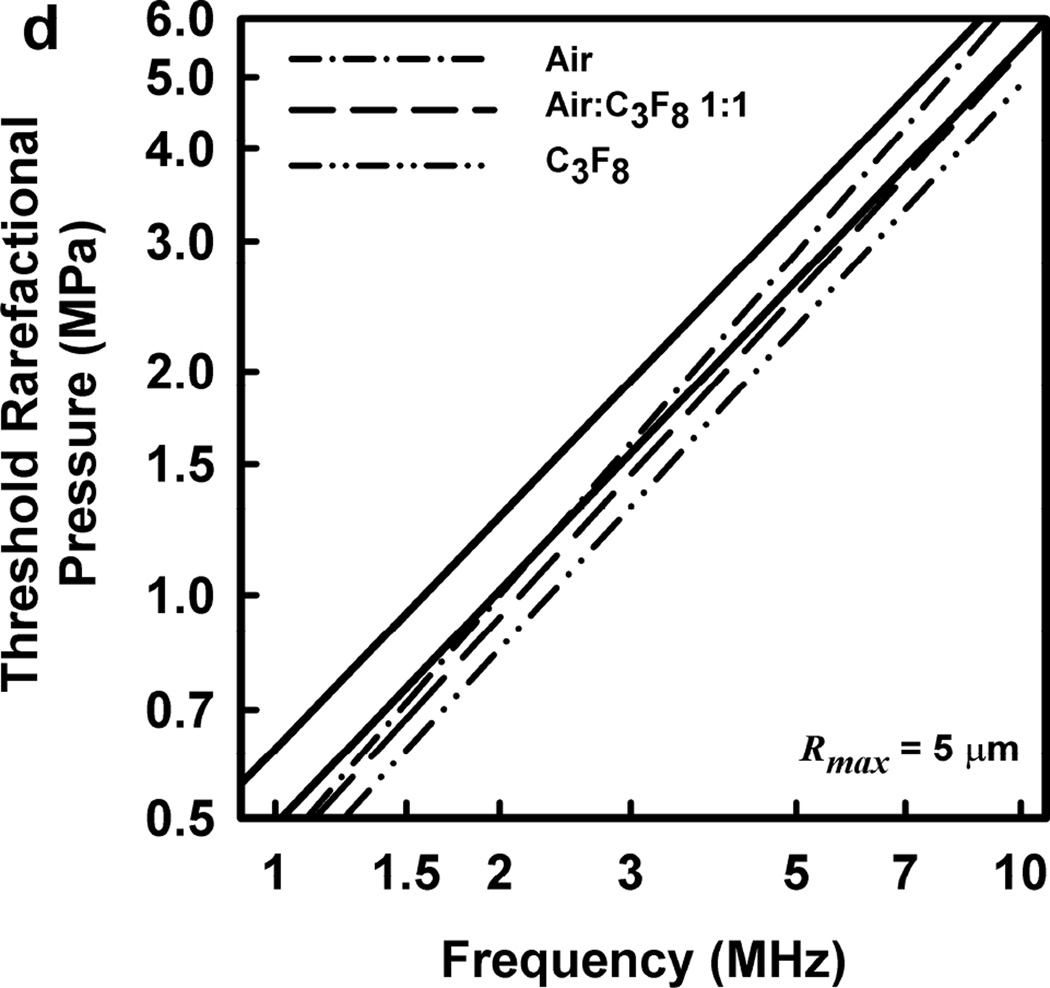
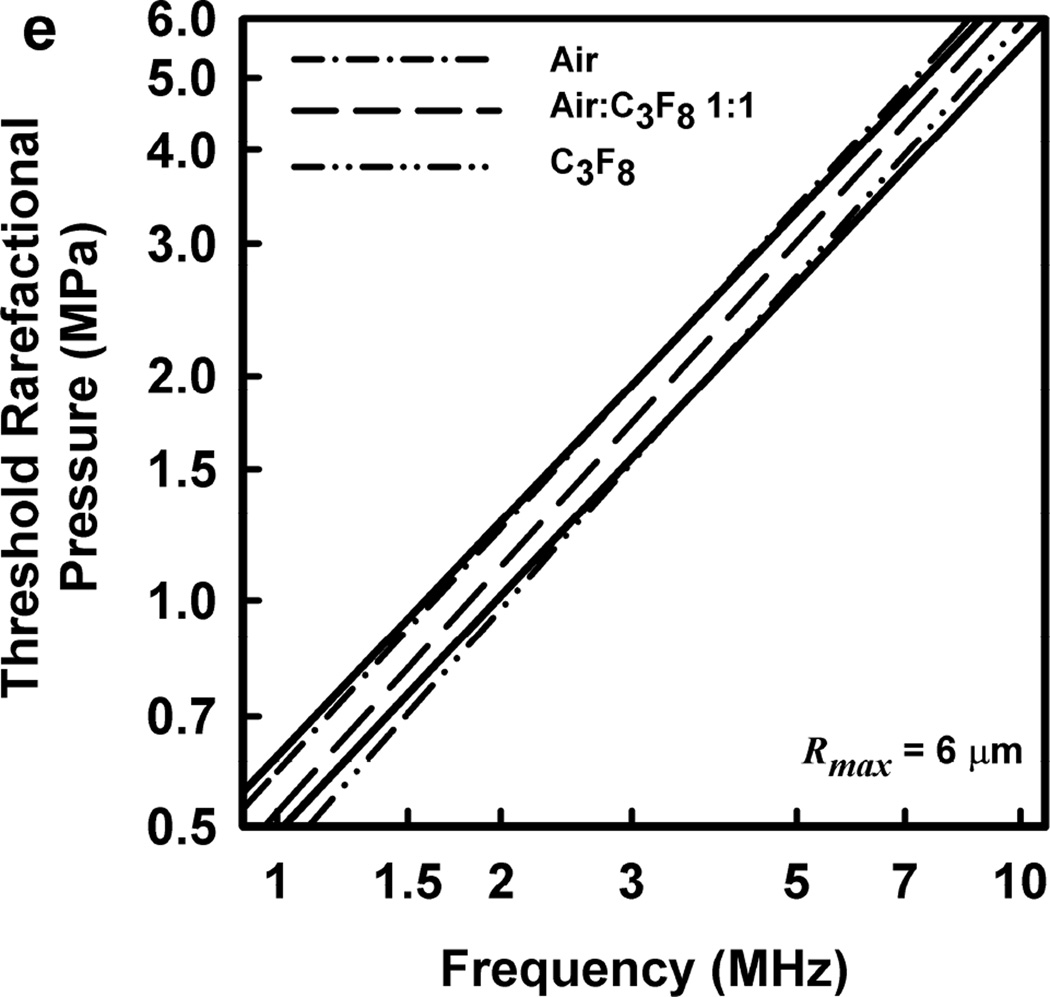
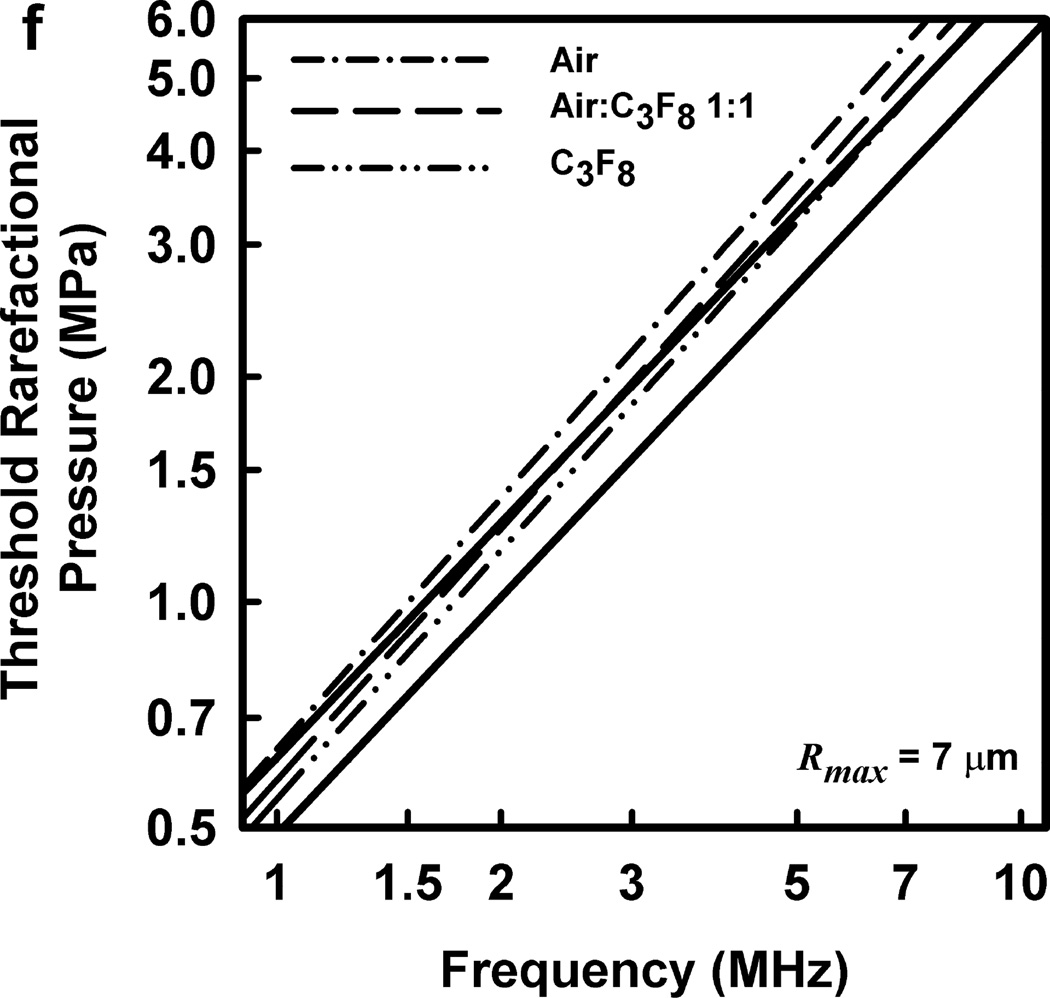
Thresholds calculated with this two-criterion model are shown in Fig. 6 for G = 2 kPa and µ = 5 mPa·s. Notice that the thresholds increase approximately linearly with frequency. This is consistent with the experimental results for GCH and petechial hemorrhage and at variance with both the current formulation for the MI and the results shown in Fig. 3. Some additional conclusions seem reasonable. First, the “best” value for Rmax is 6 or 7 µm, a value somewhat greater than the mean inner radius of a glomerular capillary in the rat, 3.9 – 4.4 µm (Nyengaard 1993; Ferrell et al 2015). These “best” results in our one dimensional theoretical analysis, might be accommodated by a distorted bubble shape, such as a prolate spheroid filling the capillary in a more complex model. Second, the thresholds for air bubbles always lie above those for microbubbles of pure C3F8; the thresholds for a 1:1 mixture of air and C3F8 lie between those for the pure gases. Third, the best fits to the data are for bubbles containing either air or 1:1 air:C3F8; whether air enters the bubbles before or after compromise of the encapsulating material is not known. Fourth, the slopes of the curves are less steep at lower frequencies, but they increase as the frequency increases. This is particularly apparent from the curves in the lower row of Fig. 6. Although the reason for this effect is not clear, it suggests that use of exposure frequencies above 7.5 MHz might provide another potential test of the 2-criterion model.
Figure 6.
The top row shows cavitation thresholds for bubbles containing air, air:C3F8 1:1, and C3F8, (a – c, respectively), for four values of Rmax (4, 5, 6, and 7 µm) and Umax = Co. The bottom row shows the same results but for the three gases and Rmax = 5, 6, and 7 µm (d – f, respectively). The filled symbols are for positive results for GCH or petechial hemorrhage with squares for the LAB system and diamonds to the DUS system. The dotted line labeled “MI = 1.9” in plot 6a represents the upper limit on the MI in the FDA’s guidance for DUS devices approved under its track 3. In all cases, G = 2 kPa and µ = 5 cP.
In order to “tame” the theoretical threshold data, thereby allowing comparisons among the theoretical and experimental results to made more consistently, the theoretical data were fit to a line of the form pt = bf a, as was done by Miller et al (2008b) for their experimental data. The lines determined in this way are given in Fig. 7 for the data shown in Fig. 6. The values for the fitting parameters are given in Table 1. The values of the square of the correlation coefficient (r2) given in the last column show that the theoretical fits are as good as those determined experimentally. The values of the coefficient (b) are similar to the experimental values, the latter falling within the 95% confidence intervals on the theoretical values in about half of the cases. In contrast to this, the theoretical values of the exponent (a) are consistently higher than the experimental values, although the latter fall within the 95% confidence intervals of the former for all cases except that of air bubbles with Rmax = 4 and 5 µm and air:C3F8 1:1 bubbles with Rmax = 4 µm. However, if the true distorted acoustic waveforms were used, it is expected that the values for the exponents would decrease somewhat. This is because the experimental thresholds at the higher frequencies are greater than those at lower frequencies, so the acoustic waveforms used in the experiments are progressively more distorted at increasing frequencies. Aymé and Carstensen (1989) demonstrated theoretically that waveforms distorted by the effects of nonlinear propagation induce stronger bubble responses than do sinusoidal waveforms having the same rarefactional pressure. Therefore, if similarly distorted waveforms had been used in the theoretical analysis conducted in this study, the bubble responses likely would have increased somewhat above the responses found using the undistorted waveforms. This means that the values for PRPA would have to decrease somewhat in order for the threshold criteria to be satisfied. The extent of the reduction would increase with increasing frequency because the effects of nonlinear propagation increase with frequency, so the exponents would decrease; the magnitudes of the decreases in the exponents remain to be determined.
Figure 7.
The best fits of the theoretical thresholds shown in Fig. 6 to the equation pt = bfa. The solid lines are the best fits to the experimental results of Miller et al (2008b), labeled in plot 7a. See the caption to Fig. 6 for additional details.
Table 1.
Parameters for best fits to theoretical thresholds; rigidity = 2 kPa, viscosity = 5 mPa·s.
| Coefficient b |
95% CI Lower |
95% CI Upper |
Exponent a |
95% CI Lower |
95% CI Upper |
DF-adj. r2 |
||
|---|---|---|---|---|---|---|---|---|
| (MPa) | (MPa) | (MPa) | ||||||
| DUS | 0.49 | 1.05 | 0.99* | |||||
| LAB | 0.62 | 1.04 | 0.98* | |||||
| Air | ||||||||
| Rmax = 4 µm | 0.34 | 0.31 | 0.37 | 1.20 | 1.16 | 1.25 | 1.00 | |
| Rmax = 5 µm | 0.45 | 0.38 | 0.52 | 1.16 | 1.08 | 1.24 | 0.99 | |
| Rmax = 6 µm | 0.59 | 0.50 | 0.68 | 1.08 | 1.00 | 1.16 | 0.99 | |
| Rmax = 7 µm | 0.64 | 0.54 | 0.73 | 1.11 | 1.04 | 1.19 | 0.99 | |
| Air:C3F8 1:1 | ||||||||
| Rmax = 4 µm | 0.33 | 0.29 | 0.37 | 1.18 | 1.11 | 1.24 | 0.99 | |
| Rmax = 5 µm | 0.44 | 0.36 | 0.51 | 1.09 | 1.01 | 1.18 | 0.99 | |
| Rmax = 6 µm | 0.52 | 0.45 | 0.60 | 1.09 | 1.02 | 1.16 | 0.99 | |
| Rmax = 7 µm | 0.58 | 0.48 | 0.68 | 1.11 | 1.03 | 1.20 | 0.99 | |
| C3F8 | ||||||||
| Rmax = 4 µm | 0.34 | 0.27 | 0.40 | 1.10 | 1.00 | 1.19 | 0.98 | |
| Rmax = 5 µm | 0.40 | 0.34 | 0.46 | 1.09 | 1.02 | 1.16 | 0.99 | |
| Rmax = 6 µm | 0.45 | 0.37 | 0.52 | 1.12 | 1.03 | 1.20 | 0.99 | |
| Rmax = 7 µm | 0.54 | 0.47 | 0.62 | 1.10 | 1.03 | 1.17 | 0.99 | |
CI = Confidence Interval; DF-adj. = adjusted for degrees of freedom;
Not adjusted for degrees of freedom.
The theoretical values of the equilibrium bubble radius, R0, at the frequencies used to obtain the experimental thresholds are shown in Table 2. Three aspects of the results are of interest here. First, the range in values for air bubbles is 0.76 – 2.34 µm. This range encompasses the bubble radii studied by Hosseinkhah and Hynynen (2012) and Hosseinkhah et al. (2013), providing support for their results as well as suggesting that it may prove profitable to extend their approach to include the rate of strain in the search for an understanding of the mechanism for capillary rupture. It is interesting to note that rate of strain is an important parameter in the failure of viscoplastic materials, e.g., Silly Putty®. The second point is that for a given value of the acoustic frequency, the value of R0 increases as the threshold criterion on Rmax increases. This is because the threshold curves for Rmax cross the curve for Umax in a region in which the latter curve is increasing, and since the curves for Rmax also rise as Rmax increases, the points of intersection move to the left. This is shown in Fig. 4.
Table 2.
Equilibrium bubble radii (µm) at threshold; rigidity = 2 kPa, viscosity = 5 mPa·s.
| 1.0 MHz |
1.5 MHz |
2.25 MHz |
2.5 MHz |
3.2 MHz |
3.5 MHz |
5.0 MHz |
7.4 MHz |
7.5 MHz |
|
|---|---|---|---|---|---|---|---|---|---|
| Air | |||||||||
| Rmax = 4 µm | 0.74 | 0.60 | 0.63 | 0.65 | 0.71 | 0.72 | 0.83 | 0.91 | 0.93 |
| Rmax = 5 µm | 0.76 | 0.81 | 0.83 | 0.87 | 0.93 | 1.00 | 1.12 | 1.15 | 1.15 |
| Rmax = 6 µm | 1.00 | 1.00 | 1.07 | 1.10 | 1.32 | 1.32 | 1.32 | 1.66 | 1.70 |
| Rmax = 7 µm | 1.20 | 1.20 | 1.32 | 1.26 | 1.48 | 1.48 | 1.48 | 2.29 | 2.34 |
| Air:C3F8 1:1 | |||||||||
| Rmax = 4 µm | 0.93 | 0.74 | 0.78 | 0.78 | 0.83 | 0.87 | 1.02 | 1.02 | 1.02 |
| Rmax = 5 µm | 0.96 | 1.02 | 1.02 | 1.05 | 1.17 | 1.26 | 1.23 | 1.55 | 1.58 |
| Rmax = 6 µm | 1.23 | 1.17 | 1.29 | 1.38 | 1.45 | 1.41 | 1.41 | 2.14 | 2.14 |
| Rmax = 7 µm | 1.48 | 1.41 | 1.45 | 1.66 | 1.62 | 1.62 | 2.04 | 2.88 | 3.02 |
| C3F8 | |||||||||
| Rmax = 4 µm | 1.48 | 0.93 | 0.98 | 0.98 | 1.02 | 1.10 | 1.15 | 1.48 | 1.29 |
| Rmax = 5 µm | 1.23 | 1.26 | 1.26 | 1.35 | 1.41 | 1.38 | 1.38 | 2.04 | 2.09 |
| Rmax = 6 µm | 1.62 | 1.51 | 1.74 | 1.70 | 1.62 | 1.62 | 2.09 | 2.88 | 2.95 |
| Rmax = 7 µm | 1.86 | 1.78 | 1.91 | 1.86 | 1.78 | 1.74 | 2.51 | 3.63 | 3.63 |
Significantly, for a given value of Rmax, the threshold value of R0 increases with increasing frequency. This is shown in Fig. 5 for Rmax = 6 µm. The result is not intuitive because the resonance radius decreases with increasing frequency, and it is usually observed both experimentally and theoretically that the maximum response for any parameter will occur at or near the size of the resonant bubble. Apparently this is not the case for capillary rupture. Further, the fraction of microbubbles of a given size in the suspension decreases as the bubble radius increases, meaning that there are progressively fewer glomeruli that could be ruptured at the threshold, perhaps making accurate determination of the threshold pressure more difficult at higher frequencies.
The most likely alternative pair of values for the rigidity and viscosity assumed in the results shown above are 0 kPa and 3 mPa·s, respectively. The first is equivalent to assuming that the walls of the capillaries in the glomerulus are so thin that their elasticity has no effect on the bubble motion, while the second is the value for the viscosity of blood at higher shear rates. Results obtained with these values are equivalent to those shown in Figs. 6 and 7 and Tables 1 and 2, but only the values for the parameters of the best-fitting lines are given here, see Table 3. In general, the thresholds are a little lower than those in Fig. 6, and overall the results for this set of tissue parameters fit the experimental data somewhat less well. This is quantified by the values of the fitting parameters shown in Table 3. The values of the coefficients (b) for the experimental values fall outside the 95% confidence intervals on the theoretical values in 3/4 of the cases, while the theoretical values of the exponent (a) remain consistently higher than the experimental values, their 95% confidence intervals encompassing the experimental values in only half of the cases shown in Table 3. Whether use of the distorted waveforms would improve these results remains to be seen.
Table 3.
Parameters for best fits to theoretical thresholds; rigidity = 0 kPa, viscosity = 3 mPa·s.
| Coefficient b |
95% CI Lower |
95% CI Upper |
Exponent a |
95% CI Lower |
95% CI Upper |
DF-adj. r2 |
|
|---|---|---|---|---|---|---|---|
| (MPa) | (MPa) | (MPa) | |||||
| DUS | 0.49 | 1.05 | 0.99* | ||||
| LAB | 0.62 | 1.04 | 0.98* | ||||
| Air | |||||||
| Rmax = 4 µm | 0.27 | 0.24 | 0.30 | 1.27 | 1.22 | 1.32 | 1.00 |
| Rmax = 5 µm | 0.39 | 0.32 | 0.45 | 1.19 | 1.11 | 1.27 | 0.99 |
| Rmax = 6 µm | 0.54 | 0.44 | 0.64 | 1.09 | 1.00 | 1.18 | 0.99 |
| Rmax = 7 µm | 0.57 | 0.46 | 0.68 | 1.14 | 1.05 | 1.23 | 0.99 |
| Air:C3F8 1:1 | |||||||
| Rmax = 4 µm | 0.27 | 0.23 | 0.32 | 1.22 | 1.14 | 1.30 | 0.99 |
| Rmax = 5 µm | 0.40 | 0.33 | 0.48 | 1.10 | 1.01 | 1.20 | 0.99 |
| Rmax = 6 µm | 0.47 | 0.41 | 0.54 | 1.10 | 1.03 | 1.17 | 0.99 |
| Rmax = 7 µm | 0.49 | 0.39 | 0.60 | 1.17 | 1.07 | 1.28 | 0.98 |
| C3F8 | |||||||
| Rmax = 4 µm | 0.29 | 0.23 | 0.35 | 1.11 | 1.00 | 1.22 | 0.99 |
| Rmax = 5 µm | 0.35 | 0.30 | 0.41 | 1.09 | 1.01 | 1.17 | 0.99 |
| Rmax = 6 µm | 0.33 | 0.25 | 0.41 | 1.23 | 1.11 | 1.35 | 0.98 |
| Rmax = 7 µm | 0.40 | 0.33 | 0.46 | 1.24 | 1.16 | 1.32 | 0.99 |
CI = Confidence Interval; DF-adj. = adjusted for degrees of freedom;
Not adjusted for degrees of freedom.
The good fits to the experimental data found for the theoretical thresholds when G = 2 kPa and µ = 5 mPa·s may also have a more practical application. As shown in Table 1, when the theoretical thresholds are fit to the equation pt = bfa, the values of the exponents determined empirically are within the 95% confidence intervals around the theoretical exponents in 18 of the 24 cases studied. The fact that the magnitudes of the theoretical thresholds are approximately equal to the experimental results combined with the finding that the theoretical slope (i.e., the exponent) is not significantly different from the empirical value suggests that this technique could be used to evaluate the safety of contrast-enhanced diagnostic ultrasound. The approach would seem to offer a more firmly supported method for assessing the safety of contrast examinations than is currently available with the mechanical index. However, while development of a contrast-specific safety metric based on these results would be straightforward, its implementation on clinical imaging machines may well prove challenging.
The threshold frequency response observed by Miller et al. (2008b) and modeled here is strikingly different from that of the MI and observed for disruption of the blood brain barrier (BBB). For example, McDannold et al (2008) observed BBB disruption for 0.26–2.04 MHz using relatively long pulses (≥10 ms), finding that the estimated values for in situ PRPA for 50% occurrence of disruption conformed to the functional dependence of the MI with MIE=0.46; NB - “MIE” is an abbreviation for effective mechanical index [see Nightingale et al. (2015)]. The disruption resulted in transient leakage of contrast agents in magnetic resonance imaging, but erythrocyte extravasation was also observed histologically (i.e. not unlike capillary rupture). This is a different exposure condition (10–100 ms) and endpoint (50% effect) than the diagnostic ultrasound considered here (1–3 µs and 1–2% effect, respectively), and it may represent a different mechanistic regime.
In their recent paper, Hosseinkhah et al. (2015) report that the maximum shear stress and transmural pressure calculated for a constant MI of 0.134 reach a peak at bubble sizes of 3, 4, and 7 µm for frequencies of 1.5, 1.0 and 0.55 MHz, respectively. These radii are larger than the linear resonance size at each frequency. Although this result is inconsistent with the theory underlying the MI (Apfel and Holland 1991), it appears to agree with the present work. While the parameter space investigated by Hosseinkhah et al. (2015) is limited by the complexity of the modeling involved, e.g., the pressure amplitudes are much lower than the thresholds reported by Miller et al. (2008b), the agreement between the two sets of theoretical results is reassuring.
Finally, a note of caution is in order regarding the criteria used to determine the threshold for inertial cavitation in this work. The actual mechanism(s) for glomerular capillary hemorrhage and surface petechiae may or may not be related solely to the collapse speed of individual microbubbles. High-speed imaging of contrast microbubbles cavitating within blood vessels of ex vivo rat mesentery exposed to a 2-cycle pulse of 1-MHz ultrasound indicates that the mechanisms involved in vessel rupture include vessel distention, vessel invagination and liquid jetting (Chen et al. 2010; 2011). While the changes in the radii of curvature (radial and axial) are rather small during bubble expansion, they can be much larger during the collapse phase. The small radius of curvature that obtains during the invagination of the vessel wall, shown in some detail in the photomicrographs and movies acquired by Chen et al. (2011), tends to maximize the stress and strain within the wall (Church and Yang 2006; Hosseinkhah et al. 2013), potentially leading directly to its failure. The role of liquid jetting is less clear. Jets are observed to be directed away from the nearest vessel wall, an unexpected result whose significance is not yet understood, although the shear stress exerted on the wall by the rapid fluid motion required to produce a jet must be substantial. In any case, perhaps the best justification for the 2-criterion model proposed here is that deep invagination of a vessel wall, liquid jetting, and attaining a collapse speed equal to the speed of sound in the material surrounding the bubble all involve very energetic processes.
Summary
Several lines of observational and theoretical evidence were combined and compared to the experimental measurements of thresholds for glomerular capillary hemorrhage (GCH) in rats infused with the contrast agent Definity™ reported by Miller et al. (2008b). Cavitation thresholds for inertial cavitation were computed for bubbles with radii in the range 0.1 – 10.0 µm and containing either air, C3F8, or a 1:1 mixture of the two, surrounded by either blood or kidney tissue. In no case did the thresholds for optimally sized bubbles [the method used for the mechanical index (MI)] agree with the frequency response for GCH determined experimentally. However, by requiring that a bubble satisfy two threshold criteria, one for inertial cavitation and a second for a fixed value for the maximum radius a bubble attains during its expansion, and then determining the threshold for optimally sized bubbles, good fits to the experimental data were obtained, with both theoretical and experimental thresholds increasing approximately linearly with frequency. This two-criterion model for bubble-induced bioeffects maximizes both the magnitude and the rate of circumferential stress in the capillary wall. The agreement between experiment and theory suggests that the development of a contrast-specific safety metric may be relatively straightforward.
Acknowledgments
This work was supported by US National Heart Lung and Blood Institute grant number R01HL110990. The information contained herein does not necessarily reflect the position or policy of the US government, and no official endorsement should be inferred.
Footnotes
Publisher's Disclaimer: This is a PDF file of an unedited manuscript that has been accepted for publication. As a service to our customers we are providing this early version of the manuscript. The manuscript will undergo copyediting, typesetting, and review of the resulting proof before it is published in its final citable form. Please note that during the production process errors may be discovered which could affect the content, and all legal disclaimers that apply to the journal pertain.
References
- AIUM/NEMA. Standard for Real Time Display of Thermal and Mechanical Acoustic Output Indices on Diagnostic Ultrasound Equipment, Revision 2. Laurel, MD: American Institute of Ultrasound in Medicine; 2004. American Institute for Ultrasound in Medicine/National Electrical Manufacturers Association. [Google Scholar]
- Amador C, Urban MW, Chen S, Greenleaf JF. Shearwave dispersion ultrasound vibrometry (SDUV) on swine kidney. IEEE Trans Ultrason Ferroelectr Freq Control. 2011;58:2608–2619. doi: 10.1109/TUFFC.2011.2124. [DOI] [PMC free article] [PubMed] [Google Scholar]
- Apfel RE, Holland CK. Gauging the likelihood of cavitation from short-pulse, low-duty cycle diagnostic ultrasound. Ultrasound Med Biol. 1991;17:179–185. doi: 10.1016/0301-5629(91)90125-g. [DOI] [PubMed] [Google Scholar]
- Arda K, Ciledag N, Aktas E, Aribas BK, Köse K. Quantitative assessment of normal soft-tissue elasticity using shear-wave ultrasound elastography. Am J Roentgenol. 2011;197:532–536. doi: 10.2214/AJR.10.5449. [DOI] [PubMed] [Google Scholar]
- Aymé EJ, Carstensen EL. Cavitation Induced by Asymmetric Distorted Pulses of Ultrasound: Theoretical Predictions. IEEE Trans Ultrason Ferroelect Freq Contr. 1989;31:32–40. doi: 10.1109/58.16966. [DOI] [PubMed] [Google Scholar]
- Chen H, Brayman AA, Bailey MR, Matula TJ. Blood vessel rupture by cavitation. Urol Res. 2010;38:321–326. doi: 10.1007/s00240-010-0302-5. [DOI] [PMC free article] [PubMed] [Google Scholar]
- Chen H, Brayman AA, Kreider W, Bailey MR, Matula TJ. Observations of translation and jetting of ultrasound-activated microbubbles in mesenteric microvessels. Ultrasound Med Biol. 2011a;37:2139–2148. doi: 10.1016/j.ultrasmedbio.2011.09.013. [DOI] [PMC free article] [PubMed] [Google Scholar]
- Chen H, Kreider W, Brayman AA, Bailey MR, Matula TJ. Blood vessel deformations on microsecond time scales by ultrasonic cavitation. Phys Rev Lett. 2011b;106:034301-1–034301-4. doi: 10.1103/PhysRevLett.106.034301. [DOI] [PMC free article] [PubMed] [Google Scholar]
- Chen S, Sanchez W, Callstrom MR, Gorman B, Lewis JT, Sanderson SO, Greenleaf JF, Xie H, Shi Y, Pashley M, Shamdasani V, Lachman M, Metz S. Assessment of liver viscoelasticity by using shear waves induced by ultrasound radiation force. Radiology. 2013;266:964–970. doi: 10.1148/radiol.12120837. [DOI] [PMC free article] [PubMed] [Google Scholar]
- Church CC, Labuda C, Nightingale K. A theoretical study of inertial cavitation from acoustic radiation force impulse (ARFI) imaging and implications for the mechanical index. Ultrasound in Medicine and Biology. 2015;41:472–485. doi: 10.1016/j.ultrasmedbio.2014.09.012. [DOI] [PMC free article] [PubMed] [Google Scholar]
- Church CC, Yang X. A theoretical study of gas bubble dynamics in tissue. In: Atchley AA, Sparrow VW, Keolian RM, editors. Innovations in Nonlinear Acoustics; 17th International Symposium on Nonlinear Acoustics; Melville, NY: American Institute of Physics. 2006. pp. 217–224. [Google Scholar]
- Deffieux T, Montaldo G, Tanter M, Fink M. IEEE Trans Med Imag. 2009;28:313–322. doi: 10.1109/TMI.2008.925077. [DOI] [PubMed] [Google Scholar]
- Derieppe ML, Delmas Y, Gennisson JL, Deminière C, Placier S, Tanter M, Combe C, Grenier N. Detection of intrarenal microstructural changes with supersonic shear wave elastography in rats. Eur Radiol. 2012;22:243–250. doi: 10.1007/s00330-011-2229-9. [DOI] [PubMed] [Google Scholar]
- Ferrell N, Sandoval RM, Bian A, Campos-Bilderback SB, Molitoris BA, Fissell WH. Shear stress is normalized in glomerular capillaries following 5/6 nephrectomy. Am J Physiol Renal Physiol. 2015;308:F588–F593. doi: 10.1152/ajprenal.00290.2014. [DOI] [PMC free article] [PubMed] [Google Scholar]
- Frizzell LA, Carstensen EL, Dyro JF. Shear properties of mammalian tissues at low megahertz frequencies. J Acoust Soc Amer. 1977;60:1409–1411. doi: 10.1121/1.381236. [DOI] [PubMed] [Google Scholar]
- Gennisson JL, Grenier N, Combe C, Tanter M. Supersonic shear wave elastography of in vivo pig kidney: influence of blood pressure, urinary pressure and tissue anisotropy. Ultrasound Med Biol. 2012;38:1559–1567. doi: 10.1016/j.ultrasmedbio.2012.04.013. [DOI] [PubMed] [Google Scholar]
- Goertz DE, de Jong N, van der Steen AFW. Attenuation and size distribution measurements of Definity™ and manipulated Definity™ populations. Ultrasound Med Biol. 2007;33:1376–1388. doi: 10.1016/j.ultrasmedbio.2007.03.009. [DOI] [PubMed] [Google Scholar]
- Grenier N, Gennisson JL, Cornelis F, Le Bras Y, Couzi L. Renal ultrasound elastography. Diagn Interv Imaging. 2013;94:545–550. doi: 10.1016/j.diii.2013.02.003. [DOI] [PubMed] [Google Scholar]
- Hogg JC. Neutrophil kinetics and lung injury. Physiol Rev. 1987;67:1249–1295. doi: 10.1152/physrev.1987.67.4.1249. [DOI] [PubMed] [Google Scholar]
- Hosseinkhah N, Hynynen K. A three-dimensional model of an ultrasound contrast agent gas bubble and its mechanical effects on microvessels. Phys Med Biol. 2012;57:785–808. doi: 10.1088/0031-9155/57/3/785. [DOI] [PMC free article] [PubMed] [Google Scholar]
- Hosseinkhah N, Chen H, Matula TJ, Burns PN, Hynynen K. Mechanisms of microbubble-vessel interactions and induced stresses: A numerical study. J Acoust Soc Amer. 2013;134:1875–1885. doi: 10.1121/1.4817843. [DOI] [PMC free article] [PubMed] [Google Scholar]
- Hosseinkhah N, Goertz DE, Hynynen K. Microbubbles and blood-brain barrier opening: a numerical study on acoustic emissions and wall stress predictions. IEEE Trans Biomed Eng. 2015;62:1293–1304. doi: 10.1109/TBME.2014.2385651. [DOI] [PMC free article] [PubMed] [Google Scholar]
- IEC. IEC Publication 60601-2-37, ed. 2.1. Geneva, Switzerland: International Electrotechnical Commission; 2015. Medical electrical equipment – Part 2: Particular requirements for the basic safety and essential performance of ultrasonic medical diagnostic and monitoring equipment. [Google Scholar]
- IEC. IEC Publication 62359, ed. 2.0. Geneva, Switzerland: International Electrotechnical Commission; 2010. Ultrasonics – Field Characterization – Test methods for the determination of thermal and mechanical indices related to medical diagnostic ultrasonic fields. [Google Scholar]
- Katiyar A, Sarkar K. Stability analysis of an encapsulated microbubble against gas diffusion. J Colloid Interfac Sci. 2010;343:42–47. doi: 10.1016/j.jcis.2009.11.030. [DOI] [PMC free article] [PubMed] [Google Scholar]
- Madsen EL, Sathoff HJ, Zagzebski JA. Ultrasonic shear properties of soft tissues and tissuelike materials. J Acoust Soc Amer. 1983;74:1346–1355. doi: 10.1121/1.390158. [DOI] [PubMed] [Google Scholar]
- Marmottant P, van der Meer S, Emmer M, Versluis M, de Jong N, Hilgenfeldt S, Lohse D. A model for large amplitude oscillations of coated bubbles accounting for buckling and rupture. J Acoust Soc Am. 2005;118:3499–3505. [Google Scholar]
- McDannold N, Vykhodtseva N, Hynynen K. Blood-brain barrier disruption induced by focused ultrasound and circulating preformed microbubbles appears to be characterized by the mechanical index. Ultrasound Med Biol. 2008;34:834–840. doi: 10.1016/j.ultrasmedbio.2007.10.016. [DOI] [PMC free article] [PubMed] [Google Scholar]
- Miao H, Gracewski SM, Dalecki D. Ultrasonic excitation of a bubble inside a deformable tube: implications for ultrasonically induced hemorrhage. J Acoust Soc Am. 2008;124:2374–2384. doi: 10.1121/1.2967488. [DOI] [PMC free article] [PubMed] [Google Scholar]
- Miller DL, Dou C, Wiggins RC. Simulation of diagnostic ultrasound image pulse sequences in cavitation bioeffects research. J Acoust Soc Am. 2007;122:2002–2008. doi: 10.1121/1.2773991. [DOI] [PubMed] [Google Scholar]
- Miller DL, Averkiou MA, Brayman AA, Everbach EC, Holland CK, Wible JH, Jr, Wu J. Bioeffects considerations for diagnostic ultrasound contrast agents. J Ultrasound Med. 2008a;27:611–632. doi: 10.7863/jum.2008.27.4.611. [DOI] [PubMed] [Google Scholar]
- Miller DL, Dou C, Wiggins RC. Frequency dependence of kidney injury induced by contrast-aided diagnostic ultrasound in rats. Ultrasound Med Biol. 2008b;34:1678–1687. doi: 10.1016/j.ultrasmedbio.2008.03.001. [DOI] [PMC free article] [PubMed] [Google Scholar]
- Moon SK, Kim SY, Cho JY, Kim SH. Quantification of kidney fibrosis using ultrasonic shear wave elastography: experimental study with a rabbit model. J Ultrasound Med. 2015;34:869–877. doi: 10.7863/ultra.34.5.869. [DOI] [PubMed] [Google Scholar]
- Nightingale KR, Church CC, Harris G, Wear KA, Bailey MR, Carson PL, Jang H, Sandstrom KL, Szabo TL, Ziskin MC. Conditionally increased acoustic pressures in non-fetal diagnostic ultrasound examinations without contrast agents: A preliminary assessment. J Ultrasound Med. 2015;34 doi: 10.7863/ultra.34.7.15.13.0001. Online 1–41. [DOI] [PMC free article] [PubMed] [Google Scholar]
- Nyengaard JR. Number and dimensions of rat glomerular capillaries in normal development and after nephrectomy. Kidney International. 1993;43:1049–1057. doi: 10.1038/ki.1993.147. [DOI] [PubMed] [Google Scholar]
- Patterson B, Miller DL, Johnsen E. Theoretical microbubble dynamics in a viscoelastic medium at capillary breaching thresholds. J Acoust Soc Amer. 2012;132:3770–3777. doi: 10.1121/1.4763993. [DOI] [PubMed] [Google Scholar]
- Qin S, Ferrara KW. Acoustic response of compliable microvessels containing ultrasound contrast agents. Phys Med Biol. 2006;51:5065–5088. doi: 10.1088/0031-9155/51/20/001. [DOI] [PMC free article] [PubMed] [Google Scholar]
- Sarkar K, Katiyar A, Jain P. Growth and dissolution of an encapsulated contrast microbubble: effects of encapsulation permeability. Ultrasound Med Biol. 2009;35:1385–1396. doi: 10.1016/j.ultrasmedbio.2009.04.010. [DOI] [PMC free article] [PubMed] [Google Scholar]
- Sboros V, MacDonald CA, Pye SD, Moran CM, Gomatam J, McDicken WN. The dependence of ultrasound contrast agents backscatter on acoustic pressure: theory versus experiment. Ultrasonics. 2002;40:579–583. doi: 10.1016/s0041-624x(02)00175-0. [DOI] [PubMed] [Google Scholar]
- van Liew HD, Burkard ME. Behavior of bubbles of slowly permeating gas used for ultrasonic imaging contrast. Invest Radiol. 1995;30:315–321. doi: 10.1097/00004424-199505000-00008. [DOI] [PubMed] [Google Scholar]
- Yang X, Church CC. A model for the dynamics of gas bubbles in soft tissue. J Acoust Soc Amer. 2005;118:3595–3606. doi: 10.1121/1.2118307. [DOI] [PubMed] [Google Scholar]
- Yang X, Church CC. A simple viscoelastic model for soft tissues in the frequency range 6–20 MHz. IEEE Trans Ultrason Ferroelect Freq Contr. 2006;53:1404–1411. doi: 10.1109/tuffc.2006.1665097. [DOI] [PubMed] [Google Scholar]
- Yaws CL. Matheson gas data book. New York: McGraw-Hill; 2001. [Google Scholar]
- Weibel ER. Morphometry of the human lung. New York: Academic Press; 1963. [Google Scholar]


