Abstract
Overly aggressive prostate cancer (PCa) treatment adversely affects patients and places an unnecessary burden on our health care system. The inability to identify and grade clinically significant PCa lesions is a factor contributing to excessively aggressive PCa treatment, such as radical prostatectomy, instead of more focal, prostate-sparing procedures such as cryotherapy and high-dose radiation therapy. We have performed 3-D in vivo B-mode and acoustic radiation force impulse (ARFI) imaging using a mechanically rotated, side-fire endorectal imaging array to identify regions suspicious for PCa in 29 patients being treated with radical prostatectomies for biopsy-confirmed PCa. Whole-mount histopathology analyses were performed to identify regions of clinically significant/insignificant PCa lesions, atrophy and benign prostatic hyperplasia. Regions of suspicion for PCa were reader-identified in ARFI images based on boundary delineation, contrast, texture and location. These regions of suspicion were compared with histopathology identified lesions using a nearest-neighbor regional localization approach. Of all clinically significant lesions identified on histopathology, 71.4% were also identified using ARFI imaging, including 79.3% of posterior and 33.3% of anterior lesions. Among the ARFI-identified lesions, 79.3% corresponded to clinically significant PCa lesions, with these lesions having higher indices of suspicion than clinically insignificant PCa. ARFI imaging had greater sensitivity for posterior versus anterior lesions because of greater displacement signal-to-noise ratio and finer spatial sampling. Atrophy and benign prostatic hyperplasia can cause appreciable prostate anatomy distortion and heterogeneity that confounds ARFI PCa lesion identification; however, in general, ARFI regions of suspicion did not coincide with these benign pathologies.
Keywords: Acoustic radiation force impulse imaging, Prostate, Cancer
INTRODUCTION
B-Mode ultrasound is the primary imaging tool used during prostate biopsy procedures, but it offers limited sensitivity and specificity for prostate cancer (PCa) lesion detection (Correas et al. 2013; Salomon et al. 2008), forcing urologists to rely on systematic biopsy sampling methods for diagnosing cancer and making treatment decisions. The multifocal nature of PCa means systematic sampling often samples only a subset of the clinically significant disease in the gland, making treatment decisions challenging for urologists (Cornud et al. 2012; Mufarrij et al. 2010). Image-guided, targeted biopsy has the potential to improve diagnostic confidence, allowing for more informed treatment decisions, facilitating more conservative focal therapies and ultimately resulting in better patient outcomes.
Magnetic resonance imaging (MRI) has been used to diagnose PCa since the early 1980s, but early studies on its diagnostic accuracy indicated significant variability (Gupta et al. 2013). The recent augmentation of MR sequences with functional parameters has yielded promising results (Gupta et al. 2013; Hricak et al. 2007; Raskolnikov et al. 2014; Rastinehad et al. 2014). Among the MRI sequences currently used in the study of PCa, it is well established that T2-weighted imaging (T2WI) offers the best assessment of prostate anatomy based on its ability to delineate prostate capsule margins, distinguish internal structures and differentiate among the glandular zones (peripheral zone and central gland), and the addition of apparent diffusion coefficient (ADC) maps aids in PCa identification (Gupta et al. 2013).
Although MRI is showing promise in diagnosing PCa and guiding treatment decisions, it is not a real-time imaging modality and is associated with considerable resource overhead, including time and expense, which has motivated the development of novel ultrasound imaging technologies to approach this problem. Hoyt et al. (2008) and Taylor et al. (2005) explored elasticity as a mechanism of delineating PCa using a sonoelastography crawling wave approach. Mahdavi et al. (2011) developed an ultrasonic vibro-elastography method that characterizes the viscoelastic properties of the prostate to delineate prostate anatomy, guide PCa diagnosis and delineate regions of PCa suspicion. Vibro-elastography is also being studied in combination with prostate MRI to improve prostate cancer detection (Ashab et al. 2015). Shear wave elastography (SWE) (Barr et al. 2012) and strain-based elastography (Knig et al. 2005; Pallwein et al. 2008) have also been found to have diagnostic value in identifying PCa lesions based on their mechanical properties.
Preliminary studies have indicated that acoustic radiation force impulse (ARFI) imaging, an ultrasonic, elasticity-based imaging modality, can delineate PCa and prostate anatomy with high fidelity (Palmeri et al. 2015; Zhai et al. 2010; 2012). ARFI imaging has short acquisition times, low cost and portability that could be used to guide targeted biopsies in outpatient clinical settings. Toward the goal of quantifying the diagnostic capabilities of ARFI imaging, we recruited 29 patients with biopsy-confirmed PCa who were undergoing radical prostatectomy, identified regions in in vivo ARFI images that were suspicious for cancer (regions of suspicion [ROS]) and compared these ARFI image findings with those for whole-mount histopathology. Given the challenges associated with reconstructing imaged prostate volumes from whole-mount histology slides, we used a nearest-neighbor regional match approach to localize lesions and ROS to evaluate the ability of ARFI to identify clinically significant PCa lesions. Finally, regions of atrophy and benign prostatic hyperplasia (BPH) were identified on histopathology and evaluated as potential confounders when identifying ROS in ARFI images.
METHODS
ARFI and B-mode image acquisition and image analysis
Experimental B-mode and ARFI prostate images were acquired in 29 patients with biopsy-confirmed PCa immediately before radical prostatectomy in an institutional review board-approved study after obtaining written informed consent. Imaging was performed using a modified Siemens Acuson SC2000 scanner (Siemens Medical Solutions, Ultrasound Division, Mountain View, CA, USA) with an Acuson ER7 B side-fire transrectal probe coupled to a mechanical rotation device (Fig. 1).
Fig. 1.
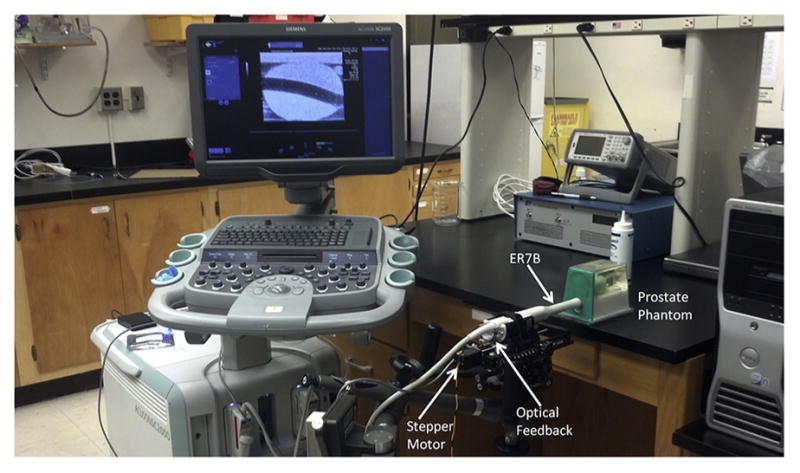
B-Mode/acoustic radiation force impulse imaging setup with the ER7 B ultrasound transducer integrated into a custom-rotating CIVCO transducer holder to obtain 3-D ultrasound data sets with the Siemens Acuson SC2000 scanner.
Images were acquired in the sagittal plane using a three-focal-zone acoustic radiation force excitation fired in rapid succession to create a virtual, extended acoustic radiation force excitation (Rosenzweig et al. 2015; Bercoff et al. 2004) to interrogate the entire prostate with adequate displacement amplitudes and a relatively uniform excitation beam width. Table 1 details the frequencies, focal configurations and excitation durations used at each focal depth. Eighty-two excitations, spaced 0.67 mm apart, were used for each imaging plane, achieving a 55-mm field of view for each imaging plane.
Table 1.
Acoustic radiation force focal configurations used to interrogate each imaging plane of the prostate*
| Focal depth (mm) | F/# | Frequency (MHz) | No. of cycles |
|---|---|---|---|
| 15.0 | 2.35 | 5.4 | 300 |
| 22.5 | 2.0 | 4.6 | 300 |
| 30.0 | 2.0 | 4.6 | 300 |
The frequencies and focal configurations were chosen to maintain a uniform beam width of ~0.67 mm throughout the extended region of excitation. Excitation beams were spaced 0.67 mm, with 82 excitations per imaging plane for a 55-mm imaging plane field of view.
Raw baseband (in-phase and quadrature [IQ]) data were acquired at an 8-kHz pulse repetition frequency for 5 ms using tracking beams focused at 60 mm at 5.0 MHz in an F/3 focal configuration with dynamic receive. Track beams were acquired using 4:1 parallel receive with 0.17-mm track beam spacing (Dahl et al. 2007), and data were saved for offline displacement estimation.
The ARFI tracking beams were optimized for displacement estimation over the extended focal zone ARF excitation, and the reconstructed B-mode images from these data did not achieve the highest spatial resolution possible with the ER7 B transducer. High-resolution B-mode images were acquired in a subsequent data acquisition using 126 transmits spanning a 55-mm field of view with 7:1 parallel receive, coherent beamforming. These B-mode sequences used a 7.0-MHz transmit frequency with an F/3 focal configuration at a fixed focal depth dependent on the size of the prostate, which ranged from 10 to 60 mm across the patients in this study. An F/1, dynamic receive focal configuration was used for receive beamforming.
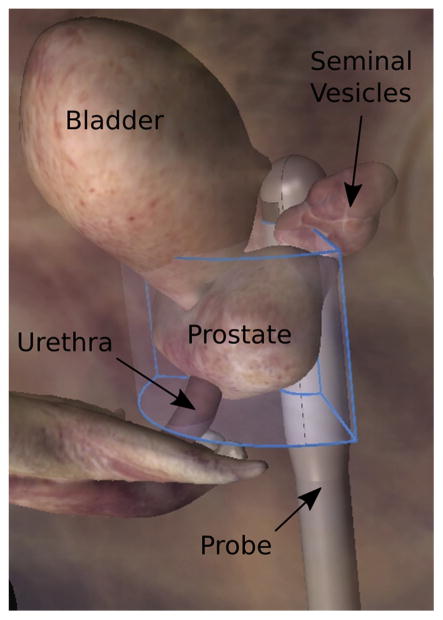
Three-dimensional prostate volumes were populated by mechanically rotating the ER7 B probe in ~1° elevation increments between image acquisitions, sweeping an arc across the lateral extent of the prostate (Fig. 2). This rotation setup used a CIVCO Micro-Touch stabilizer (CIVCO Medical Solutions, Kalona, IA USA) with 6-axis degrees of freedom for manual positioning of the transducer to sweep through the entire prostate during imaging. A custom optical angular feedback transduction circuit using a reflective linear strip with 212-line-per-inch resolution (US Digital, Vancouver, WA, USA) was coupled to the transducer-holding cradle (Fig. 1) and communicated with a QSB-S Quadrature-to-USB adapter to achieve 9-line/degree resolution. Rotation was performed with a 141-oz-in torque stepper motor with a planetary gearbox (Model 11 YPG202 S-LW4-R27, Anaheim Automation, Anaheim, CA, USA) to achieve accurate spatial localization of the imaging frames in the 3-D data set.
Fig. 2.
Orientation of the swept imaging volume (blue outline) relative to the prostate and adjacent anatomy. B-Mode and acoustic radiation force impulse images were acquired in separate sweeps of this volume in ~1° increments.
Acoustic radiation force impulse image displacements were estimated using Loupas’ algorithm (Loupas et al. 1995), applying a correlation coefficient threshold of 0.95 to discard estimates corrupted by motion and noise. Displacement data from each focal depth were normalized to account for depth-dependent variations in ARFI amplitude (Palmeri et al. 2015). The imaging planes of displacement data were scan converted to an isotropic voxel size of 0.15 × 0.15 × 0.15 mm3 for image analysis in 3-D Slicer (Fedorov et al. 2012; Palmeri et al. 2015). Prostate anatomic features, including the prostate capsule and central gland, were identified, segmented, modeled and used for anatomic guidance during ROS identification (Palmeri et al. 2015). ROS were identified blinded to histopathology and assigned an index of suspicion (IOS) score based on a 3-point scale (Table 2). Axial, coronal and sagittal imaging planes were all used to assign IOS scores. ROS were segmented and modeled in 3-D Slicer.
Table 2.
Description of IOS scores for ARFI imaging ROS*
| IOS score | ARFI imaging ROS characteristics
|
|||
|---|---|---|---|---|
| Boundary | Contrast | Texture | Location | |
| 1 | Variable | Low | Variable | Peripheral zone or central gland |
| 2 | Variable | Medium | Smooth | Peripheral zone |
| 3 | Well defined | High | Smooth | Peripheral zone |
ARFI = acoustic radiation force impulse; IOS = index of suspicion; ROS = regions of suspicion.
Note that the healthy central gland exhibits heterogeneity in ARFI images that can confound the ability to identify ROS and, therefore, reduces this IOS in this scoring scheme.
Histopathology analysis
All ARFI-imaged prostates were radically excised and whole mounted for histologic evaluation with hematoxylin and eosin (H&E) stain. Two trained pathologists identified the outer capsule, verumontanum and Gleason grade of PCa lesions, along with benign processes, including BPH and atrophy.
Histopathology slides were digitized using an Epson 750 Pro scanner (Epson America, Long Beach, CA, USA) at 600-dpi resolution and converted to Neuroimaging Informatics Technology Initiative (NIfTI) image stacks using ImageJ (Schneider et al. 2012). Volume estimates were computed for all histology-identified PCa lesions in five steps:
Approximate overall prostate volume as an ellipsoid using pathology triaxial measurements from just after prostate excision (Palmeri et al. 2015).
Segment PCa lesion and prostate capsule outline on all slides in 3-D Slicer.
Sum the total area of PCa lesion segmentations across all histology slides.
Divide the total area of PCa lesion by the total area of prostate capsule summed across slides to compute a total lesion area fraction.
Multiply total lesion area fraction by approximated ellipsoid prostate volume to obtain approximated PCa lesion volume.
ARFI imaging and histopathology correlation
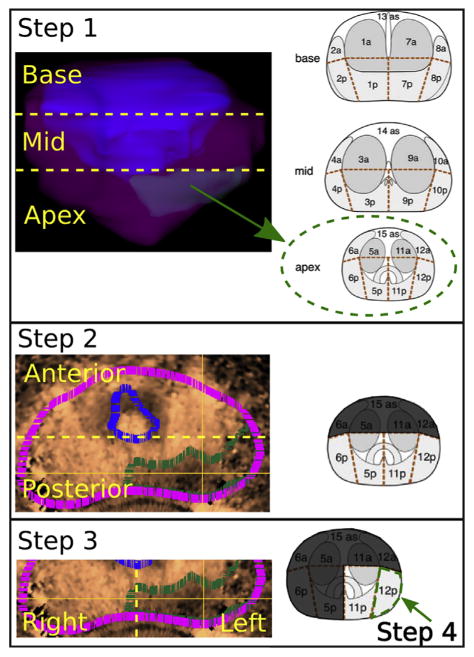
The slice thickness and orientation of whole-mount histology slides were approximated during the slide registration process, making voxel-to-voxel comparisons between histology and imaging volumes challenging. For this reason, we chose to correlate ARFI image ROS to delineated histology lesions using a 27-region model of the prostate, where each region is defined by anatomic location in the prostate (Dickinson et al. 2011). This regional localization procedure involved three steps:
Visual localization of ARFI image and histopathology models to a 27-region, standardized grid (Fig. 3) (Dickinson et al. 2011).
Approximation of the ARFI image ROS and histopathology lesion centers.
Evaluation of the matches between the centers of ARFI image ROS and histopathology lesions on the 27-region grid.
Fig. 3.
Procedure for localizing acoustic radiation force impulse image ROS. Step 1: Localize the ROS (green subvolume in model) to the prostate base, mid- or apex region. Step 2: Localize the ROS (green outline, IOS = 3) to the prostate anterior or posterior region. The magenta outline represents the prostate capsule, and the blue outline represents the central gland outline. Step 3: Localize the ROS to the right or left. Step 4: Determine the single region that corresponds best to the bulk of the ROS burden. Photographs of segmented prostate reproduced, with permission, from Dickinson et al. (2011). ROS = regions of suspicion.
Acoustic radiation force impulse image models (prostate capsule, central gland, ROS) and histopathology slides were visually registered to a standardized 27-region grid using anatomic features as fiducials (Dickinson et al. 2011). The centers of the ARFI image ROS and histopathology lesions were then found by iteratively reducing the space of possible center locations on the 27-region grid to one center region in four steps (Fig. 3):
Localize the ROS to the prostate base, mid- or apex region, reducing the number of possible regions from 27 to 9.
Localize the ROS to the anterior or posterior region of the prostate, reducing the number of possible regions to 5 or 4, respectively.
Localize the ROS to the prostate right or left side.
Determine the location of the bulk of the tumor burden to reduce the ROS to a single region.
Acoustic radiation force impulse imaging-identified ROS that were either located either in the same region or in the nearest-neighbor region as the histopathology PCa lesion center were scored as successfully identifying the histopathology lesion. ARFI ROS were also correlated with the presence of atrophy and BPH. Atrophy and BPH lesions were identified in all regions where present in the histopathology slides (not just a single center region as was done with the PCa) because these processes can be more diffuse, and ARFI ROS were deemed coincident with atrophy or BPH if the ROS intersected with any of the regions for these benign lesion types and did not match a PCa region in histology.
Histopathology lesion stratification and calculations
Histopathology lesions were stratified into clinical significance categories (Table 3) (Mazzucchelli et al. 2009). Along with lesion size, Gleason score was used as a primary determinant of PCa clinical significance. The Gleason grading system is based on the histologic examination of hematoxylin and eosin-stained prostatic tissue sections “at relatively low magnification (×10–40), [with score determined] by the extent of glandular differentiation and the pattern of growth of the tumor in the prostatic stroma,” which were illustrated as nine different patterns of growth that were striated into five different grades (Gleason 1990). The primary pattern occupies the greatest proportion of the tumor area, and the secondary pattern occupies the second-greatest proportion of the tumor area on the slide. The grades corresponding to the primary and secondary patterns are added together to produce an overall score that can range from 1 + 1 = 2 to 5 + 5 = 10. If only a single pattern is present, then the associated grade is simply repeated to give the overall score. In practice, most tumors have Gleason scores between 3 + 3 = 6 and 5 + 4 = 9, with rare cases having lower and higher overall scores. This grading system is unusual in the grading of human malignancies; for most tumors, the worst grade present in a sample determines patient outcome. With prostatic adenocarcinoma, however, cancer-related death rates mimic the grading system, such that a patient with a score of 3 + 4 = 7 has a better prognosis than a patient with a score of 4 + 4 = 8, even though tumor of grade 4 histology is present in both of these patients (Gleason 1977; 1990; 1992).
Table 3.
Clinical significance categories for histopathology identified prostate cancer*
| Clinically significant disease (CSD) | Lesion volume ≥0.5 mL AND/OR Gleason score >6 |
| Clinically insignificant disease (CINSD) | Lesion volume <0.5 mL AND Gleason score ≤6 |
Lesions were also characterized by anterior or posterior location in the prostate.
Acoustic radiation force impulse imaging PCa detection rates and positive predictive values (PPVs) were calculated for all PCa lesions in this study.
RESULTS
Of all clinically significant lesions, 71.4% were detected with ARFI imaging (Fig. 4); 82.9% of these clinically-significant lesions were in the posterior prostate, and 17.1% were in the anterior prostate. ARFI imaging was able to detect 79.3% of all posterior and 33.3% of all anterior clinically significant lesions.
Fig. 4.
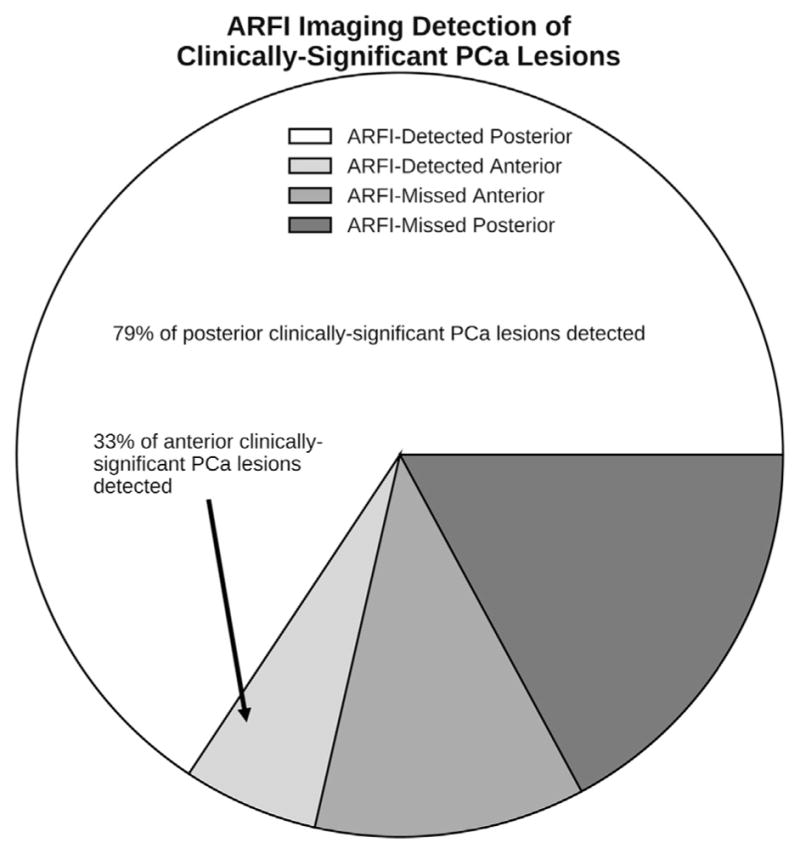
Pathologists localized all of the clinically significant PCa lesions using the criteria in Table 3 on whole-mount histology slides. ARFI imaging was able to detect 79.3% of posterior and 33.3% of anterior clinically significant lesions using the nearest-neighbor region match. Note that the majority (82.9%) of the clinically significant lesions were located in the posterior region. PCa =prostate cancer; ARFI =acoustic radiation force impulse.
Among ARFI-identified ROS, 79.3% were clinically significant PCa, with the majority having IOS scores ≥2 (Fig. 5). Of the remaining ARFI-identified ROS, one was atrophy and the others (IOS ≤2) corresponded to PCa lesions that were not clinically significant. No ARFI ROS were associated with BPH.
Fig. 5.
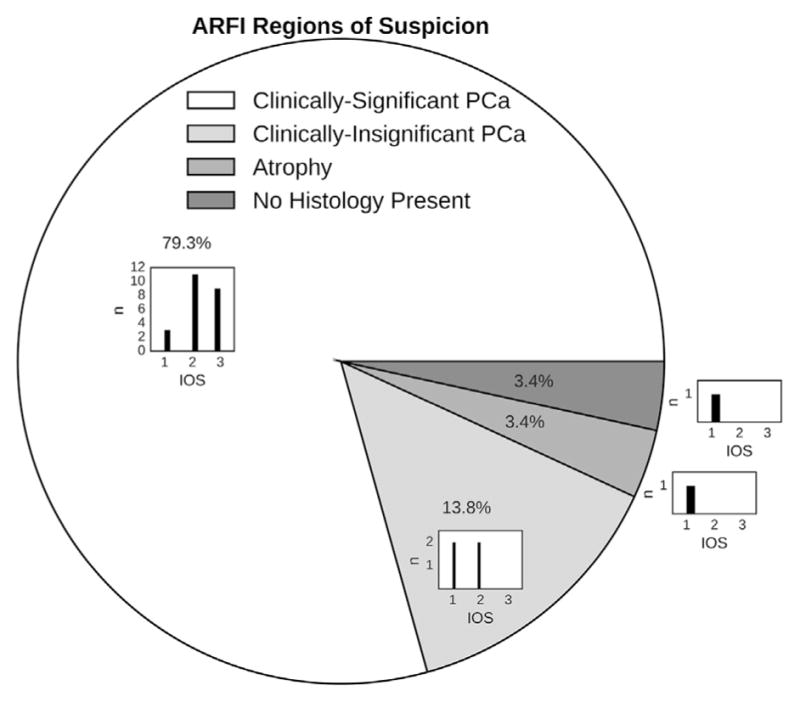
Lesions on whole-mount histology were classified as clinically significant/insignificant PCa, benign prostatic hyperplasia or atrophy. ROS identified in ARFI images were assigned IOS scores (Table 3) and nearest-neighbor-matched to histology lesions. Among the ARFI-identified lesions, 79.3% were clinically significant, with the majority having IOS scores ≥2 (subhistogram). The clinically insignificant PCa lesions that were identified overall had lower IOS scores (subhistogram), and one ARFI ROS (IOS = 1) corresponded to a region of atrophy. No ARFI ROS corresponded to benign prostatic hyperplasia, and one ARFI ROS did not correspond to any histology-identified lesions. PCa = prostate cancer; ROS = regions of suspicion; ARFI = acoustic radiation force impulse; index of suspicion.
Higher-assigned ARFI imaging IOS scores for lesions revealed higher PPVs for both CSD and CINSD (Table 4).
Table 4.
Positive predictive values and IOS scores for CSD as well as for the presence of any cancer (CSD or CINSD)
| IOS score | Positive predictive value
|
|
|---|---|---|
| CSD | CSD or CINSD | |
| 3 | 100% | 100% |
| 2 | 85 % | 100% |
| 1 | 43 % | 71% |
CSD = clinically significant disease; CINSD = clinically insignificant disease; IOS = index of suspicion.
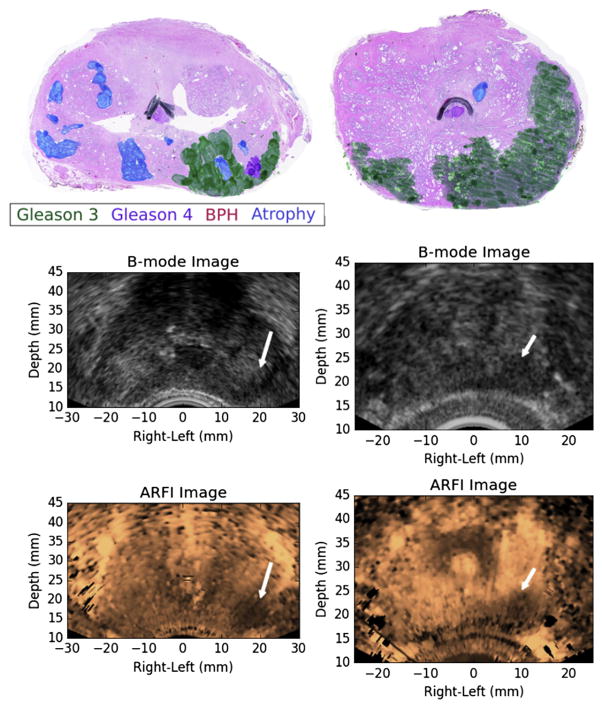
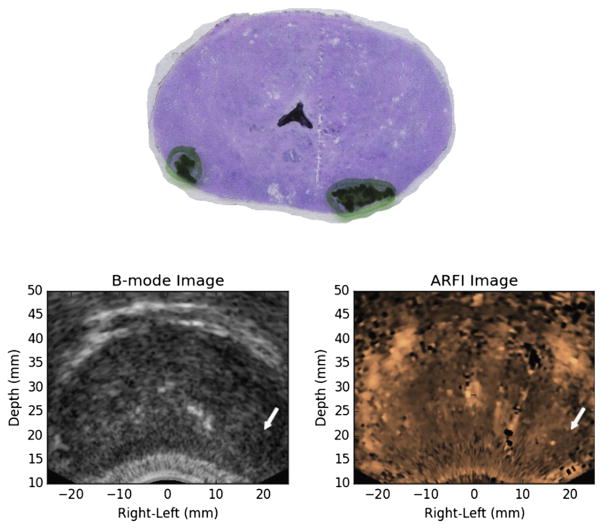
In Figure 6 are two examples of PCa lesions that were identified as highly suspicious (IOS = 3) on ARFI imaging and corresponded to large, clinically significant, posterior PCa lesions, whereas in Figure 7 is an example of a less highly suspicious lesion (IOS = 1) that corresponded to a clinically insignificant PCa lesion.
Fig. 6.
Examples of ARFI imaging-identified, index of suspicion = 3 regions of suspicion from two different study patients (left and right columns) that corresponded to large, posterior prostate cancer index lesions. The ARFI images have been histogram-normalized, and the regions of suspicion were identified as large regions of decreased displacement with contralateral contrast. BPH = benign prostatic hyperplasia; ARFI = acoustic radiation force impulse.
Fig. 7.
Example of an acoustic radiation force impulse imaging-identified region of suspicion (index of suspicion = 1) that corresponded to a small, clinically insignificant, posterior prostate cancer lesion. This region of suspicion was identified based on a small, localized region of decreased displacement. A second, smaller, clinically insignificant, posterior prostate cancer lesion on the opposite side was not detected as a region of suspicion in the acoustic radiation force impulse images.
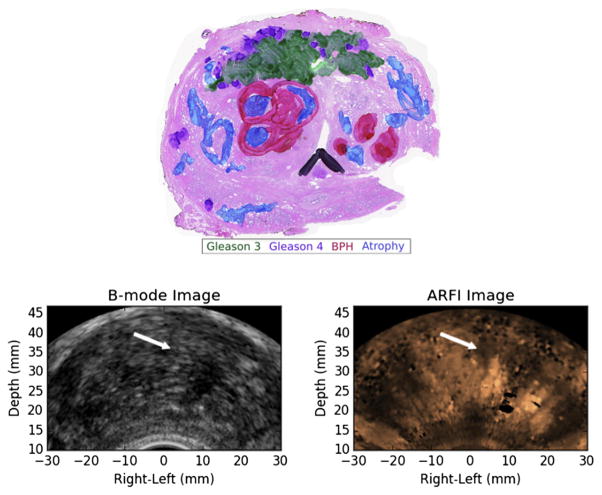
Figure 8 contains an example of an anterior, clinically significant PCa lesion that was not identified as an ROS on ARFI imaging, although in retrospect, this lesion is clearly visible.
Fig. 8.
Example of a prostate cancer index lesion (green and purple) in the anterior stroma that was missed in ARFI imaging (no suspicious regions identified). A representative ARFI image (right) from the midgland reveals a bright central structure corresponding to the BPH/atrophy adjacent to the midline on the patient’s right, but the anterior stroma of the prostate could not be reliably evaluated because of stiffness heterogeneity introduced by the BPH and atrophy. There is also shadowing and a region of decorrelation on the patient’s left resulting from a posterior calcification in the prostate (hypo-echoic regions in the B-mode image) that can also complicate interpretation of the ARFI image. ARFI = acoustic radiation force impulse; BPH = benign prostatic hyperplasia.
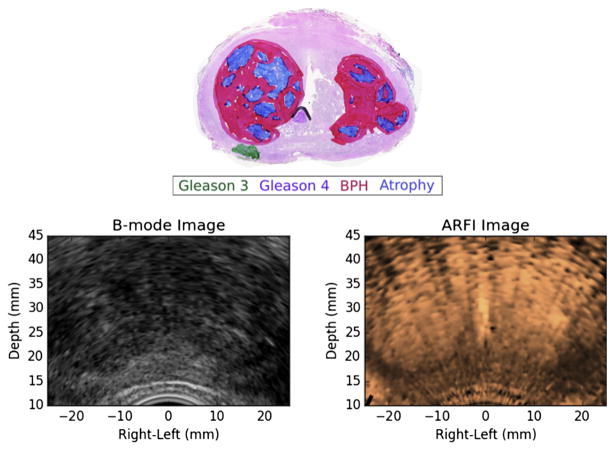
In Figure 9 is a small, but clinically significant PCa lesion in the right posterior region of the prostate that was not visible on ARFI imaging, likely because of the dominant appearance of atrophy and BPH in the enlarged central gland that compressed the peripheral zone.
Fig. 9.
Example of a small, but clinically significant prostate cancer lesion in the patient’s right posterior region of the prostate that was missed in histogram-normalized ARFI imaging because of the dominant appearance of atrophy and BPH in the enlarged central gland. These large BPH nodules heavily distort the typical prostate anatomy and can confound identification of prostate cancer lesions in ARFI images. ARFI image. ARFI = acoustic radiation force impulse; BPH = benign prostatic hyperplasia.
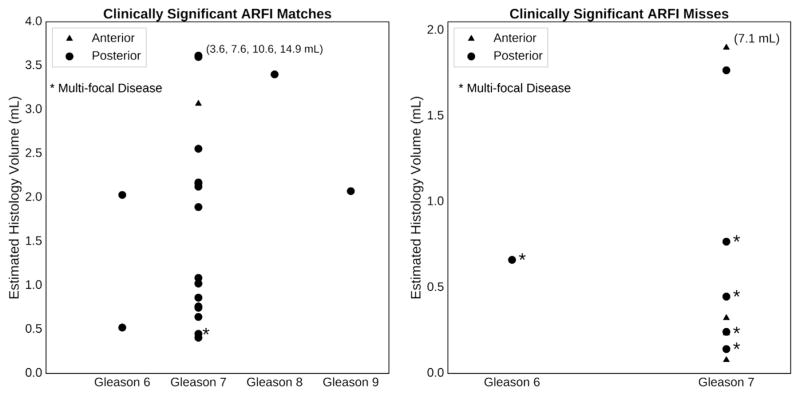
Figure 10 illustrates the characteristics of the clinically significant lesions that were detected and missed in ARFI images as a function of estimated histologic lesion volume, anterior/posterior location and Gleason grade.
Fig. 10.
Characteristics of the clinically significant lesions that ARFI imaging detected and missed as a function of estimated histologic lesion volume and Gleason grade, color-coded by location in the anterior (blue) or posterior (red) region of the prostate. “Multifocal disease” is defined as a prostate having four or more cancerous foci. Note that ARFI did not miss any of the highest Gleason grade lesions (Gleason 8 and 9), and the majority of the missed clinically significant lesions had volumes <1.0 mL or were located in the anterior (blue). The numbers on the plots associated with some of the high-volume lesions indicate the absolute volumes of the lesions that fall off the scale of each plot. ARFI = acoustic radiation force impulse.
DISCUSSION
Acoustic radiation force impulse images read with the suspicion criteria outlined in Table 2 were very specific for clinically significant PCa, especially in the posterior region, with 79.3% of posterior clinically significant lesions (Fig. 4) detected. One hundred percent of IOS 2 and 3 ARFI ROS corresponded to PCa lesions (Table 4), and 100% of ARFI IOS 3 lesions were clinically significant PCa lesions (Fig. 5, Table 4). The specificity of ARFI imaging is consistent with that of multiparametric MRI, combining T2-weighted and diffusion-weighted imaging (DWI) (Gupta et al. 2013), and greater than that of B-mode imaging alone (Eggert et al. 2008). The high specificity of ARFI imaging could have clinical utility in distinguishing aggressive PCa lesions that require treatment from indolent disease that does not need treatment and could be monitored.
Lesion size was a major determinant for visualization in ARFI imaging. No clinically significant lesions with histology volumes <0.4 mL (n = 5) were identified in ARFI, all corresponding to Gleason score 7 (Fig. 10). Small Gleason 7 lesions and larger Gleason 6 tumors exhibit a similar likelihood of organ-confined disease, and the presence of small Gleason 7 tumors should not necessarily be considered an adverse finding (Yang et al. 1999). Thus, the shortcoming of ARFI imaging in identifying small tumors could be useful for diagnostic purposes, as it may actually prevent overly aggressive PCa treatment of small cancerous foci.
It should be noted that ARFI image lesion size does not match the size outlined in the histology slides (Fig. 6). The regions delineated with marker on the histology slides correspond to cellular patterns of dysplasia that are used to designate different Gleason grades, including changes in nuclear morphology and other signs of cellular atypia. These specific changes are not what we hypothesize generates contrast in ARFI images; instead, we hypothesize that ARFI images have contrast related to PCa because of increases in cellular density and intercellular connectivity that change the more macrocellular mechanical properties. We expect these changes to be greatest at the “center” of evolving PCa lesions, and therefore, we do not expect 1:1 correspondence between the outer areas outlined in histology and the outer extents of regions of decreased displacement in the ARFI images. This was a motivating factor for analyzing the match of regions where the lesions are centered, which is also the most clinically useful feature when trying to guide a biopsy needle to pass through the most suspicious part of a lesion.
Six of the prostates had multifocal disease with four or more discrete clinically significant PCa lesions; ARFI imaging was only able to detect a PCa lesion in only one (16.7%) of these six cases. These patients with multifocal disease tended to have PCa lesions that were relatively smaller in individual lesion volume (Fig. 10), which again, is more difficult for ARFI imaging to detect. ARFI image contrast is based on underlying differences in tissue stiffness (Doherty et al. 2013), and poor detection of small tumors may be caused by small changes in regional stiffness relative to large tumors.
The majority of ARFI ROS that corresponded to clinically significant PCa lesions were large (>0.5 mL) and had a Gleason score ≥7 (Fig. 10). Lesion location was an important determinant for visualization, and ARFI imaging was challenged in detecting clinically significant PCa lesions in the anterior region, including a large-volume (7.1 mL), Gleason 7 lesion (Figs. 8 and 10). Although retrospective review of the ARFI image in Figure 8 may reveal regions of decreased displacement that correspond to the lesion, the heterogeneous displacement profiles in the ARFI images caused by the BPH for this case challenged detection of this lesion, as clear unilateral lesion contrast could not be established (Table 2). Additionally, this anterior lesion existed in both the left and right halves of the prostate, and the lack of a localized unilateral lesion—as was the case for the lesions, for example, in Figure 6—made it more difficult to visualize (Fig. 8).
Overall, there were few anterior PCa lesions in this study, but those that existed were more difficult to visualize with ARFI imaging because of coarser spatial sampling and reduced signal-to-noise ratio compared with posterior PCa lesions. Some of the challenges in imaging anterior lesions can be addressed with a custom transducer designed specifically for ARFI prostate imaging that could achieve better acoustic depth penetration and finer rotational sampling in suspicious regions.
This study also allowed benign pathologies, such as atrophy and BPH, to be evaluated as potential confounders when identifying PCa lesions. Across all ARFI-identified ROS, only one region of atrophy was identified as a region of low suspicion (IOS = 1), and one region did not correspond to any pathology (also IOS = 1). BPH did, however, challenge the ability to identify peripheral PCa lesions, especially when the BPH dominated the central gland and distorted the normal prostate anatomy visualized in ARFI images (Fig. 9) (Palmeri et al. 2015).
Acoustic radiation force impulse imaging is one of several novel ultrasonic imaging modalities being investigated to improve on the poor performance of B-mode ultrasound imaging in delineating clinically significant PCa. A recent study by Moradi et al. (2014) using 3-D vibro-elastography and vector machine classification methods to identify PCa lesions based on image texture (e.g., contrast, homogeneity, standard deviation) yielded an area under the receiver operating characteristic curve of 0.81 ± 0.1 (Moradi et al. 2014). Shear wave elasticity imaging (SWEI) has also been studied in the prostate, with one study achieving a positive predictive value of 69.4% using an absolute shear modulus threshold of 37 kPa (Barr et al. 2012). Compressive strain elastography has also been used to evaluate PCa lesions, with a quoted specificity of 83%–91% and a positive predictive value of 69% (Cosgrove et al. 2013; Walz et al. 2011; Zhang et al. 2011). Other non-elasticity-based ultrasound methods using quantitative tissue characterization schemes are also being studied in the prostate (Braeckman et al. 2008; Feleppa et al. 2004), along with contrast-based approaches (Ferrara et al. 2000; Kuenen et al. 2011; Seitz et al. 2011; Wink et al. 2008).
Acoustic radiation force impulse imaging has several advantages over the other ultrasonic imaging modalities. Compressive strain elastography is dependent on application of uniform compression across the entire prostate gland, which can be challenging. This challenge has motivated the use of strain ratios between different regions of interest and quality maps of strain confidence to be displayed (Cosgrove et al. 2013). ARFI imaging is not dependent on application of uniform compression, and in fact, after achieving adequate acoustic coupling to the rectal wall, additional compression was minimized to avoid any elastic non-linearities in the tissue. Current SWEI implementations use shear wave speed reconstruction kernels of finite spatial extent that can limit the achievable spatial resolution (Rouze et al. 2012), but ARFI image spatial resolution is higher, because it is related to the displacement estimation kernel lengths and beam spacing (<1 mm). Additionally, ARFI imaging is less susceptible to the shear wave reflection artifacts that can be present in SWE images (Deffieux et al. 2011; Rouze et al. 2012).
Acoustic radiation force impulse images in this study were subjectively read with the target clinical user being a urologist for real-time procedural (biopsy/treatment) guidance. The 71.4% of clinically significant lesions that were detected in ARFI images across all of the prostates imaged in this study would be a great improvement over the current TRUS imaging used during biopsy procedures, which simply guides the complete core sampling across the entire organ during a random biopsy procedure, without lesion targeting. Other imaging technologies are being studied to guide prostate biopsies, such as MR:ultrasound fusion, but these methods have yielded accuracy ranging from 60% to 70% (Futterer et al. 2015; Siddiqui 2015) and are susceptible to modality registration errors because of prostate deformation and varying structural contrast between ultrasound and MR. The inherent co-registration between ARFI and B-mode ultrasound images provides a clear advantage over other multimodality imaging techniques.
The IOS scores (Table 2) used to quantify the ARFI image reads could be used in more advanced machine learning methods in combination with B-mode ultrasound, multiparametric MRI and other imaging and clinical metrics, as has been done with vibro-elastography (Moradi et al. 2014) and quantitative tissue-type imaging (TTI) (Feleppa et al. 2004), but that is beyond the scope of this work. Additionally, although the ARFI images in this study were subjectively scored, the images could also be more quantitatively evaluated based on the normalized displacement amplitudes. Metrics based on the IOS criteria, such as contrast and lesion heterogeneity, could be calculated from the displacement images and input into machine learning methods.
The ARFI imaging system implemented in this work using a larger-aperture, side-fire linear array was significantly improved in spatial resolution and penetration depth compared with previous work using an end-fire array (Zhai et al. 2012). Using the side-fire endorectal probe, however, did require the additional overhead of mechanical 3-D rotation and position tracking. This research system also required separate acquisition of high-resolution B-mode data from the ARFI imaging data, which led to extended imaging time and introduced the opportunity for spatial misalignment between ARFI and B-mode imaging planes. Future ARFI imaging systems will address these challenges with more advanced image sequencing capabilities to acquire concurrent B-mode and ARFI imaging data, and next-generation endorectal probes will allow for improved spatial resolution, contrast and penetration depth compared with the ER7 B transducer used in this study.
CONCLUSIONS
Acoustic radiation force impulse imaging can reliably identify posterior, clinically significant PCa lesions (79.3%). All highly suspicious (highest IOS = 3) regions in ARFI images were clinically significant PCa lesions, and all moderately suspicious regions (IOS = 2 or 3) corresponded to PCa lesions. Atrophy and BPH can enlarge the central gland, causing peripheral zone distortion, and create stiffness heterogeneity in the prostate that confounds ARFI PCa lesion identification. In general, ARFI imaging ROS did not coincide with benign atrophy and BPH pathologies. This study found that ARFI imaging has clinical value in identifying and differentiating clinically significant PCa lesions in the posterior region of the prostate, and advances in transducer technology and modified ARFI imaging sequences should allow the anterior region of the prostate to be more reliably interrogated in future studies.
Acknowledgments
This work was supported byNational Institutes of Health (NIH) Grants R01 CA142824, R41 CA196565-01, and T32-EB001040 and the Duke Coulter Translational Grant program. The authors thank Siemens Medical Solutions USA, Ultrasound Division, for their in-kind technical support, and the Duke University Medical Center Pathology Assistants for whole-mount histology preparation. Special thanks to Dr. Christina Hsu and Samantha Lipman for their contributions to prostate data formatting, and Ned Danieley for computer system administration.
References
- Ashab HA, Haq NF, Nir G, Kozlowski P, Black P, Jones EC, Goldenberg SL, Salcudean SE, Moradi M. Multimodal classification of prostate tissue: A feasibility study on combining multiparametric MRI and ultrasound. Proc SPIE. 2015;9414:94141B. [Google Scholar]
- Barr RG, Memo R, Schaub CR. Shear wave ultrasound elastography of the prostate: Initial results. Ultrasound Q. 2012;28:13–20. doi: 10.1097/RUQ.0b013e318249f594. [DOI] [PubMed] [Google Scholar]
- Bercoff JJ, Tanter M, Fink M. Supersonic Shear Imaging: A new technique for soft tissue elasticity mapping. IEEE Trans Ultrason Ferroelectr Freq Control. 2004;51:396–409. doi: 10.1109/tuffc.2004.1295425. [DOI] [PubMed] [Google Scholar]
- Braeckman J, Autier P, Garbar C, Marichal MP, Soviany C, Nir R, Nir D, Michielsen D, Bleiberg H, Egevad L, Emberton M. Computer-aided ultrasonography (histoscanning):A novel technology for locating and characterizing prostate cancer. BJU Int. 2008;101:293–298. doi: 10.1111/j.1464-410X.2007.07232.x. [DOI] [PubMed] [Google Scholar]
- Cornud F, Delongchamps NB, Mozer P, Beuvon F, Schull A, Muradyan N, Peyromaure M. Value of multiparametric MRI in the work-up of prostate cancer. Curr Urol Rep. 2012;13:82–92. doi: 10.1007/s11934-011-0231-z. [DOI] [PubMed] [Google Scholar]
- Correas JM, Tissier AM, Khairoune A, Khoury G, Eiss D, Hlnon O. Ultrasound elastography of the prostate: State of the art. Diagn Interv Imaging. 2013;94:551–560. doi: 10.1016/j.diii.2013.01.017. [DOI] [PubMed] [Google Scholar]
- Cosgrove D, Piscaglia F, Bamber J, Bojunga J, Correas JM, Gilja OH, Klauser AS, Sporea I, Calliada F, Cantisani V, D’Onofrio M, Drakonaki EE, Fink M, Friedrich-Rust M, Fromageau J, Havre RF, Jenssen C, Ohlinger R, Sftoiu A, Schaefer F, Dietrich CF. EFSUMB guidelines and recommendations on the clinical use of ultrasound elastography: Part 2: Clinical applications. Ultraschall Med. 2013;34:238–253. doi: 10.1055/s-0033-1335375. [DOI] [PubMed] [Google Scholar]
- Dahl J, Palmeri M, Agrawal V, Nightingale KR, Trahey GE. A parallel tracking method for acoustic radiation force impulse imaging. IEEE Trans Ultrason Ferroelectr Freq Control. 2007;54:301–312. doi: 10.1109/tuffc.2007.244. [DOI] [PMC free article] [PubMed] [Google Scholar]
- Deffieux T, Gennisson JL, Bercoff J, Tanter M. On the effects of reflected waves in transient shear wave elastography. IEEE Trans Ultrason Ferroelectr Freq Control. 2011;58:2032–2035. doi: 10.1109/TUFFC.2011.2052. [DOI] [PubMed] [Google Scholar]
- Dickinson L, Ahmed HU, Allen C, Barentsz JO, Carey B, Futterer JJ, Heijmink SW, Hoskin PJ, Kirkham A, Padhani AR, Persad R, Puech P, Punwani S, Sohaib AS, Tombal B, Villers A, van der Meulen J, Emberton M. Magnetic resonance imaging for the detection, localisation, and characterisation of prostate cancer: Recommendations from a European consensus meeting. Eur Urol. 2011;59:477–494. doi: 10.1016/j.eururo.2010.12.009. [DOI] [PubMed] [Google Scholar]
- Doherty J, Trahey G, Nightingale K, Palmeri M. Acoustic radiation force elasticity imaging in diagnostic ultrasound. IEEE Trans Ultrason Ferrorelectr Freq Control. 2013;60:685–701. doi: 10.1109/TUFFC.2013.2617. [DOI] [PMC free article] [PubMed] [Google Scholar]
- Eggert T, Khaled W, Wenske S, Ermert H, Noldus J. Impact of elastography in clinical diagnosis of prostate cancer: A comparison of cancer detection between B-mode sonography and elastography-guided 10-core biopsies. Urologe A. 2008;47:1212–1217. doi: 10.1007/s00120-008-1838-7. [DOI] [PubMed] [Google Scholar]
- Fedorov A, Beichel R, Kalpathy-Cramer J, Finet J, Fillion-Robin JC, Pujol S, Bauer C, Jennings D, Fennessy F, Sonka M, Buatti J, Aylward S, Miller J, Pieper S, Kikinis R. 3-D slicer as an image computing platform for the quantitative imaging network. Magn Reson Imaging. 2012;30:1323–1341. doi: 10.1016/j.mri.2012.05.001. [DOI] [PMC free article] [PubMed] [Google Scholar]
- Feleppa EJ, Porter CR, Ketterling J, Lee P, Dasgupta S, Urban S, Kalisz A. Recent developments in tissue-type imaging (TTI) for planning and monitoring treatment of prostate cancer. Ultrasonic Imaging. 2004;26:163–172. doi: 10.1177/016173460402600303. [DOI] [PMC free article] [PubMed] [Google Scholar]
- Ferrara KW, Merritt CR, Burns PN, Stuart Foster F, Mattrey RF, Wickline SA. Evaluation of tumor angiogenesis with US: Imaging, Doppler, and contrast agents. Acad Radiol. 2000;7:824–839. doi: 10.1016/s1076-6332(00)80631-5. [DOI] [PubMed] [Google Scholar]
- Futterer J, Briganti A, De Visschere P, Emberton M, Giannarini G, Kirkham A. Can clinically significant prostate cancer be detected with multiparametric magnetic resonance imaging? A systematic review of the literature. Eur Urol. 2015;68:1045–1053. doi: 10.1016/j.eururo.2015.01.013. [DOI] [PubMed] [Google Scholar]
- Gleason D. Histologic grading and clinical staging of prostatic carcinoma. In: Tannenbaum M, editor. Urologic pathology: The prostate. Philadelphia: Lea and Febiger; 1977. pp. 171–198. [Google Scholar]
- Gleason D. Histologic grading of prostatic carcinoma. In: Bostwick DG, editor. Pathology of the prostate. New York: Churchill Livingstone; 1990. [Google Scholar]
- Gleason D. Histologic grading of prostate cancer: A perspective. Hum Pathol. 1992;23:273–279. doi: 10.1016/0046-8177(92)90108-f. [DOI] [PubMed] [Google Scholar]
- Gupta RT, Kauffman CR, Polascik TJ, Taneja SS, Rosenkrantz AB. The state of prostate MRI in 2013. Oncology. 2013;27:262–270. [PubMed] [Google Scholar]
- Hoyt K, Castaneda B, Zhang M, Nigwekar P, di SantAgnese PA, Joseph JV, Strang J, Rubens DJ, Parker KJ. Tissue elasticity properties as biomarkers for prostate cancer. Cancer Biomark. 2008;4:213–225. doi: 10.3233/cbm-2008-44-505. [DOI] [PMC free article] [PubMed] [Google Scholar]
- Hricak H, Choyke PL, Eberhardt SC, Leibel SA, Scardino PT. Imaging prostate cancer: A multidisciplinary perspective. Radiology. 2007;243:28–53. doi: 10.1148/radiol.2431030580. [DOI] [PubMed] [Google Scholar]
- Knig K, Scheipers U, Pesavento A, Lorenz A, Ermert H, Senge T. Initial experiences with real-time elastography-guided biopsies of the prostate. J Urol. 2005;174:115–117. doi: 10.1097/01.ju.0000162043.72294.4a. [DOI] [PubMed] [Google Scholar]
- Kuenen M, Mischi M, Wijkstra H. Contrast-ultrasound diffusion imaging for localization of prostate cancer. IEEE Trans Med Imaging. 2011;30:1493–1502. doi: 10.1109/TMI.2011.2125981. [DOI] [PubMed] [Google Scholar]
- Loupas T, Peterson R, Gill R. Experimental evaluation of velocity and power estimation for ultrasound blood flow imaging, by means of a two-dimensional autocorrelation approach. IEEE Trans Ultrason Ferroelectr Freq Control. 1995;42:689–699. [Google Scholar]
- Mahdavi SS, Moradi M, Wen X, Morris WJ, Salcudean SE. Evaluation of visualization of the prostate gland in vibro-elastography images. Med Image Anal. 2011;15:589–600. doi: 10.1016/j.media.2011.03.004. [DOI] [PubMed] [Google Scholar]
- Mazzucchelli R, Barbisan F, Scarpelli M, Lopez-Beltran A, van der Kwast TH, Cheng L, Montironi R. Is incidentally detected prostate cancer in patients undergoing radical cystoprostatectomy clinically significant? Am J Clin Pathol. 2009;131:279–283. doi: 10.1309/AJCP4OCYZBAN9TJU. [DOI] [PubMed] [Google Scholar]
- Moradi M, Mahdavi SS, Nir G, Mohareri O, Koupparis A, Gagnon LO, Fazli L, Casey RG, Ischia J, Jones EC, Goldenberg SL, Salcudean SE. Multiparametric 3-D in vivo ultrasound vibroelastography imaging of prostate cancer: Preliminary results. Med Phys. 2014;41:073505. doi: 10.1118/1.4884226. [DOI] [PubMed] [Google Scholar]
- Mufarrij P, Sankin A, Godoy G, Lepor H. Pathologic outcomes of candidates for active surveillance undergoing radical prostatectomy. Urology. 2010;76:689–692. doi: 10.1016/j.urology.2009.12.075. [DOI] [PubMed] [Google Scholar]
- Pallwein L, Mitterberger M, Pinggera G, Aigner F, Pedross F, Gradl J, Pelzer A, Bartsch G, Frauscher F. Sonoelastography of the prostate: Comparison with systematic biopsy findings in 492 patients. Eur J Radiol. 2008;65:304–310. doi: 10.1016/j.ejrad.2007.03.032. [DOI] [PubMed] [Google Scholar]
- Palmeri ML, Miller ZA, Glass TJ, Garcia-Reyes K, Gupta RT, Rosenzweig SJ, Kauffman C, Polascik TJ, Buck A, Kulbacki E, Madden J, Lipman SL, Rouze NC, Nightingale KR. B-Mode and acoustic radiation force impulse (ARFI) Imaging of prostate zonal anatomy: Comparison with 3 T T2-weighted MR imaging. Ultrason Imaging. 2015;37:22–41. doi: 10.1177/0161734614542177. [DOI] [PMC free article] [PubMed] [Google Scholar]
- Raskolnikov D, Rais-Bahrami S, Turkbey B, Rastinehad AR, Choyke PL, Wood BJ, Pinto PA. Current ability of multiparametric prostate magnetic resonance imaging and targeted biopsy to improve the detection of prostate cancer. Urol Pract. 2014;1:13–21. doi: 10.1016/j.urpr.2014.02.012. [DOI] [PMC free article] [PubMed] [Google Scholar]
- Rastinehad AR, Turkbey B, Salami SS, Yaskiv O, George AK, Fakhoury M, Beecher K, Vira MA, Kavoussi LR, Siegel DN, Villani R, Ben-Levi E. Improving detection of clinically significant prostate cancer: Magnetic resonance imaging/transrectal ultrasound fusion guided prostate biopsy. J Urol. 2014;191:1749–1754. doi: 10.1016/j.juro.2013.12.007. [DOI] [PMC free article] [PubMed] [Google Scholar]
- Rosenzweig S, Palmeri M, Nightingale K. Analysis of rapid multi-focal-zone ARFI imaging. IEEE Trans Ultrason Ferroelectr Freq Control. 2015;62:280–289. doi: 10.1109/TUFFC.2014.006594. [DOI] [PMC free article] [PubMed] [Google Scholar]
- Rouze NC, Wang MH, Palmeri ML, Nightingale KR. Parameters affecting the resolution and accuracy of 2-D quantitative shear wave images. IEEE Trans Ultrason Ferroelectr Freq Control. 2012;59:1729–1740. doi: 10.1109/TUFFC.2012.2377. [DOI] [PMC free article] [PubMed] [Google Scholar]
- Salomon G, Köllerman J, Thederan I, Chun FK, Budus L, Schlomm T, Isbarn H, Heinzer H, Huland H, Graefen M. Evaluation of prostate cancer detection with ultrasound real-time elastography: A comparison with step section pathological analysis after radical prostatectomy. Eur Urol. 2008;54:1354–1362. doi: 10.1016/j.eururo.2008.02.035. [DOI] [PubMed] [Google Scholar]
- Schneider CA, Rasband WS, Eliceiri KW. NIH Image to ImageJ: 25 years of image analysis. Nat Methods. 2012;9:671–675. doi: 10.1038/nmeth.2089. [DOI] [PMC free article] [PubMed] [Google Scholar]
- Seitz M, Gratzke C, Schlenker B, Buchner A, Karl A, Roosen A, Singer BB, Bastian PJ, Ergn S, Stief CG, Reich O, Tilki D. Contrast-enhanced transrectal ultrasound (CE-TRUS) with cadence-contrast pulse sequence (CPS) technology for the identification of prostate cancer. Urol Oncol Semin Orig Invest. 2011;29:295–301. doi: 10.1016/j.urolonc.2009.03.032. [DOI] [PubMed] [Google Scholar]
- Siddiqui M. Comparison of MR/ultrasound fusion-guided biopsy with ultrasound-guided biopsy for the diagnosis of prostate cancer. JAMA. 2015;313:390–397. doi: 10.1001/jama.2014.17942. [DOI] [PMC free article] [PubMed] [Google Scholar]
- Taylor LS, Rubens DJ, Porter BC, Wu Z, Baggs RB, di Sant’Agnese PA, Nadasdy G, Pasternack D, Messing EM, Nigwekar P, Parker KJ. Prostate cancer: Three-dimensional sonoelastography for in vitro detection. Radiology. 2005;237:981–985. doi: 10.1148/radiol.2373041573. [DOI] [PubMed] [Google Scholar]
- Walz J, Marcy M, Pianna J. Identification of the prostate cancer index lesion by real-time elastography: Considerations for focal therapy of prostate cancer. World J Urol. 2011;29:589594. doi: 10.1007/s00345-011-0688-x. [DOI] [PubMed] [Google Scholar]
- Wink M, Frauscher F, Cosgrove D, Chapelon JY, Palwein L, Mitterberger M, Harvey C, Rouvire O, de la Rosette J, Wijkstra H. Contrast-enhanced ultrasound and prostate cancer: A Multicentre European Research Coordination project. Eur Urol. 2008;54:982–993. doi: 10.1016/j.eururo.2008.06.057. [DOI] [PubMed] [Google Scholar]
- Yang XJ, Lecksell K, Potter SR, Epstein JI. Significance of small foci of Gleason score 7 or greater prostate cancer on needle biopsy. Urology. 1999;54:528–532. doi: 10.1016/s0090-4295(99)00166-1. [DOI] [PubMed] [Google Scholar]
- Zhai L, Madden J, Foo WC, Palmeri ML, Mouraviev V, Polascik TJ, Nightingale KR. Acoustic radiation force impulse imaging of human prostates ex vivo. Ultrasound Med Biol. 2010;36:576–588. doi: 10.1016/j.ultrasmedbio.2009.12.006. [DOI] [PMC free article] [PubMed] [Google Scholar]
- Zhai L, Polascik T, Foo W, Rosenzweig S, Palmeri M, Madden J, Nightingale K. Acoustic radiation force impulse imaging of human prostates: Initial in vivo demonstration. Ultrasound Med Biol. 2012;38:50–61. doi: 10.1016/j.ultrasmedbio.2011.10.002. [DOI] [PMC free article] [PubMed] [Google Scholar]
- Zhang Y, Tang J, Li YM, Fei X, Lv QY, Shi HY. Differentiation of prostate cancer from benign lesions using strain index of transrectal real-time tissue elastography. Eur J Radiol. 2011;81:857–862. doi: 10.1016/j.ejrad.2011.02.037. [DOI] [PubMed] [Google Scholar]


