Abstract
Breast cancer is a public health concern worldwide. Prolonged exposure to estrogens has been implicated in the development of breast neoplasms. Epidemiologic and experimental evidence suggest a chemopreventive role of phytoestrogens in breast cancers. Resveratrol, a naturally occurring phytoestrogen, has been shown to have potent anti-cancer properties. However, poor efficacy and bioavailability have prevented the use of resveratrol in clinics. In order to address these problems, we have synthesized a combinatorial library of azaresveratrol analogs and tested them for their ability to inhibit the proliferation of breast cancer cells. We have recently shown that 4-(E)-{(p-tolylimino)-methylbenzene-1,2-diol} (TIMBD), has better anti-cancer properties than resveratrol and any other resveratrol analog we have synthesized so far. The objective of this study was to investigate the regulation of estrogen receptors (ERs) α and β by TIMBD in breast cancer cell lines. We demonstrate that TIMBD significantly induces the mRNA and protein expression levels of ERβ and inhibits that of ERα. TIMBD inhibits mRNA and protein expression levels of oncogene c-Myc, and cell cycle protein cyclin D1, which are important regulators of cellular proliferation. TIMBD significantly induces protein expression levels of tumor suppressor genes p53 and p21 in MCF-7 cells. TIMBD inhibits c-Myc in an ERβ-dependent fashion in MCF-10A and ERβ1-transfected MDA-MB-231 cells, suggesting regulation of ERs as an important upstream mechanism of this analog. ERβ plays a partial role in inhibition of proliferation by TIMBD while ERα overexpression does not significantly affect TIMBD’s inhibition.
Keywords: Estrogen receptors, Resveratrol analogs, TIMBD, Breast cancer inhibition
Introduction
Epidemiological evidence suggests that diet and nutrition may play an important role in breast cancer development [1–3]. Studies have shown that Asian women have three times lower risk for breast cancer than women living in the United States [4]. This lower risk has been partially associated with Asian diets that consist of considerably higher amounts of phytoestrogens [1, 5, 6]. Phytoestrogens are biologically active metabolites of plant origin that structurally mimic mammalian estrogens and are mainly found in fruits, vegetables and herbs [1–3].
Resveratrol (Res), a naturally occurring phytoalexin obtained from plants, has been shown to have both chemo-preventive and anti-cancer activities [7, 8]. Resveratrol is considered a phytoestrogen since it can bind to and activate estrogen receptors (ERs) α and β [9]. The significance of ERs in breast cancer is underscored by the fact that 75% of breast cancer cases are ER-positive and depend on endogenous estrogens for tumor progression [10, 11, 12]. Since Res structurally mimics estrogens, it acts as partial agonist at both the ERs [9, 13]. However, in presence of estrogens, which are stronger agonists at ERs, Res acts as an antagonist to ERα, although no antagonist activity for ERβ has been reported [9, 13]. The partial agonist/antagonist activity of Res depends on many factors including concentration, relative ER expressions, cofactors and cell-type [9]. Resveratrol has shown a substantially higher binding affinity and transcriptional activation for ERβ compared to ERα suggesting it may be able to activate ERβ at concentrations lower than that required to activate ERα [9, 14]. Studies have reported that regulation of estrogen signaling by Res can affect cellular proliferation in breast epithelial and breast cancer cells [13, 15]. It has been postulated that the growth inhibitory effects of Res could be attributed to its higher transcriptional activity at ERβ, given the inhibitory role of ERβ on estrogen-mediated cellular proliferation [16, 17]. Phytoestrogens are known to show a concentration dependent biphasic effect on cellular proliferation with growth promoting effects seen at lower concentrations and inhibitory effects seen at higher concentrations [9, 13, 18]. Resveratrol has been shown to stimulate growth of ER-positive MCF-7 breast cancer cells at low concentration of 4 μM and inhibit growth at higher concentration of 44 μM [19, 20]. The growth inhibitory effects of Res have also been attributed to other mechanisms including regulation of cell cycle and induction of tumor suppressor proteins, which may be independent of interactions with ERs [21].
Several in vivo studies have shown the chemo-preventive and anti-cancer effects of Res [15]. Resveratrol has been shown to inhibit estrogen-induced carcinogenesis in rats [22]. Resveratrol has also shown inhibition of 7,12-dimethylbenz(a)anthracene (DMBA) and N-methyl-N-nitrosourea (MNU)-induced mammary carcinomas in rats [23, 24]. Resveratrol induced apoptosis and inhibited angiogenesis in in vivo xenograft studies with MDA-MB-231 cell line [25]. However, in 4T1 breast cancer cells, the inhibitory effect of Res seen in vitro studies was lost when the experiment was conducted in vivo in mice [26]. Despite the ample data available on Res’s anticancer effects in vitro and in animals, clinical support in human studies has been lacking [15]. The primary reason for this is the poor bioavailability of Res in humans [15]. Pharmacokinetic studies in healthy human subjects have revealed that Res is extensively metabolized in the liver with an oral bioavailability of less than 1% [27, 28].
As reported recently, we have synthesized a library of azaresveratrol analogs that possess the basic structure of Res with additional pharmacophoric groups in an attempt to increase the anti-cancer efficacy of Res [29]. Of the six analogs tested, two analogs referred to as 3e and 3b; now termed as HPIMBD and TIMBD, respectively, showed better cancer inhibitory activities than Res [29]. 4-(E)-{(p-tolylimino)-methylbenzene-1,2-diol} (TIMBD) showed better potency than any of the other analogs in inhibiting the proliferation of breast cancer cell lines [29]. We have recently shown the effect of 4-(E)-{(4-hydroxyphenylimino)-methylbenzene, 1,2-diol} (HPIMBD) in regulating ERs in breast cancer cells [30]. In the present study, we investigated the effect of TIMBD on the regulation of ERα and β. We present evidence that TIMBD significantly induces the mRNA and protein expression levels of ERβ and inhibits that of ERα. We further demonstrate that TIMBD significantly inhibits mRNA and protein expression levels of oncogene c-Myc and cell cycle protein cyclin D1. Further, TIMBD induces protein expression levels of tumor suppressor genes p53 and p21 in MCF-7 breast cancer cells. TIMBD regulates the expression of c-Myc in an ERβ-dependent fashion in MCF-10A and ERβ1-transfected MDA-MB-231 cells. However, silencing ERβ in MDA-MB-231-ERβ transfected cells only partially rescues cells from inhibition by TIMBD. Overexpression of ERα in ERα-negative MDA-MB-231 cell line does not significantly affect the inhibitory potential of TIMBD. Taken together, our studies suggest that TIMBD, a novel analog of Res, differentially regulates the expressions of ERs and inhibits proliferation of breast cancer cells via targeting multiple molecular mechanisms.
Materials and Methods
Chemicals
Resveratrol was purchased from Sigma-Aldrich (St. Louis, MO). Resveratrol analog TIMBD was synthesized and purified by our group as reported previously [29]. Doxycycline was purchased from Clontech (Mountain View, CA). Resveratrol and TIMBD were dissolved in dimethyl sulfoxide (DMSO) prior to treatments. Doxycycline was dissolved in sterile purified water. The concentration of DMSO in control experiments was always 1/1000th (vol/vol) of the final medium volume. 3-(4,5-Dimethyl-2-thiazolyl)-2,5-diphenyl-2H-tetrazolium bromide (MTT) was purchased from Sigma-Aldrich (St. Louis, MO). A stock solution of MTT reagent was prepared by dissolving MTT in sterilized PBS to a final concentration of 1 mg/ml.
Cell Culture
Non-neoplastic breast epithelial cell line MCF-10A and breast cancer cell lines MCF-7, T47D and MDA-MB-231 were purchased from ATCC (Manassas, VA). Estrogen receptor β1-transfected MDA-MB-231 and empty vector-transfected MDA-MB-231 were a gift from Dr. Leigh C. Murphy (University of Manitoba, Canada). All breast epithelial and breast cancer cell lines were cultured as reported recently [30]. Cells were treated with 50 μM doses of Res or TIMBD for up to 72 hours. Cells from ERβ1-transfected and empty vector-transfected MDA-MB-231 were treated with doxycycline (final concentration 1μg/ml) for 24 hours prior to treatment with Res or TIMBD, to induce the expression of ERβ from the Tet-On inducible expression vector. Following treatments, cells were lysed to harvest either RNA or proteins.
MTT cell viability assay
Cells were seeded in 96-well plates for MTT assays and treated with 50 μM Res or TIMBD for 72 hours [30]. After treatments, cells were incubated with MTT reagent at 37°C. Formazan crystals were dissolved in DMSO and plates were read in Benchmark Plus microplate spectrophotometer (Biorad, Hercules, CA). Percentage of viable cells were calculated as described recently [30].
Lactate Dehydrogenase release cytotoxicity assay
This assay was performed using a cytotoxicity LDH assay kit from Pierce (Thermo Fisher Scientific, Rockford, IL). Cells were plated in 96-well plates and treated with different doses of Res or TIMBD as described recently [30]. Post-treatments, medium was collected and absorbance was measured using the Benchmark Plus microplate spectrophotometer (Biorad, Hercules, CA). Mean % released LDH compared to total intracellular LDH was calculated as described recently [30].
BrdU Incorporation Assay
The Bromodeoxyuridine (BrdU) incorporation assay was carried out using the FITC BrdU Flow Kit (BD Biosciences, San Jose, CA). Cells were plated in 6-well plates and treated with 50 μM Res or TIMBD for 48 hours [30]. BrdU incorporating cells were analyzed following manufacturer’s instructions and as reported recently [30]. The results are expressed as the % of cells incorporating BrdU and calculated as mean ± SEM from three different experiments.
Reverse transcription and Real-time PCR
Following treatments with Res or TIMBD, total RNA was isolated using TRI reagent and reverse transcribed using superscript II reverse transcription system as described recently [30]. Real-time PCR was performed using human specific ERα (QT00044492) and ERβ (QT00060641) primers (Qiagen, Valencia, CA). The expression levels of ERα or β relative to cyclophilin were determined as reported recently [30]. A standard curve was run on each plate to allow for accurate quantification of cDNA, as reported previously [31–37].
Western Blot analysis
Western blot analyses were performed as described previously [31–37]. Affinity purified rabbit polyclonal antibodies against ERα (Santa Cruz, sc-543), ERβ (Santa Cruz, sc-8974), c-Myc (Santa Cruz, sc-788), cyclin D1 (Santa Cruz, sc-753), p53 (Santa Cruz, sc-55476) and p21 (Santa Cruz, sc-6264) were diluted in PBS/0.05% Tween-20 and used for immune-detection as reported recently [30]. Following incubation with primary antibodies, membranes were incubated with the respective secondary antibodies for each protein as described recently [30]. Chemiluminescent detection was performed using the BM Chemiluminescence Detection kit (Roche, Indianapolis, IN) and the FluorChem HD2 Imaging system (Alpha Innotech Corporation, San Leandro, CA), with AlphaEaseFC Image Analysis software (Alpha Innotech Corporation, San Leandro, CA). Membranes were then stripped with Restore Western blot stripping buffer (Thermo Scientific, Rockford, IL) and re-incubated with α-tubulin mouse monoclonal antibody (Santa Cruz, sc-53030) as the loading control.
RNA interference
Small interfering RNAs (siRNAs) for ERβ (sc-35325) and control siRNA (sc-37007) were obtained from Santa Cruz Biotechnology (Santa Cruz, CA). MCF-10A, ERβ1-transfected MDA-MB-231, MCF-7 and T47D cells were transfected with 1 nmol/l siERβ using Lipofectamine 2000 transfection reagent (Invitrogen, Carlsbad, CA) as described previously [31–34]. Cells transfected with siERβ were treated with 50 μM TIMBD for 12 hours (ERβ1-transfected MDA-MB-231), 24 hours (MCF-10A) and 48 hours (MCF-7 and T47D) and used for western blot analyses.
Transient transfection
Estrogen receptor α and empty vector plasmids (V864-20) were obtained from Invitrogen (Carlsbad, CA). MDA-MB-231 cells were transiently transfected with ERα and empty-vector plasmids using Lipofectamine 2000 transfection reagent (Invitrogen, Carlsbad, CA) for 48 hours. Media was changed and cells were allowed to grow for another 24 hours. Cells were then harvested, counted and plated for further assays. Western blot analyses were performed to confirm ERα expression.
Clonogenic cell survival assay
500 viable cells were seeded in 6-well plates and allowed to grow for 24 hours in phenol red-free complete media. The cells were then treated with either vehicle (DMSO) or TIMBD for 72 hours after which they were washed in PBS and incubated for an additional 8 days in complete medium. The colonies obtained were fixed in 10% formalin for 15 min followed by staining with 0.1% crystal violet solution [22, 31, 33]. The colonies were counted, photographed and compared with respective untreated cells. Each treatment was done in triplicate.
Mammosphere assay
Mammosphere formation assays were performed using ultra-low attachment plates (Corning, Lowell, MA). 5000 viable cancer cells transiently transfected with siERβ, control siRNA or un-transfected cells were seeded into 24-well plates. Cells were grown in serum-free DMEM/F-12 (50:50) medium supplemented with 1×B27 (Invitrogen), 20 ng/ml epidermal growth factor (Invitrogen), 20 ng/ml basic fibroblast growth factor (Invitrogen), 1 μg/ml hydrocortisone (BD Biosciences, Bedford, MA), 5 μg/ml insulin (Invitrogen), 0.1% penicillin/streptomycin (Lonza, Walkersville, MD) and 4 μg/ml heparin calcium salt (Thermo Scientific). Cells were treated with vehicle or TIMBD. After 3–5 days of incubation, mammospheres were viewed under the microscope and photographed [22, 31, 33]. Three replicate wells from a 24-well plate were used for each experimental condition.
Statistical analysis
Statistical analyses were performed using Sigma Plot 11.0 software (Systat Software, San Jose, CA) and IBM SPSS Statistics 19 software (IBM, Armonk, NY). Student’s t-test and one-way analysis of variance (ANOVA) with a least significant difference (LSD) post-hoc test were used to compare ERα, ERβ, c-Myc and cyclin D1 mRNA expression changes and ERα, ERβ, c-Myc, cyclin D1, p53 and p21 protein expression changes in treated cells as described recently [30]. These tests were also used to compare the changes in percent proliferation of cells, percent release of LDH, percent BrdU incorporation and number of colonies formed in experiments. A p-value < 0.05 was considered significant. All experiments were performed in triplicates or quadruplicates.
Results
TIMBD significantly inhibits proliferation of breast cancer cell lines
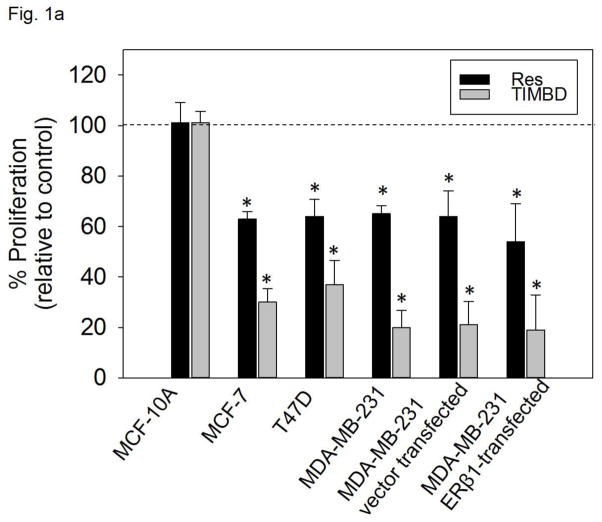
We have previously reported the effect of Res, TIMBD and other Res analogs on cellular proliferation of non-neoplastic breast epithelial cell line MCF-10A and breast cancer cell lines MDA-MB-231 and T47D [29]. TIMBD exhibited most potent inhibitory activity against MDA-MB-231 cells (with ~75% inhibition of cellular proliferation) and T47D cells (with ~60% inhibition) compared to Res which induced only 40% inhibition in both cell lines [29]. Also, TIMBD did not affect the growth of MCF-10A cells up to 50 μM concentration suggesting it is not toxic to normal breast cells and selective towards cancer cells [29]. We further evaluated the growth inhibitory effect of TIMBD on three other breast cancer cell lines, namely, MCF-7, vector-transfected and ERβ1-transfected MDA-MB-231 cell lines. We have previously reported that Res treatment resulted in about 40 – 50% inhibition of cellular proliferation in the above mentioned cell lines [29, 30]. In the current study, we demonstrate that TIMBD treatment results in about ~70% inhibition of MCF-7 cells and >70% inhibition of the vector-transfected and ERβ1-transfected MDA-MB-231 cells (Fig. 1a). TIMBD was better than HPIMBD in inhibiting cellular proliferation in these breast cancer cells, results of HPIMBD have been reported previously [30].
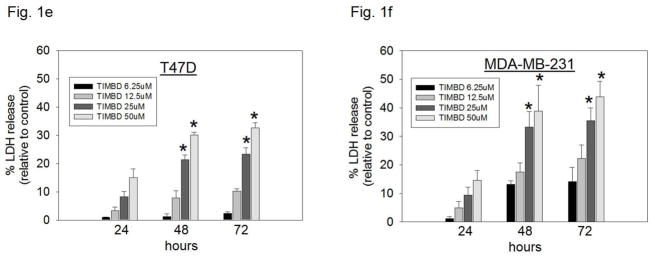
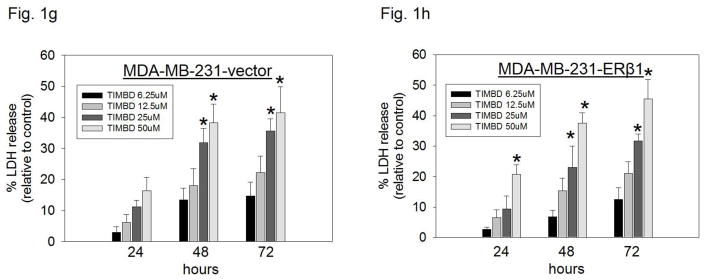
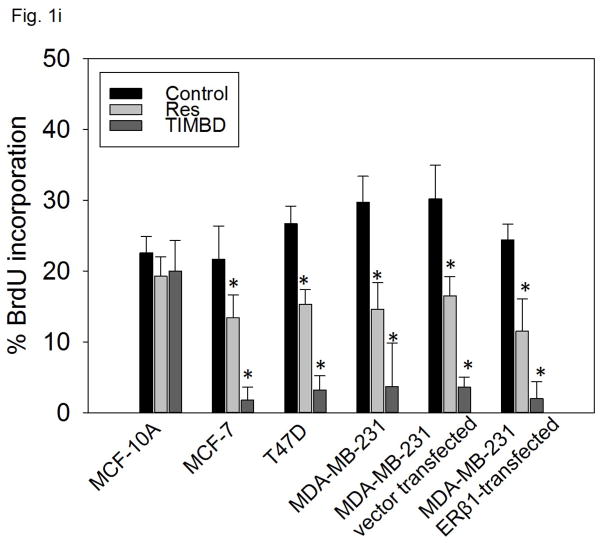
Fig. 1. TIMBD significantly inhibits proliferation of breast cancer cell lines and shows a dose- and time-dependent cytotoxicity.
a) Non-neoplastic breast epithelial cell line MCF-10A and breast cancer cell lines MCF-7, T47D, MDA-MB-231, vector-transfected and ERβ1-transfected MDA-MB-231 were treated with vehicle (DMSO) or 50 μM Res or TIMBD for 72 hours and MTT assays were performed. Percentage proliferation was determined by dividing the absorbance in Res- or TIMBD-treated cells by that in vehicle-treated cells X 100. Each experiment was performed in quadruplicate and data are expressed as percentage proliferation ± SEM relative to respective vehicle-treated controls.
b) LDH release assays were performed on breast epithelial and breast cancer cell lines as described in the Materials and Methods section. Percentage increase in LDH release was determined by dividing the difference of absorbances between Res-, TIMBD- and vehicle-treated cells to the difference of absorbances between total intracellular LDH and vehicle-treated cells X 100. Each experiment was performed in triplicate and data are expressed as percentage LDH release ± SEM relative to respective vehicle-treated controls (taken as 0%).
c–h) Breast epithelial and breast cancer cell lines were treated with vehicle (DMSO) or graded doses of TIMBD for up to 72 hours and LDH release assays were performed. Percentage increase in LDH release was determined as described above.
i) Breast epithelial and breast cancer cell lines were treated with vehicle (DMSO) or 50 μM Res or TIMBD for 48 hours and BrdU incorporation assays were performed. Each experiment was performed in triplicate and the data are expressed as percentage BrdU incorporation ± SEM.
(*) indicates a P value <0.05 compared to respective controls.
Dose and time-dependent cytotoxicity induced by Res analog TIMBD in breast cancer cell lines
Breast cancer cell lines MCF-7, T47D, MDA-MB-231, vector-transfected and ERβ1-transfected MDA-MB-231 were treated with different doses of TIMBD (0, 6.25, 12.5, 25 and 50μM) for up to 72 hours. The extent of cell death was measured after 24, 48 and 72 hours. TIMBD (50μM dose) significantly resulted in ~30% increase in LDH release in MCF-7 and T47D cells and ~40% increase in the triple-negative MDA-MB-231, vector-transfected and ERβ1-transfected MDA-MB-231 cell lines after 72 hours treatment (Fig. 1b). Treatment of MCF-10A cells with different doses of TIMBD (0, 6.25, 12.5, 25 and 50 μM) did not have any cytotoxic effect up to a dose of 50 μM (Fig. 1c). A time-dependent study showed that TIMBD significantly increased cytotoxicity at 48 hours which further increased after 72 hours in all the tested breast cancer cell lines (Fig. 1d–h). A dose-dependent study suggested that TIMBD caused significant cytotoxicity at 25 and 50 μM doses (Fig. 1d–h). The cytotoxic effects induced by TIMBD were comparable to that of HPIMBD reported previously [30].
TIMBD significantly decreases BrdU incorporation in breast cancer cell lines
To assess the effect of TIMBD on cellular proliferation, non-neoplastic breast epithelial and breast cancer cell lines were treated with 50 μM TIMBD for 48 hours and BrdU incorporation was assessed. TIMBD did not affect the cellular proliferation of MCF-10A cells at 50 μM dose (Fig. 1i). However, TIMBD caused a significant decrease in the percentage of breast cancer cell lines incorporating BrdU (Fig. 1i). As reported previously [30], the vehicle treated control cells of all the cell lines tested showed about 20–30% of BrdU incorporation. TIMBD treatment resulted in about 2–5% of cancer cells incorporating BrdU, which amounts to 80–90% decrease in BrdU incorporation compared to respective controls (Fig. 1i). BrdU incorporation studies confirmed that TIMBD is better than HPIMBD, which showed 75–85% inhibition in cellular proliferation of breast cancer cells [30].
TIMBD significantly induces mRNA and protein expression levels of ERβ in breast cancer cells
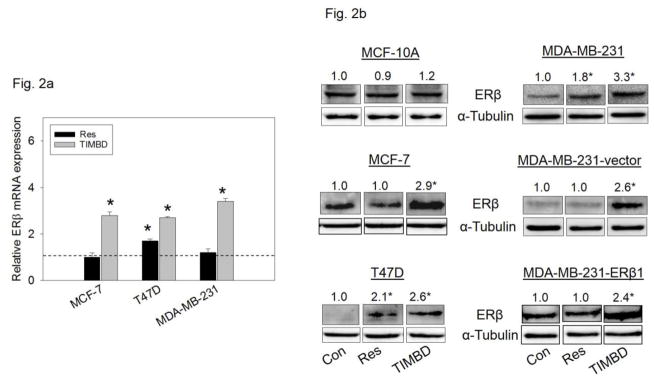
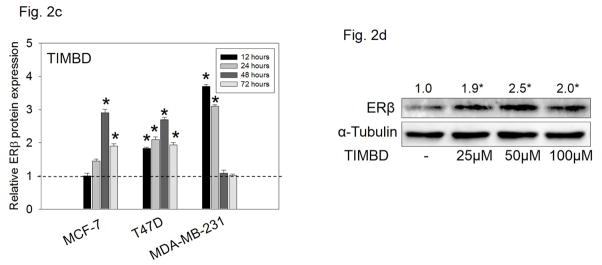
Breast epithelial and breast cancer cell lines mentioned above were treated with 50 μM Res or TIMBD for up to 72 hours and PCR analyses were performed. Please note that the data on the induction of ERβ by Res have been reported previously [30]. In this study, we demonstrate that TIMBD significantly induced ERβ mRNA levels in all cell lines tested compared to Res or control treated cells (Fig. 2a). TIMBD treatment resulted in 2-3-fold induction of ERβ mRNA in MCF-7, T47D and MDA-MB-231 cell lines (Fig. 2a). TIMBD significantly induced protein expression levels of ERβ, ranging from 2 to 3-fold, in all the breast cancer cell lines tested and modestly increased ERβ protein expression in MCF-10A cells up to 1.2-fold (Fig. 2b). The ERβ1-transfected MDA-MB-231 cell line also showed induction of ERβ1 upon TIMBD treatment (Fig. 2b). The ERβ1 transgene in this cell line is under the rTA-regulated promoter and not its natural promoter [30]. A time-course study with TIMBD showed a maximal induction of ERβ after 48 hours in both MCF-7 and T47D cell lines; and after 12 hours in MDA-MB-231 cell line (Fig. 2c). A dose-response study showed a maximal induction of ERβ protein at a dose of 50 μM(Fig. 2d). With respect to ERβ induction, effect of TIMBD was comparable to that of HPIMBD, reported previously [30].
Fig. 2. TIMBD induces mRNA and protein expression levels of ERβ.
a) MCF-7, T47D and MDA-MB-231 cells were treated with vehicle (DMSO) or 50 μM Res or TIMBD for 24 hours. Total RNA was isolated and reverse transcribed to cDNA. Real-time quantitative PCR was performed to analyze the expression of cyclophilin and ERβ mRNA. Expression of ERβ mRNA was determined by dividing the number of cDNA molecules of ERβ by the number of cDNA molecules of cyclophilin, a housekeeping gene. Fold change was determined by dividing the expression of ERβ in the Res- or TIMBD-treated cells by the expression of ERβ in vehicle-treated cells (taken as 1). Each experiment was performed in quadruplicate and the data are expressed as fold change ± SEM relative to control.
b) MCF-10A and breast cancer cell lines were treated with vehicle (DMSO) or 50 μM doses of Res or TIMBD for up to 72 hours. Proteins were isolated and western blot analyses were performed as described in the Materials and Methods section. Intensities of the bands were quantified and normalized to α-tubulin. Fold changes in ERβ protein expression (Mean ± SEM) in respective cell lines or transgene tagged ERβ1 protein expression (Mean ± SEM) in ERβ1-transfected MDA-MB-231 cells treated with Res or TIMBD compared to vehicle-treated controls of the same cell type were calculated from four individual experiments and the mean values are given at the top of each blot. Representative western blots are shown for each cell line mentioned above at the time point of maximal induction of ERβ in that cell line (MCF-10A = 24 hours; MDA-MB-231, vector-transfected and ERβ1-transfected MDA-MB-231 = 12 hours; MCF-7 and T47D = 48 hours). The vertical lines in the boxes indicate that intervening lanes have been removed. Each individual western blot panel compares signals from protein samples loaded on the same gel.
c) MCF-7, T47D and MDA-MB-231 cell lines were treated with vehicle (DMSO) or 50 μM TIMBD up to 72 hours and a time-course study was performed. Intensities of the bands were quantified and normalized to α-tubulin. Fold changes compared to vehicle-treated controls were calculated from four individual experiments. The bar graph represents fold change in ERβ protein expression (Mean ± SEM) in respective cell lines treated with Res or TIMBD compared to vehicle-treated controls.
d) MDA-MB-231 cells were treated with vehicle or 25 to 100 μM doses of TIMBD for 12 hours and a dose-response study was performed. Intensities of the bands were quantified and normalized to α-tubulin. Fold changes in ERβ protein expression (Mean ± SEM) compared to vehicle-treated control were calculated from four individual experiments and the mean values are given at the top of each blot.
(*) indicates a P value <0.05 compared to respective controls.
TIMBD significantly inhibits mRNA and protein expression levels of ERα in breast cancer cells
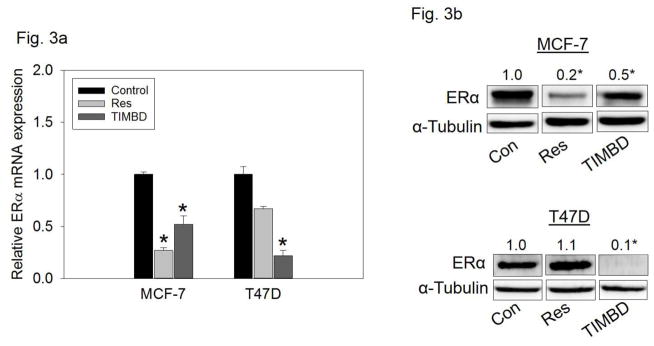
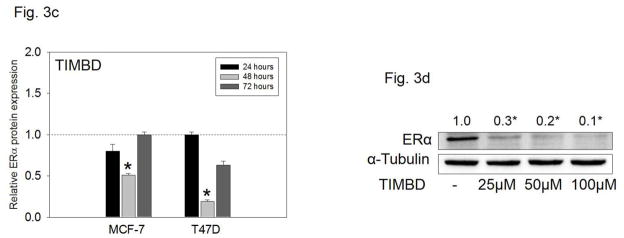
MCF-7 and T47D cells which express ERα [38] were treated with 50 μM Res or TIMBD for up to 72 hours. TIMBD significantly inhibited mRNA and protein expression of ERα in MCF-7 and T47D cell lines compared to respective controls (Fig. 3a and b). The protein inhibition was 80–90% in T47D and 50% in MCF-7 cell lines (Fig. 3b). A time-course study showed maximal inhibition of ERα protein expression levels at 48 hours post-TIMBD treatment (Fig. 3c). A dose-response study showed a dose-dependent inhibition of ERα expression levels with maximal inhibition of 90% at 100 μM dose in T47D cells (Fig. 3d). With regards to ERα inhibition, effect of TIMBD treatments was comparable to HPIMBD [30]. The ratio of ERβ:ERα was determined as a ratio of fold protein expressions in MCF-7 and T47D cells after 48 hours of treatment with 50 μM TIMBD. TIMBD showed a significant increase in ERβ:ERα ratio up to 13-fold (Table 1) as compared to a 10-fold increase by HPIMBD in T47D cell line, as reported previously [30].
Fig. 3. TIMBD inhibits mRNA and protein expression levels of ERα.
a) MCF-7 and T47D cells were treated with vehicle (DMSO) or 50 μM Res or TIMBD for 24 hours. Total RNA was isolated and reverse transcribed to cDNA. Real-time quantitative PCR was performed to analyze the expression of cyclophilin and ERα mRNA. Expression of ERα mRNA was determined as described in the Materials and Methods section. Each experiment was performed in quadruplicate and the data are expressed as fold change + SEM relative to control.
b) MCF-7 and T47D cells were treated with vehicle (DMSO) or 50 μM Res or TIMBD for up to 72 hours. Proteins were isolated and western blot analyses were performed. Fold changes in ERα (Mean ± SEM) compared to vehicle-treated controls were calculated from four individual experiments and the mean values are given at the top of each blot. Representative western blots are shown for MCF-7 and T47D cell lines after 48 hours of treatments, which is the time point of maximal inhibition of ERα in the breast cancer cell lines post-TIMBD treatment. The vertical lines in the boxes indicate that intervening lanes have been removed. Each individual western blot panel compares signals from protein samples loaded on the same gel.
c) MCF-7 and T47D cell lines were treated with vehicle (DMSO) or 50 μM TIMBD for up to 72 hours and a time-course study was performed. Proteins were isolated and western blot analyses were performed. Intensities of bands were quantified and normalized to α-tubulin. Fold changes compared to vehicle-treated controls were calculated from four individual experiments. The bar graph represents fold change in ERα protein expression (Mean ± SEM) in respective cell lines treated with TIMBD compared to vehicle-treated controls.
d) T47D cells were treated with vehicle or 25 to 100 μM doses of TIMBD for 48 hours and a dose-response study was performed. Proteins were isolated and western blot analyses were performed. Intensities of the bands were quantified and normalized to α-tubulin. Fold changes in ERα protein expression (Mean ± SEM) compared to vehicle-treated controls were calculated from four individual experiments and the mean values are given at the top of each blot.
(*) indicates a P value <0.05 compared to respective controls.
Table 1. Ratio of ERβ to ERα protein expressions in MCF-7 and T47D cell lines treated with TIMBD.
MCF-7 and T47D breast cancer cell lines were treated with vehicle (DMSO) or 50 μM Res or TIMBD for 48 hours, which is the time point of maximal induction of ERβ and maximal inhibition of ERα in these cell lines. Proteins were isolated and western blot analyses were performed. Intensities of the bands were quantified and normalized to α-tubulin. Fold changes in ERβ or ERα protein expression (Mean ± SEM) treated with Res or TIMBD compared to vehicle-treated controls were calculated from four individual experiments and ratios of ERβ:ERα were determined.
| Cell line | Treatment | Fold ERβ | Fold ERα | Ratio (ERβ/ERα) |
|---|---|---|---|---|
| MCF-7 | Res | 1 | 0.2 | 5 |
| TIMBD | 2.9 | 0.5 | 5.8 | |
| T47D | Res | 1.9 | 0.9 | 2.1 |
| TIMBD | 2.7 | 0.2 | 13.5 |
TIMBD inhibits mRNA and protein expression levels of c-Myc and cyclin D1 in breast cancer cells
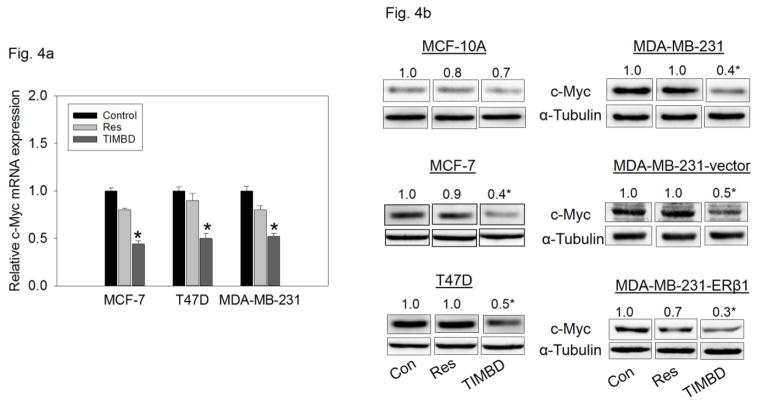
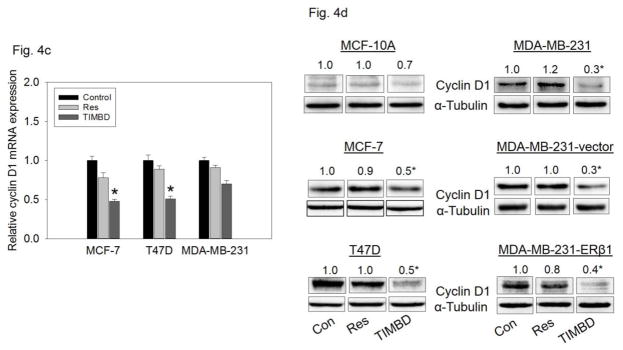
Breast epithelial and breast cancer cell lines were treated with 50 μM TIMBD for up to 72 hours to assess expression levels of oncogene c-Myc and cell cycle regulating protein cyclin D1 [39]. TIMBD significantly inhibited c-Myc and cyclin D1 mRNA levels in MCF-7, T47D and MDA-MB-231 cell lines up to 50% compared to control cells (Fig. 4a and c). TIMBD significantly inhibited protein expression levels of c-Myc in all the tested breast cancer cell lines, ranging from 50–70% and up to 30% in MCF-10A cells (Fig. 4b). TIMBD significantly inhibited protein expression levels of cyclin D1 in all the tested breast cancer cell lines, ranging from 50–70% and up to 30% in MCF-10A cells (Fig. 4d). The effect of TIMBD on expression of c-Myc and cyclin D1 was comparable to that of HPIMBD [30].
Fig. 4. TIMBD inhibits mRNA and protein expression levels of c-Myc and cyclin D1 in breast cancer cells.
a) MCF-7, T47D and MDA-MB-231 cells were treated with vehicle (DMSO) or 50 μM Res or TIMBD for 24 hours. Total RNA was isolated and reverse transcribed to cDNA. Real-time quantitative PCR was performed to analyze the expression of cyclophilin and c-Myc mRNA. mRNA expression levels of c-Myc and cyclophilin were determined as described in the Materials and Methods section. Each experiment was performed in quadruplicate and the data are expressed as fold change + SEM relative to control.
b) MCF-10A and breast cancer cell lines were treated with either vehicle (DMSO) or 50 μM Res or TIMBD for up to 72 hours. Proteins were isolated and western blot analyses were performed. Intensities of the bands were quantified and normalized to α-tubulin. Fold changes in c-Myc protein expression (Mean ± SEM) treated with TIMBD compared to vehicle-treated controls were calculated from four individual experiments and the mean values are given at the top of each blot. The vertical lines in the boxes indicate that intervening lanes have been removed. Each individual western blot panel compares signals from protein samples loaded on the same gel.
c) MCF-7, T47D and MDA-MB-231 cells were treated with vehicle (DMSO) or 50 μM Res or TIMBD for 24 hours. Total RNA was isolated and reverse transcribed to cDNA. Real-time quantitative PCR was performed to analyze the expression of cyclophilin and cyclin D1 mRNA. Expression of cyclin D1 mRNA was determined as described in the Materials and Methods section. Each experiment was performed in quadruplicate and the data are expressed as fold change ± SEM relative to control.
d) MCF-10A and breast cancer cell lines were treated with either vehicle (DMSO) or 50 μM Res or TIMBD for up to 72 hours. Proteins were isolated and western blot analyses were performed. Intensities of the bands were quantified and normalized to α-tubulin. Fold changes in cyclin D1 protein expression (Mean ± SEM) treated with TIMBD compared to vehicle-treated controls were calculated from four individual experiments and the mean values are given at the top of each blot. The vertical lines in the boxes indicate that intervening lanes have been removed. Each individual western blot panel compares signals from protein samples loaded on the same gel.
(*) indicates a P value <0.05 compared to respective controls.
TIMBD induces protein expression levels of tumor suppressor genes, p53 and p21, in MCF-7 breast cancer cells
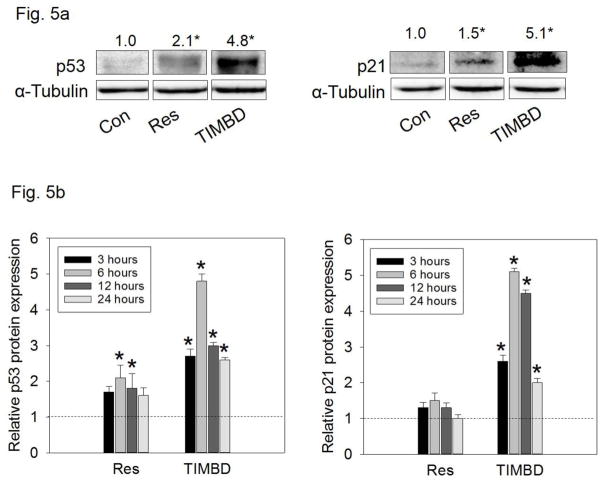
In order to assess the effect of Res analog TIMBD on p53 and p21, MCF-7 cells, which express wild-type p53 [40], were treated with 50 μM TIMBD. TIMBD significantly induced protein expression levels of both p53 and p21 in MCF-7 breast cancer cells (Fig. 5a). TIMBD showed a significant induction of both p53 and p21 protein expression levels up to 5-fold (Fig. 5a). A time-course study showed significant induction in protein expression levels of p53 and p21 in MCF-7 cells up to 24 hours peaking at 6 hours (Fig. 5b). Compared to HPIMBD, which showed 2-fold induction in p53 and p21 [30], TIMBD showed a substantial increase up to 5-fold, supporting its better inhibitory potential.
Fig. 5. TIMBD induces protein expression levels of tumor suppressor genes p53 and p21 in MCF-7 breast cancer cells.
a) MCF-7 breast cancer cells were treated with vehicle (DMSO) or 50 μM Res or TIMBD. Proteins were isolated and western blot analyses were performed. Intensities of the bands were quantified and normalized to α-tubulin. Fold changes in p53 and p21 protein expression (Mean ± SEM) treated with TIMBD compared to vehicle-treated controls were calculated from four individual experiments and the mean values are given at the top of each blot. The vertical lines in the boxes indicate that intervening lanes have been removed. Each individual western blot panel compares signals from protein samples loaded on the same gel.
b) MCF-7 cells were treated with either vehicle (DMSO) or 50 μM Res or TIMBD up to 24 hours and a time-course study was performed. Proteins were isolated and western blot analyses were performed. Intensities of the bands were quantified and normalized to α-tubulin. The bar graph represents fold change in p53 or p21 protein expression levels (Mean ± SEM) in respective cell lines treated with Res or TIMBD compared to vehicle-treated controls.
(*) indicates a P value <0.05 compared to respective controls.
TIMBD inhibits protein expression of oncogene c-Myc in an ER-dependent fashion
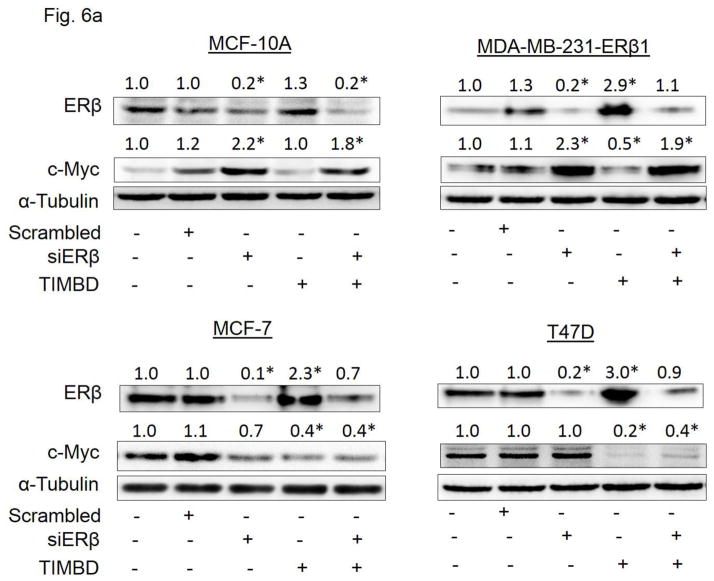
On lines similar to HPIMBD treatment reported previously [30], we investigated whether TIMBD inhibits c-Myc in an ERβ-dependent fashion. MCF-10A, ERβ1-transfected MDA-MB-231, MCF-7 and T47D cell lines were transfected with siERβ for 48 hours, followed by treatment with TIMBD for 12 hours (ERβ1-transfected MDA-MB-231), 24 hours (MCF-10A) or 48 hours (MCF-7 and T47D). The treatment time points with TIMBD are based on maximal induction time of ERβ for the respective cell lines following TIMBD treatment. Treatment with TIMBD following siERβ transfection failed to inhibit c-Myc protein expression in MCF-10A and ERβ1-transfected MDA-MB-231 cells, suggesting that inhibition of c-Myc occurs by an ERβ-dependent mechanism in these cells (Fig. 6a). However, this observation did not hold true for MCF-7 and T47D cells, suggesting that TIMBD may inhibit c-Myc in these two cell lines in an ERβ-independent fashion (Fig. 6a). This effect is most likely to happen via a direct inhibition of ERα as it has been reported that ERα regulates c-Myc expression in breast cells [41].
Fig. 6. TIMBD inhibits protein expression c-Myc in an ER-dependent fashion in breast cancer cells.
a) MCF-10A, ERβ1-transfected MDA-MB-231, MCF-7 and T47D cells were transfected with either 1 nmol/l of scrambled small interfering RNA or siERβ for 48 hours, and subsequently treated with 50 μM TIMBD for 12 hours (ERβ1-transfected MDA-MB-231), 24 hours (MCF-10A) or 48 hours (MCF-7 and T47D). The treatment time points are based on maximal induction time of ERβ for respective cell lines following TIMBD treatment. Proteins were isolated and western blot analyses were performed. Intensities of the bands were quantified and normalized to α-tubulin. Fold changes in ERβ or c-Myc protein expression (Mean ± SEM) treated with scrambled, siERβ or TIMBD compared to vehicle-controls were calculated from four individual experiments and the mean values are given at the top of each blot.
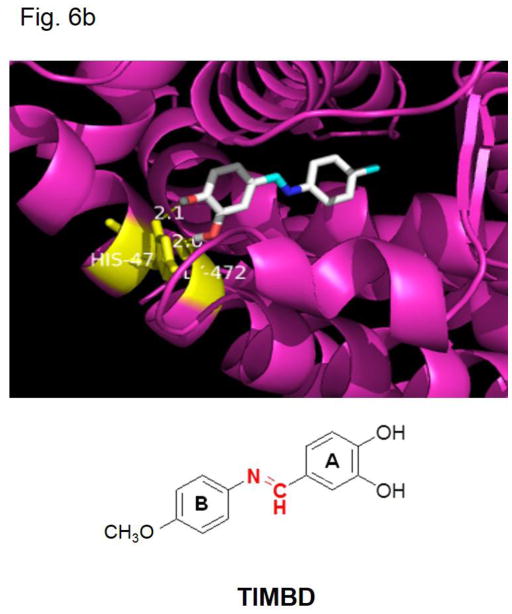
b) Binding of Resveratrol analog TIMBD into the active site of ERβ, as assessed by computer modeling studies.
(*) indicates a P value <0.05 compared to respective controls.
TIMBD binds ERβ with high affinity
Docking studies were carried out with TIMBD using protocols reported previously [29, 30]. TIMBD was found to dock into the active site of ERβ protein cavity with two hydrogen bonding interactions (Fig. 6b and Table 2). TIMBD exhibited a binding energy of −8.3 Kcal/mol in ERβ protein cavity. The vicinal hydroxyl groups of TIMBD were found to interact with GLY472 (2.0 Å) and HIS475 (2.1 Å) via hydrogen bonding in the ERβ cavity. TIMBD showed binding energy and hydrogen bonding interactions comparable to Res which has been reported previously (Table 2) [30].
Table 2.
Docking results and consensus scores of Resveratrol analog TIMBD
| Chemical | Binding Energy (Kcal/mole) | Hydrogen bonding residues | Bond distance (A0) | No. of Hydrogen bonds |
|---|---|---|---|---|
| Resveratrol | −8.2 | GLY472 GLU305 ARG346 |
2.0 2.2 and 2.3 2.3 |
4 |
| TIMBD | −8.3 | GLY472, HIS475 | 2.0, 2.1 | 2 |
TIMBD partially inhibits proliferation of MDA-MB-231-ERβ transfected cell line in an ERβ dependent fashion
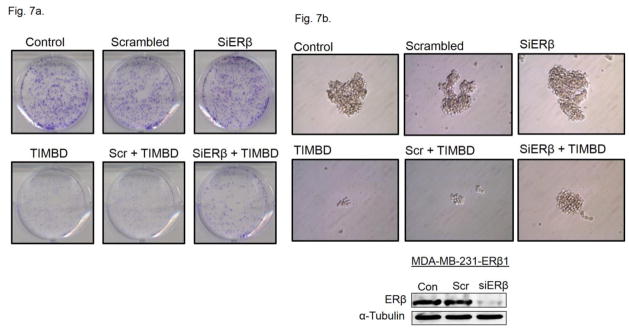
Colony formation and mammosphere formation assays were carried out in MDA-MB-231-ERβ cell line in order to study the role of ERβ in inhibition of cellular proliferation by TIMBD. MDA-MB-231-ERβ cells were transfected with siERβ for 48 hours followed by treatment with TIMBD for 12 hours. Silencing ERβ partially restored the colony and mammosphere forming ability of cells treated with TIMBD (Fig. 7a and b). This suggests that TIMBD may have multiple molecular targets such that even if ERβ is silenced, other potential targets may compensate for the inhibitory effect.
Fig. 7. TIMBD partially inhibits proliferation of MDA-MB-231-ERβ transfected cell line in an ERβ-dependent fashion.
a) MDA-MB-231-ERβ cells were seeded in 6-well plates and were transfected with siRNA for ERβ followed by treatment with TIMBD or vehicle for 12 hours. After treatment, cells were incubated for an additional 8 days in fresh complete medium. The colonies obtained were fixed in methanol and stained with crystal violet solution. Three replicates were performed for each treatment group and representative pictures for each treatment group are shown.
b) MDA-MB-231-ERβ transfected cells were seeded into 24-well plates and mammosphere assays were performed. Cells were grown in serum-free medium supplemented with growth factors as mentioned in Materials and Methods section. Cells were treated with TIMBD or vehicle control and the mammospheres formed were viewed under the microscope and photographed [25, 27, 30]. Three replicate wells from a 24-well plate were used for each experimental condition and representative pictures for each treatment group are shown. Western blot for ERβ after siRNA transfection is also presented to demonstrate that ERβ protein expression was decreased following siERβ transfection.
TIMBD inhibits proliferation of both MDA-MB-231 and ERα-transfected MDA-MB-231 cells
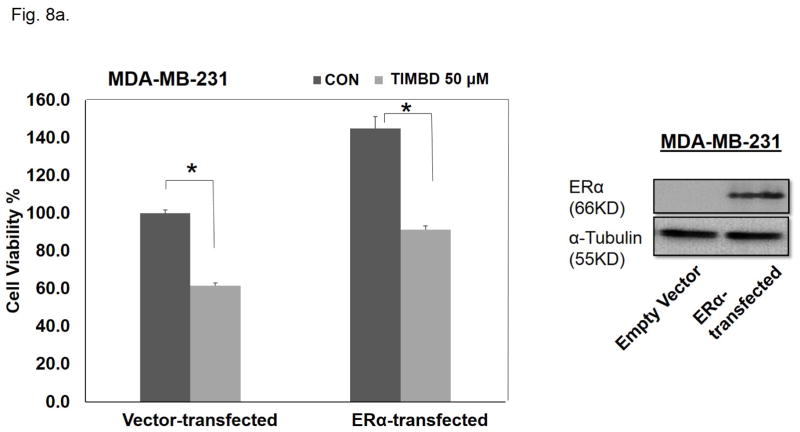
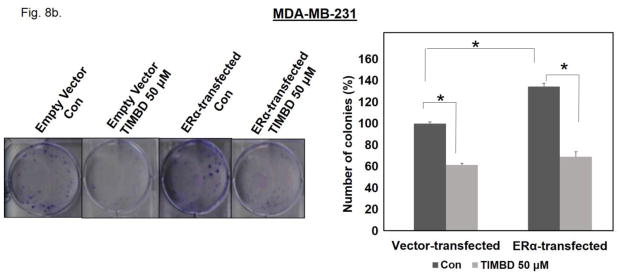
We also assessed the effect of ERα expression in an ERα-negative cell line on TIMBD’s inhibitory properties. MTT proliferation and colony formation assays were performed on MDA-MB-231 cells transiently transfected with either ERα or empty vector plasmids. Following transfection, cells were treated with 50 μM TIMBD for an additional 48 hours. Expression of ERα in MDA-MB-231 cells increased proliferation by 31% compared to vector-only-transfected cells as determined by MTT assays (Fig. 8a). A similar increase of 34.6% in number of colonies was observed in ERα-transfected MDA-MB-231 cells compared to vector-transfected cells (Fig. 8b). TIMBD treatment resulted in 38.5% inhibition in vector-only-transfected and 37% inhibition in ERα-transfected MDA-MB-231 cells when compared to respective vehicle controls of the same cell type in MTT proliferation assays (Fig. 8a). Colony formation data showed a 55.4% and 48.3% inhibition in number of colonies of TIMBD treated ERα-transfected and vector-transfected MDA-MB-231 cells, respectively, compared to vehicle-treated controls of the same cell type (Fig. 8b).
Fig. 8. TIMBD is equally effective in inhibiting the proliferation of MDA-MB-231 and ERα-transfected MDA-MB-231 cells.
a) MDA-MB-231 cells were transiently transfected with ERα and empty-vector plasmids using Lipofectamine 2000 transfection reagent for 48 hours in 6-well plates. Following transfection, cells were re-plated in 96-well plates and treated with 50 μM TIMBD or vehicle control for additional 48 hours. MTT assays were performed as described in Materials and Methods section. Three replicate wells were used for each experimental condition. Western blot for ERα expression in MDA-MB-231 cells following transfection is included to demonstrate that ERα protein expression was increased following ERα transfection.
b) MDA-MB-231-ERα or vector-transfected cells were seeded in 6-well plates followed by treatment with TIMBD or vehicle for 48 hours. After treatment, cells were incubated for an additional 8 days in a complete medium. The colonies obtained were fixed in methanol and stained with crystal violet solution. Three replicates were performed for each treatment group and representative pictures are shown. Resulting colonies were counted and the bar graph represents the % colonies formed (Mean ± SEM) relative to respective vehicle-treated controls of the same cell type.
(*) indicates a P value <0.05 compared to respective controls.
Discussion
A logical approach to overcoming poor bioavailability and lack of specificity of Res is to modify the chemical structure of Res and use alternative pharmacophoric groups in accordance with structure activity relationship studies [29]. Various analogs with hydroxy-, acetate-, methyl, methoxy-, fluoro-, and methyl ether- substituents have been synthesized and tested for their effects in various cancer cell lines [42]. For example, Res analogs with 3,4-dihydroxy substituents on A-ring have shown the most potent apoptosis inducing properties [43,44]. Thus, the azaresveratrol analogs were synthesized in such a way that the 3,4-dihydroxy substitution was maintained and aza functionality was introduced to make the compound resistant to metabolism [29].
Among the six synthesized analogs, TIMBD demonstrated better potency than Res and any other analog, in selectively inhibiting the growth of breast cancer cells [29, 30]. We have previously shown that the other active analog, HPIMBD, showed differential regulation of ERs in breast cancer cells [30]. In this study, we have demonstrated that TIMBD also shows differential regulation of ERs. TIMBD induces mRNA and protein expression levels of ERβ and inhibits that of ERα. TIMBD also inhibits mRNA and protein expression levels of oncogene c-Myc and cyclin D1, which regulates the cell cycle, suggesting that affecting cell cycle regulators may be one mechanism of inhibition of cellular proliferation by TIMBD (Fig. 4). TIMBD also induces the protein expression levels of the tumor suppressor proteins p53 and p21 (Fig. 5). P53 induction suggests that TIMBD treatment may lead to cell cycle arrest/apoptosis in cells that express wild-type p53, such as MCF-7 cells. However, all other cell lines, except MCF-7 and MCF-10A, express mutant forms of p53, suggesting that there are other potential targets that result in TIMBD’s inhibition of cancer cells. Next, we wanted to dissect the mechanistic pathway linking changes in estrogen receptor expression to cellular proliferation. To determine if the effect on inhibition of c-Myc was a result of differential regulation of ERs, we silenced ERβ in ERα-positive and negative cells followed by treatments with TIMBD (Fig. 6a). TIMBD was not able to inhibit the protein expression of c-Myc in the absence of ERβ (Fig. 6a) suggesting that ERβ may play an important role in inhibition of c-Myc and thus breast cancer cell proliferation by TIMBD. However, this effect of ERβ was observed in MCF-10A and ERβ1-transfected MDA-MB-231 cell lines but not in ERα expressing MCF-7 and T47D cells, suggesting that the regulation of c-Myc in ERα-positive cells occurs in an ERβ-independent fashion (Fig. 6a). To show that the effect on inhibition of c-Myc could translate to inhibition of cellular proliferation, colony formation and mammosphere assays were performed. However, unlike the significant results seen in terms of c-Myc expression, results from colony formation and mammosphere assays suggested a partial role for ERβ in TIMBD’s inhibition. Silencing ERβ followed by TIMBD treatment in MDA-MB-231-ERβ cells did not significantly affect the number of colonies but affected the size of colonies formed and thus, intensity of crystal violet staining (Fig. 7a). Mammosphere data showed that silencing ERβ was only partially able to rescue cells from inhibition by TIMBD (Fig. 7b). This suggests that there may be other mechanisms through which TIMBD is able to inhibit proliferation in the absence of ERβ, which is evident from our studies that have shown multiple molecular targets for TIMBD. Also, being an analog of Res, which itself has multiple molecular targets, TIMBD’s multiple pathway regulation in cells was not unexpected. Next, we studied the role of ERα in TIMBD’s inhibitory mechanism. Transient transfection of MDA-MB-231 cells with ERα increased the proliferation of MDA-MB-231 cells compared to vector-controls. Treatment of both vector and ERα-transfected cells with TIMBD resulted in proportionally equal inhibition of proliferation compared to vehicle-treated controls of the same cell type in MTT assays. A similar experiment done using colony formation assay resulted in 7% decrease in inhibition by TIMBD of ERα-transfected compared to vector-transfected MDA-MB-231 cells. This result suggests that overexpression of ERα did not significantly affect the extent of inhibition by TIMBD. Docking of TIMBD in the ERβ protein cavity showed comparable binding interactions as shown by the parent compound Res (Fig. 6b and Table 2). TIMBD (binding energy −8.3 Kcal/Mol) showed two hydrogen bonding interactions (GLY472 and HIS475) in ERβ protein cavity when compared to Res (binding energy −8.2 Kcal/Mol) which showed three hydrogen bonding interactions in the cavity. Taken together, our studies indicate that, TIMBD, a novel analog of Res, differentially regulates expressions of ERs α and β and cellular proliferation markers in breast cancer cells. Regulation of ERs may be an important mechanism for inhibition of cancer cell growth. TIMBD may thus be potentially useful in the therapy and/or prevention of breast cancers.
Supplementary Material
Highlights.
Resveratrol analog TIMBD inhibits growth of breast cancer cells
TIMBD induces protein expression levels of ERβ and inhibits that of ERα
TIMBD inhibits c-Myc and cyclin D1, and induces p53 and p21
TIMBD suppresses c-Myc in an ER-dependent fashion
Acknowledgments
This work was supported by the National Institutes of Health Grant (CA 109551), the University of Missouri Research Board Grant, and financial support from the School of Pharmacy, University of Missouri-Kansas City (HKB). This manuscript contains some portions of the figures and text, specifically, data for vehicle control and Res treatments, that have been published in the Journal of Steroid Biochemistry and Molecular Biology by Ronghe et. 2014 and are included in the current manuscript with permission from the publisher.
Footnotes
Conflict of Interest Statement:
All authors declare that they have no conflicts of interest with the contents in this article with respect to third party financial support, financial relationships, sources of revenue, sponsor interactions, patents or other affiliations.
Publisher's Disclaimer: This is a PDF file of an unedited manuscript that has been accepted for publication. As a service to our customers we are providing this early version of the manuscript. The manuscript will undergo copyediting, typesetting, and review of the resulting proof before it is published in its final citable form. Please note that during the production process errors may be discovered which could affect the content, and all legal disclaimers that apply to the journal pertain.
References
- 1.Mense SM, Hei TK, Ganju RK, Bhat HK. Phytoestrogens and breast cancer prevention: possible mechanisms of action. Environ Health Perspect. 2008;116:426–33. doi: 10.1289/ehp.10538. [DOI] [PMC free article] [PubMed] [Google Scholar]
- 2.Adlercreutz H. Phytoestrogens: epidemiology and a possible role in cancer protection. Environ Health Perspect. 1995;103:103–12. doi: 10.1289/ehp.95103s7103. [DOI] [PMC free article] [PubMed] [Google Scholar]
- 3.Adlercreutz H. Phytoestrogens and breast cancer. J Steroid Biochem Mol Biol. 2002;83:113–8. doi: 10.1016/s0960-0760(02)00273-x. [DOI] [PubMed] [Google Scholar]
- 4.Ursin G, Bernstein L, Pike MC. Breast Cancer. Cancer Surv. 1994;19–20:241–64. [PubMed] [Google Scholar]
- 5.Le Corre L, Chalabi N, Delort L, Bignon YJ, Bernard-Gallon DJ. Resveratrol and Breast Cancer Chemoprevention: Molecular Mechanisms. Mol Nutr Food Res. 2005;49:462–71. doi: 10.1002/mnfr.200400094. [DOI] [PubMed] [Google Scholar]
- 6.Adlercreutz H. Epidemiology of Phytoestrogens. Baillieres Clin Endocrinol Metab. 1998;12:605–23. doi: 10.1016/s0950-351x(98)80007-4. [DOI] [PubMed] [Google Scholar]
- 7.Carter LG, D’Orazio JA, Pearson KJ. Resveratrol and cancer: focus on in vivo evidence. Endocr Relat Cancer. 2014;21:R209–25. doi: 10.1530/ERC-13-0171. [DOI] [PMC free article] [PubMed] [Google Scholar]
- 8.Signorelli P, Ghidoni R. Resveratrol as an anticancer nutrient: molecular basis, open questions and promises. J Nutr Biochem. 2005;16:449–66. doi: 10.1016/j.jnutbio.2005.01.017. [DOI] [PubMed] [Google Scholar]
- 9.Bowers JL, Tyulmenkov VV, Jernigan SC, Klinge 403CM. Resveratrol acts as a mixed agonist/antagonist for estrogen receptors alpha and beta. Endocrinology. 2000;141:3657–67. doi: 10.1210/endo.141.10.7721. [DOI] [PubMed] [Google Scholar]
- 10.Milani A, Geuna E, Mittica G, Valabrega G. Overcoming endocrine resistance in metastatic breast cancer: Current evidence and future directions. World J Clin Oncol. 2014;5:990–1001. doi: 10.5306/wjco.v5.i5.990. [DOI] [PMC free article] [PubMed] [Google Scholar]
- 11.Singh B, Bhat NK, Bhat HK. Partial inhibition of estrogen-induced mammary carcinogenesis in rats by tamoxifen: balance between oxidant stress and estrogen responsiveness. Plos One. 2011;6:e25125. doi: 10.1371/journal.pone.0025125. [DOI] [PMC free article] [PubMed] [Google Scholar]
- 12.De Amicis F, Giordano F, Vivacqua A, Pellegrino M, Panno ML, Tramontano D, Fuqua SA, Ando S. Resveratrol, through NF-Y/p53/Sin3/HDAC1 complex phosphorylation, inhibits estrogen receptor alpha gene expression via p38MAPK/CK2 signaling in human breast cancer cells. FASEB J. 2011;25:3695–707. doi: 10.1096/fj.10-178871. [DOI] [PMC free article] [PubMed] [Google Scholar]
- 13.Moutsatsou P. The spectrum of phytoestrogens in nature: our knowledge is expanding. Hormones (Athens) 2007;6(3):173–93. [PubMed] [Google Scholar]
- 14.An J, Tzagarakis-Foster C, Scharschmidt TC, Lomri N, Leitman DC. Estrogen Receptor Beta-Selective Transcriptional Activity and Recruitment of Coregulators by Phytoestrogens. J Biol Chem. 2001;276:17808–14. doi: 10.1074/jbc.M100953200. [DOI] [PubMed] [Google Scholar]
- 15.Aggarwal BB, Bhardwaj A, Aggarwal RS, Seeram NP, Shishodia S, Takada Y. Role of resveratrol in prevention and therapy of cancer: preclinical and clinical studies. Anticancer Res. 2004;24:2783–840. [PubMed] [Google Scholar]
- 16.Aiyer HS, Warri AM, Woode DR, Hilakivi-Clarke L, Clarke R. Influence of berry polyphenols on receptor signaling and cell-death pathways: implications for breast cancer prevention. J Agric Food Chem. 2012;60:5693–708. doi: 10.1021/jf204084f. [DOI] [PMC free article] [PubMed] [Google Scholar]
- 17.Williams C, Edvardsson K, Lewandowski SA, Strom A, Gustafsson JA. A genome-wide study of the repressive effects of estrogen receptor beta on estrogen receptor alpha signaling in breast cancer cells. Oncogene. 2008;27:1019–32. doi: 10.1038/sj.onc.1210712. [DOI] [PubMed] [Google Scholar]
- 18.Gehm BD, McAndrews JM, Chien PY, Jameson JL. Resveratrol, a Polyphenolic Compound Found in Grapes and Wine, Is an Agonist for the Estrogen Receptor. Proc Natl Acad Sci USA. 1997;94:14138–43. doi: 10.1073/pnas.94.25.14138. [DOI] [PMC free article] [PubMed] [Google Scholar]
- 19.Nakagawa H, Kiyozuka Y, Uemura Y, Senzaki H, Shikata N, Hioki K, Tsubura A. Resveratrol inhibits human breast cancer cell growth and may mitigate the effect of linoleic acid, a potent breast cancer cell stimulator. J Cancer Res Clin Oncol. 2001;127:258–64. doi: 10.1007/s004320000190. [DOI] [PMC free article] [PubMed] [Google Scholar]
- 20.Pozo-Guisado E, Merino JM, Mulero-Navarro S, Lorenzo-Benayas MJ, Centeno F, Alvarez-Barrientos A, Fernandez-Salguero PM. Resveratrol-Induced Apoptosis in Mcf-7 Human Breast Cancer Cells Involves a Caspase- Independent Mechanism with Downregulation of Bcl-2 and Nf-Kappab. Int J Cancer. 2005;115:74–84. doi: 10.1002/ijc.20856. [DOI] [PubMed] [Google Scholar]
- 21.Pozo-Guisado E, Alvarez-Barrientos A, Mulero-Navarro S, Santiago-Josefat B, Fernandez-Salguero PM. The Antiproliferative Activity of Resveratrol Results in Apoptosis in Mcf-7 but Not in Mda-Mb-231 Human Breast Cancer Cells: Cell-Specific Alteration of the Cell Cycle. Biochem Pharmacol. 2002;64:1375–86. doi: 10.1016/s0006-2952(02)01296-0. [DOI] [PubMed] [Google Scholar]
- 22.Singh B, Shoulson R, Chatterjee A, Ronghe A, Bhat NK, Dim DC, Bhat HK. Resveratrol inhibits estrogen-induced breast carcinogenesis through induction of NRF2-mediated protective pathways. Carcinogenesis. 2014;35:1872–80. doi: 10.1093/carcin/bgu120. [DOI] [PMC free article] [PubMed] [Google Scholar]
- 23.Banerjee S, Bueso-Ramos C, Aggarwal BB. Suppression of 7,12-dimethylbenz(a)anthracene-induced mammary carcinogenesis in rats by resveratrol: role of nuclear factor-kappaB, cyclooxygenase 2, and matrix metalloprotease 9. Cancer Res. 2002;62:4945–54. [PubMed] [Google Scholar]
- 24.Bhat KP, Lantvit D, Christov K, Mehta RG, Moon RC, Pezzuto JM. Estrogenic and antiestrogenic properties of resveratrol in mammary tumor models. Cancer Res. 2001;61:7456–63. [PubMed] [Google Scholar]
- 25.Garvin S, Ollinger HK, Dabrosin C. Resveratrol Induces Apoptosis and Inhibits Angiogenesis in Human Breast Cancer Xenografts in Vivo. Cancer Lett. 2006;231:113–22. doi: 10.1016/j.canlet.2005.01.031. [DOI] [PubMed] [Google Scholar]
- 26.Lincoln DW, Tsan MF. Effect of resveratrol on growth of 4T1 breast cancer cells in vitro and in vivo. Biochem Biophys Res Commun. 2002;291:1001–5. doi: 10.1006/bbrc.2002.6554. [DOI] [PubMed] [Google Scholar]
- 27.Goldberg DM, Yan J, Soleas GJ. Absorption of three wine-related polyphenols in three different matrices by healthy subjects. Clin Biochem. 2003;36:79–87. doi: 10.1016/s0009-9120(02)00397-1. [DOI] [PubMed] [Google Scholar]
- 28.Walle T. Bioavailability of resveratrol. Ann N Y Acad Sci. 2011;1215:9–15. doi: 10.1111/j.1749-6632.2010.05842.x. [DOI] [PubMed] [Google Scholar]
- 29.Siddiqui A, Dandawate P, Rub R, Padhye S, Aphale S, Moghe A, Jagyasi A, Venkateswara Swamy K, Singh B, Chatterjee A, Ronghe A, Bhat HK. Novel Aza-resveratrol analogs: synthesis, characterization and anticancer activity against breast cancer cell lines. Bioorg Med Chem Lett. 2013;23:635–40. doi: 10.1016/j.bmcl.2012.12.002. [DOI] [PubMed] [Google Scholar]
- 30.Ronghe A, Chatterjee A, Singh B, Murphy L, Dandawate P, Padhye S, Bhat NK, Bhat HK. Differential regulation of estrogen receptors α and β by 4-(E)-{(4-hydroxyphenylimino)-methylbenzene, 1,2-diol}, a novel resveratrol analog. J Steroid Biochem Mol Biol. 2014;144:500–12. doi: 10.1016/j.jsbmb.2014.09.015. [DOI] [PMC free article] [PubMed] [Google Scholar]
- 31.Singh B, Bhat HK. Superoxide dismutase 3 is induced by antioxidants, inhibits oxidative DNA damage and is associated with inhibition of estrogen-induced breast cancer. Carcinogenesis. 2012;33:2601–10. doi: 10.1093/carcin/bgs300. [DOI] [PMC free article] [PubMed] [Google Scholar]
- 32.Singh B, Chatterjee A, Ronghe AM, Bhat NK, Bhat HK. Antioxidant-mediated up-regulation of OGG1 via NRF2 induction is associated with inhibition of oxidative DNA damage in estrogen-induced breast cancer. BMC Cancer. 2013;13:253. doi: 10.1186/1471-2407-13-253. [DOI] [PMC free article] [PubMed] [Google Scholar]
- 33.Singh B, Ronghe AM, Chatterjee A, Bhat NK, Bhat HK. MicroRNA-93 regulates NRF2 expression and is associated with breast carcinogenesis. Carcinogenesis. 2013;34:1165–72. doi: 10.1093/carcin/bgt026. [DOI] [PMC free article] [PubMed] [Google Scholar]
- 34.Singh B, Bhat NK, Bhat HK. Induction of NAD(P)H-quinone oxidoreductase 1 by antioxidants in female ACI rats is associated with decrease in oxidative DNA damage and inhibition of estrogen-induced breast cancer. Carcinogenesis. 2012;33:156–63. doi: 10.1093/carcin/bgr237. [DOI] [PMC free article] [PubMed] [Google Scholar]
- 35.Singh B, Mense SM, Remotti F, Liu X, Bhat HK. Antioxidant butylated hydroxyanisole inhibits estrogen-induced breast carcinogenesis in female ACI rats. J Biochem Mol Toxicol. 2009;23:202–11. doi: 10.1002/jbt.20281. [DOI] [PMC free article] [PubMed] [Google Scholar]
- 36.Chatterjee A, Ronghe A, Singh B, Bhat NK, Chen J, Bhat HK. Natural antioxidants exhibit chemopreventive characteristics through the regulation of CNC b-Zip transcription factors in estrogen-induced breast carcinogenesis. J Biochem Mol Toxicol. 2014;28:529–38. doi: 10.1002/jbt.21594. [DOI] [PMC free article] [PubMed] [Google Scholar]
- 37.Singh B, Mense SM, Bhat NK, Putty S, Guthiel WA, Remotti F, Bhat HK. Dietary quercetin exacerbates the development of estrogen-induced breast tumors in female ACI rats. Toxicol Appl Pharmacol. 2010;247:83–90. doi: 10.1016/j.taap.2010.06.011. [DOI] [PMC free article] [PubMed] [Google Scholar]
- 38.Bhat HK, Vadgama JV. Role of estrogen receptor in the regulation of estrogen induced amino acid transport of System A in breast cancer and other receptor positive tumor cells. Int J Mol Med. 2002;9:271–79. [PubMed] [Google Scholar]
- 39.Wong SC, Chan JK, Lee KC, Hsiao WL. Differential expression of p16/p21/p27 and cyclin D1/D3, and their relationships to cell proliferation, apoptosis, and tumour progression in invasive ductal carcinoma of the breast. The Journal of Pathology. 2001;194:35–42. doi: 10.1002/path.838. [DOI] [PubMed] [Google Scholar]
- 40.Polotskaia A, Hoffman S, Krett NL, Shanmugam M, Rosen ST, Bargonetti J. 8-Amino-adenosine activates p53-independent cell death of metastatic breast cancers. Mol Cancer Ther. 2012;11:2495–504. doi: 10.1158/1535-7163.MCT-12-0085. [DOI] [PMC free article] [PubMed] [Google Scholar]
- 41.Wang C, Mayer JA, Mazumdar A, Fertuck K, Kim H, Brown M, Brown PH. Estrogen induces c-myc gene expression via an upstream enhancer activated by the estrogen receptor and the AP-1 transcription factor. Mol Endocrinol. 2011;25:1527–38. doi: 10.1210/me.2011-1037. [DOI] [PMC free article] [PubMed] [Google Scholar]
- 42.Fulda S. Resveratrol and derivatives for the prevention and treatment of cancer. Drug Discov Today. 2010;15:757–65. doi: 10.1016/j.drudis.2010.07.005. [DOI] [PubMed] [Google Scholar]
- 43.Roberti M, Pizzirani D, Simoni D, Rondanin R, Baruchello R, Bonora C, Buscemi F, Grimaudo S, Tolomeo M. Synthesis and biological evaluation of resveratrol and analogues as apoptosis-inducing agents. J Med Chem. 2003;46:3546–54. doi: 10.1021/jm030785u. [DOI] [PubMed] [Google Scholar]
- 44.Cai YJ, Wei QY, Fang JG, Yang L, Liu ZL, Wyche JH, Han Z. The 3,4-dihydroxyl groups are important for trans-resveratrol analogs to exhibit enhanced antioxidant and apoptotic activities. Anticancer Res. 2004;24:999–1002. [PubMed] [Google Scholar]
Associated Data
This section collects any data citations, data availability statements, or supplementary materials included in this article.


