

Abstract
Cortical surface atlases, equipped with anatomically and functionally defined parcellations, are of fundamental importance in neuroimaging studies. Typically, parcellations of surface atlases are derived based on the sulcal-gyral landmarks, which are extremely variable across individuals and poorly matched with microstructural and functional boundaries. Cortical developmental trajectories in infants reflect underlying changes of microstructures, which essentially determines the molecular organization and functional principles of the cortex, thus allowing better definition of developmentally, microstructurally, and functionally distinct regions, compared to conventional sulcal-gyral landmarks. Accordingly, a parcellation of infant cortical surface atlas was proposed, based on the developmental trajectories of cortical thickness in infants, revealing regional patterning of cortical growth. However, cortical anatomy is jointly characterized by biologically-distinct, multidimensional cortical attributes, i.e., cortical thickness, surface area, and local gyrification, each with its distinct genetic underpinning, cellular mechanism, and developmental trajectories. To date, the parcellations based on the development of surface area and local gyrification is still missing. To bridge this critical gap, for the first time, we parcellate an infant cortical surface atlas into distinct regions based solely on developmental trajectories of surface area and local gyrification, respectively. For each cortical attribute, we first nonlinearly fuse the subject-specific similarity matrices of vertices' developmental trajectories of all subjects into a single matrix, which helps better capture common and complementary information of the population than the conventional method of simple averaging of all subjects' matrices. Then, we perform spectral clustering based on this fused matrix. We have applied our method to parcellate an infant surface atlas using the developmental trajectories of surface area and local gyrification from 35 healthy infants, each with up to 7 time points in the first two postnatal years, revealing biologically more meaningful growth patterning than the conventional method.
Keywords: Surface area, local gyrification, infant, atlas, parcellation
1 Introduction
Magnetic resonance imaging (MRI) allows for an unparalleled in vivo study of early dynamic development of the human brain. In MRI studies, cortical surface atlases, encoding anatomical structures and other reference information of the cortex, play fundamental roles in normalization, analysis, visualization, and comparison of results across subjects and studies [1]. Parcellations, defined in cortical surface atlases, help localize structural and functional regions, and partition individuals into regions of interest (ROIs), for region-based and network-based analyses [2]. Typically, these parcellations are defined based on sulcal-gyral landmarks [2], which are actually extremely variable across individuals and poorly matched with microstructurally, functionally, and developmentally defined boundaries [3]. Therefore, there is increasing interest to parcellate surface atlases into distinct regions based on other sources of information, e.g., the functional connectivity derived from fMRI [4] and the genetic correlation of surface area and cortical thickness derived from twin MRI studies [5]. However, owing to the dynamic development of cortical size, shape and folding in early postnatal stages, existing surface atlases and their parcellations created for adult brains are not suitable for infant brain studies [6]. For precise charting dynamic developmental trajectories of infant brains, the infant-dedicated surface atlases with parcellations, based on cortical developmental trajectories, are more appropriate. This is because cortical developmental trajectories in infants reflect underlying changes of microstructures, which essentially determine molecular organization and functional principles of the cortex [3], thus allowing for better definition of developmentally, microstructurally, and functionally distinct regions on surface atlases, compared to conventional sulcal-gyral landmarks. Accordingly, the first infant surface atlas, equipped with a parcellation based solely on the developmental trajectories of cortical thickness, has been recently created, revealing intriguing and meaningful regional patterning of cortical development [6].
Although promising, the parcellation based on cortical thickness trajectories has two major limitations. First, cortical thickness only reflects one aspect of the multidimensional nature of the cortex. Essentially, cortical structural development is jointly characterized by biologically-distinct, multidimensional cortical attributes, i.e., cortical thickness, surface area, and local gyrification, each with its distinct genetic underpinning, cellular mechanism, and developmental trajectories [7–9]. For example, in the first postnatal year, the cortex increases 31% in cortical thickness, 76% in surface area [8], and 17% in local gyrification [9]. Moreover, these cortical attributes are differently correlated with cognitive functioning, and differentially affected in a variety of brain disorders [8]. To date, parcellations of infant cortical surface atlases based on the developmental trajectories of surface area and local gyrification are still critically missing. Second, the existing method simply averages the subject-specific similarity matrices of vertices' developmental trajectories of all individuals as a population-mean similarity matrix for parcellation [6]; however, it ignores remarkable individual variability in terms of growth patterns and uneven distribution of time points, thus failing to fully capture common and complementary information of individuals.
In this paper, we unprecedentedly parcellate an infant cortical surface atlas into distinct regions, based on dynamic developmental trajectories of surface area and local gyrification in infants, respectively. To address the limitations of using population-mean similarity matrix for parcellation [6], we propose to first nonlinearly fuse the similarity matrices of vertices' developmental trajectories of all subjects into a single matrix and then perform spectral clustering based on this fused matrix. This strategy accounts for individual variability of growth patterns and the uneven distribution of time points, thus making full use of both common and complementary information across individuals. Based on 202 longitudinal MRI of 35 typical infants, each with up to 7 time points in the first two postnatal years, we reveal hitherto unseen, biologically meaningful surface atlas parcellations that capture the distinct patterns of developmental trajectories of surface area and local gyrification, respectively.
2 Method
2.1 Dataset and Cortical Surface Mapping
We adopted a longitudinal infant MRI dataset, including 35 healthy infants, each with up to 7 scans in the first two postnatal years [6]. For each infant, T1-, T2-, and diffusion-weighted MRI were acquired using a Siemens 3T head-only scanner every 3 months in the first year since birth, and then every 6 months in the second year. Any scans with strong motion effects, leading to poor quality of tissue segmentation, were discarded. T1 images were acquired with the parameters: TR/TE = 1900/4.38 ms, flip angle = 7, resolution = 1 × 1 × 1 mm3. T2 images were acquired with the parameters: TR/TE = 7380/119 ms, flip angle = 150, resolution = 1.25 × 1.25 × 1.95 mm3. Diffusion-weighted images (DWI) were acquired with the parameters: TR/TE = 7680/82 ms, resolution = 2 × 2 × 2 mm3, 42 non-collinear diffusion gradients, and diffusion weighting b =1000s/mm2. Data distribution included 8 infants each with 7 scans, 15 infants each with 6 scans, 8 infants each with 5 scans, and 4 infants each with 4 scans.
Infant cortical surfaces reconstruction and mapping were performed by an infant-dedicated computational pipeline [6]. Briefly, first, non-cerebral tissues were removed, and longitudinally-consistent tissue segmentation, using multimodal information of T1, T2 and FA images, were performed [10]. Second, each brain was divided into left and right hemispheres after filling of non-cortical structures. Third, inner and outer surfaces for each hemisphere were reconstructed by first tessellating the topology corrected white matter as a triangular mesh representation and then deforming the mesh using a deformable model [11]. Fourth, for each infant, all longitudinal inner surfaces were mapped to a standard sphere and groupwisely aligned to establish within-subject cortical correspondences and generate within-subject mean cortical folding using Spherical Demons [12]. Fifth, within-subject mean cortical folding maps of all subjects were groupwisely aligned to establish longitudinally-consistent inter-subject cortical correspondences, for construction of infant cortical surface atlases [6], and each surface was then resampled to a standard mesh tessellation. Finally, for each vertex of each resampled surface, both surface area (SA) and local gyrification index (LGI, Fig. 1(a)) were computed using an infant-specific method [9].
Fig. 1.
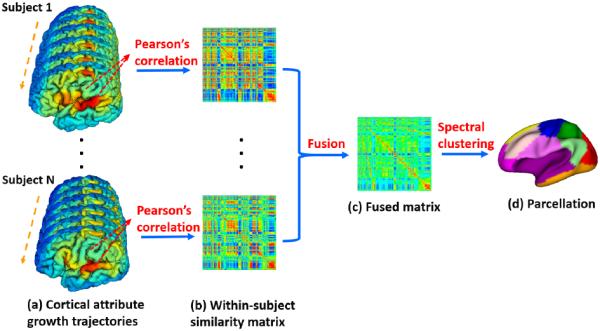
Flowchart of developmental trajectories based parcellation of infant surface atlases.
2.2 Atlas Parcellation Using Cortical Developmental Trajectories
To perform cortical surface atlas parcellation based on the developmental trajectories of cortical attributes, we adopted the spectral clustering method, which projects the data into the eigenspace of the similarity matrix (encoding the similarity between each pair of data points) to better capture distributions of original data points [13]. To this end, we first defined for each subject a subject-specific similarity matrix of the developmental trajectories for each cortical attribute (i.e., SA and LGI) between each pair of vertices in the surface atlas, using Pearson's correlation (Fig. 1(b)). Of note, as each subject had a different number and different temporal distribution of time points owing to missing scans, the subject-specific similarity matrix naturally solved this issue. For each cortical attribute of each subject, we computed its subject-specific similarity matrix As as: As(i, j) = (1 + rs(i, j))/2, where rs(i, j) is Pearson's correlation coefficient between the developmental trajectories of a cortical attribute between each pair of vertices i and j. One intuitive method to perform surface atlas parcellation is to first simply average similarity matrices of all subjects as a population-mean matrix and then perform spectral clustering based on this mean matrix [6]. This, however, ignores the remarkable individual variability in terms of growth patterns and scan distributions, thus failing to fully capitalize on both common and complementary information across individuals, leading to less meaningful parcellations.
To fully integrate both common and complementary information of individuals, we propose to first nonlinearly fuse their similarity matrices into a single matrix (Fig. 1(c)) and then perform spectral clustering based on this fused matrix (Fig. 1(d)). Our central idea was to iteratively update every matrix by diffusing information across subjects, making it more similar to others, until convergence [14]. To achieve this, for each subject-specific similarity matrix As, we first computed a full kernel matrix Ps and a sparse kernel matrix Ms respectively as:
| (1) |
Herein, Ps encoded full similarity information among vertices and Ms captured reliable, high-similarity neighbors for each vertex [14]. Ni represented K nearest neighbors of vertex i. Given N subjects, Ps of each subject at iteration t was then updated as: , s, k ∈ {1, …, N}. In this way, the isolated weak similarities disappeared, while the strong similarities were added to others. Meanwhile, the weak similarities supported by all matrices were retained, depending on their neighborhood connections across subjects. After T iterations, the fused matrix (average of all subjects' ) was used for parcellation based on spectral clustering.
3 Results
We performed developmental trajectories based surface atlas parcellation using surface area and local gyrification, by utilizing a total of 202 MRI scans from 35 healthy infants. In all results, we set K as 30 experimentally. The left panel of Fig. 2 shows the parcellation results based on the trajectories of surface area with different numbers of clusters from 2 to 12, using the proposed method of nonlinear fusion of individuals' similarity matrices, in comparison to simple averaging of individuals' similarity matrices [6]. For direct comparison with parcellations based on the trajectories of cortical thickness [6] and genetic correlation of surface area [5], we set the maximum cluster number as 12 as in [5, 6]. As shown, the proposed method led to biologically much more meaningful parcellations. For example, at 2-cluster parcellation, the proposed method revealed an anterior-posterior division to partition the unimodal motor, somatosensory, visual, and auditory cortices from the high-order prefrontal, inferior temporal, and insula cortices. In contrast, the averaging-based method grouped high-order frontal pole area with unimodal cortices, thus leading to less meaningful results. Of note, the anterior-posterior division revealed by the proposed method was generally consistent with the genetic patterning of surface area in adults [5]. More importantly, the proposed method revealed a naturally hierarchical organization of developmental patterning of surface area, in line with the findings of hierarchical organization of genetic patterning of surface area [5]. This means that, when increasing the cluster numbers, a new region is created largely without changing existing boundaries of parcellation. For example, the boundaries between the prefrontal cortex and motor cortex (indicated by the blue arrows) and the boundaries between visual cortex and temporal cortex (indicated by the green arrows) were well-preserved from 4-cluster to 12-cluster parcellation using the proposed method, while the corresponding boundaries, by the averaging-based method, were quite unstable across different numbers of clusters. In addition, as highlighted by the gray arrows, the cluster of the auditory cortex was well-preserved from 4-cluster to 12-cluster parcellation by the proposed method, whereas this cluster disappeared from 8-cluster to 10-cluster parcellation, when using the averaging-based method [6]. Moreover, as indicated by the red arrows, the averaging-based method led to many isolated fragments in its parcellations. To further verify the parcellation, we performed seed-based analysis as in [5, 6]. Specifically, for each of the 26 uniformly distributed seeds on the atlas, its correlation with all other vertices, based on the population mean correlation maps, was shown by a respective color-coded small surface map. As shown in Fig. 3(a), seeds in the same cluster yielded largely the similar correlation patterns, while seeds across the boundaries of clusters (purple curves) led to quite different patterns. For example, the seed in the cluster of the auditory cortex had a unique correlation map, in comparison with the nearby seeds, confirming the rationality of our parcellation.
Fig. 2.

Surface atlas parcellations based on the developmental trajectories of surface area (left panel) and local gyrification (right panel), respectively, by (a) and (c) fusion of individuals' similarity matrices, and (b) and (d) averaging of individuals' similarity matrices.
Fig. 3.

Seed-based analysis of population mean correlation patterns of (a) surface area developmental trajectories and (b) local gyrification developmental trajectories from 35 infants, for verifying the parcellations in Fig. 2. For each of 26 seeds, its correlations with all other verices are shown as a respective color-coded small surface map.
The right panel of Fig. 2 shows the surface atlas parcellations based on the developmental trajectories of local gyrification with different numbers of clusters. At 2-cluster parcellation, both methods identified a dorsal-ventral division to separate frontal and parietal cortices from temporal, insula, and visual cortices. However, with the number of clusters increasing, the proposed method revealed a more meaningful hierarchical organization of the developmental patterning of local gyrification. For example, the boundaries between prefrontal and insula cortices (green arrows), the boundaries between supramarginal gyrus and insula cortex (yellow arrows), and the boundaries between occipital and temporal cortices (blue arrows) were well-preserved from 4-cluster to 12-cluster parcellation by the proposed method, while the corresponding boundaries, by the averaging-based method, were quite variable across different numbers of clusters, showing unstableness of these clusters. As performed in verifying surface area based parcellation, we also performed seed-based analysis of the population mean correlation patterns of developmental trajectories of local gyrification, by using 26 uniformly distributed seeds on the atlas. As shown in Fig. 3(b), seeds in the same cluster yielded largely the similar correlation patterns, while seeds across the boundaries of clusters (purple curves) led to quite different patterns.
Fig. 4 shows a comparison of our parcellations with the parcellation based on genetic correlation of surface area of adults [5] and cortical thickness trajectories of infants [6]. In our 12-cluster parcellations based on developmental trajectories, all clusters largely corresponded to functional specializations, with their names provided in leftmost and rightmost columns. In general, surface area, local gyrification, and cortical thickness each exhibited distinct parcellation patterns based on its developmental trajectories, in line with the reports that each has distinct genetic underpinning, cellular mechanism, and developmental trajectories [7–9]. Interestingly, parcellations based on trajectories of surface area and local gyrification revealed several similar clusters, e.g., superior parietal (cluster 2), inferior parietal (cluster 3), and precuneus regions (cluster 6). In addition, parcellations based on trajectories of surface area and cortical thickness (Fig. 4(d)) [6] identified several similar clusters, e.g., perisylvian (cluster 4), visual (cluster 5), and medial temporal cortices (cluster 9). Moreover, several clusters in the parcellation based on trajectories of surface area and the genetic correlation of surface area (Fig. 4(c)) [5] appeared similar, e.g., visual (cluster 5), precuneus (cluster 6), and superior parietal cortices (cluster 2).
Fig. 4.

Comparison with parcellation based on genetic correlation of surface area of adult [5] and parcellation based on cortical thickness trajectories of infants [6].
4 Conclusion
This paper has two major contributions. First, based on the work in [6], we propose a novel method to parcellate surface atlases, using cortical developmental trajectories, through nonlinear fusion of individuals' similarity matrices, which better capitalizes on both common and complementary information across subjects. Second, leveraging this new method, we derived the first infant cortical surface atlas parcellations based solely on dynamic developmental trajectories of surface area and local gyrification, respectively, revealing their distinct and biologically meaningful growth patterning. As there is no ground truth for developmental trajectories based parcellations, we validate our results by 1) using existing neuroscience knowledge, 2) performing seed-based analysis, and 3) comparing with the results using the existing method. In the future work, we will investigate the different numbers of clusters in parcellations and find the optimal cluster number, according to silhouette coefficient [5]. We will further comprehensively and quantitatively compare our parcellations with existing parcellations [4–6], and apply them to early brain development studies. As each cortical attribute defines a distinct parcellation, to study a specific attribute, its corresponding parcellation would better be adopted, as this encodes unique growth patterning.
References
- 1.Van Essen DC, Dierker DL. Surface-based and probabilistic atlases of primate cerebral cortex. Neuron. 2007;56:209–225. doi: 10.1016/j.neuron.2007.10.015. [DOI] [PubMed] [Google Scholar]
- 2.Desikan RS, Segonne F, Fischl B, Quinn BT, Dickerson BC, Blacker D, Buckner RL, Dale AM, Maguire RP, Hyman BT, Albert MS, Killiany RJ. An automated labeling system for subdividing the human cerebral cortex on MRI scans into gyral based regions of interest. Neuroimage. 2006;31:968–980. doi: 10.1016/j.neuroimage.2006.01.021. [DOI] [PubMed] [Google Scholar]
- 3.Zilles K, Amunts K. TIMELINE Centenary of Brodmann's map - conception and fate. Nature Reviews Neuroscience. 2010;11:139–145. doi: 10.1038/nrn2776. [DOI] [PubMed] [Google Scholar]
- 4.Yeo BT, Krienen FM, Sepulcre J, Sabuncu MR, Lashkari D, Hollinshead M, Roffman JL, Smoller JW, Zollei L, Polimeni JR, Fischl B, Liu H, Buckner RL. The organization of the human cerebral cortex estimated by intrinsic functional connectivity. J. Neurophysiol. 2011;106:1125–1165. doi: 10.1152/jn.00338.2011. [DOI] [PMC free article] [PubMed] [Google Scholar]
- 5.Chen CH, Fiecas M, Gutierrez ED, Panizzon MS, Eyler LT, Vuoksimaa E, Thompson WK, Fennema-Notestine C, Hagler DJ, Jernigan TL, Jr., Neale MC, Franz CE, Lyons MJ, Fischl B, Tsuang MT, Dale AM, Kremen WS. Genetic topography of brain morphology. Proc. Natl. Acad. Sci. U. S. A. 2013;110:17089–17094. doi: 10.1073/pnas.1308091110. [DOI] [PMC free article] [PubMed] [Google Scholar]
- 6.Li G, Wang L, Shi F, Lin W, Shen D. Constructing 4D infant cortical surface atlases based on dynamic developmental trajectories of the cortex. Med. Image Comput. Comput. Assist. Interv. 2014;17:89–96. doi: 10.1007/978-3-319-10443-0_12. [DOI] [PMC free article] [PubMed] [Google Scholar]
- 7.Raznahan A, Shaw P, Lalonde F, Stockman M, Wallace GL, Greenstein D, Clasen L, Gogtay N, Giedd JN. How does your cortex grow? J. Neurosci. 2011;31:7174–7177. doi: 10.1523/JNEUROSCI.0054-11.2011. [DOI] [PMC free article] [PubMed] [Google Scholar]
- 8.Lyall AE, Shi F, Geng X, Woolson S, Li G, Wang L, Hamer RM, Shen D, Gilmore JH. Dynamic Development of Regional Cortical Thickness and Surface Area in Early Childhood. Cereb Cortex. 2014 doi: 10.1093/cercor/bhu027. [DOI] [PMC free article] [PubMed] [Google Scholar]
- 9.Li G, Wang L, Shi F, Lyall AE, Lin W, Gilmore JH, Shen D. Mapping longitudinal development of local cortical gyrification in infants from birth to 2 years of age. J. Neurosci. 2014;34:4228–4238. doi: 10.1523/JNEUROSCI.3976-13.2014. [DOI] [PMC free article] [PubMed] [Google Scholar]
- 10.Wang L, Shi F, Yap PT, Gilmore JH, Lin W, Shen D. 4D multi-modality tissue segmentation of serial infant images. PLoS One. 2012;7:e44596. doi: 10.1371/journal.pone.0044596. [DOI] [PMC free article] [PubMed] [Google Scholar]
- 11.Li G, Nie J, Wu G, Wang Y, Shen D. Consistent reconstruction of cortical surfaces from longitudinal brain MR images. Neuroimage. 2012;59:3805–3820. doi: 10.1016/j.neuroimage.2011.11.012. [DOI] [PMC free article] [PubMed] [Google Scholar]
- 12.Yeo BT, Sabuncu MR, Vercauteren T, Ayache N, Fischl B, Golland P. Spherical demons: fast diffeomorphic landmark-free surface registration. IEEE Trans. Med. Imaging. 2010;29:650–668. doi: 10.1109/TMI.2009.2030797. [DOI] [PMC free article] [PubMed] [Google Scholar]
- 13.Ng AY, Jordan MI, Weiss Y. On spectral clustering: Analysis and an algorithm. Adv. Neur. In. 2002;14:849–856. [Google Scholar]
- 14.Wang B, Mezlini AM, Demir F, Fiume M, Tu Z, Brudno M, Haibe-Kains B, Goldenberg A. Similarity network fusion for aggregating data types on a genomic scale. Nature Methods. 2014;11:333–337. doi: 10.1038/nmeth.2810. [DOI] [PubMed] [Google Scholar]