Abstract
We investigate the Belousov–Zhabotinsky (BZ) reaction in an attempt to establish a basis for computation using chemical oscillators coupled via inhibition. The system consists of BZ droplets suspended in oil. Interdrop coupling is governed by the non-polar communicator of inhibition, Br2. We consider a linear arrangement of three droplets to be a NOR gate, where the center droplet is the output and the other two are inputs. Oxidation spikes in the inputs, which we define to be TRUE, cause a delay in the next spike of the output, which we read to be FALSE. Conversely, when the inputs do not spike (FALSE) there is no delay in the output (TRUE), thus producing the behavior of a NOR gate. We are able to reliably produce NOR gates with this behavior in microfluidic experiment.
1 Introduction
Computers are now ubiquitous in everyday life due to the advent of general-purpose computing. The development of modern digital computers was driven by the mass production of electronic digital logic circuits that use a combinatorial logic in which various boolean logic gates are combined into larger-scale circuits with desired input-output relations. Both NAND and NOR are universal boolean gates [1], in that every other boolean operation can be expressed by either a set of multiple NAND or a set of multiple NOR gates. Accordingly, the implementation of such universal boolean gates has been a field of active research [2,3].
In recent years there has been interest in what systems other than electronic circuits can be used to perform computation. For example, it has been shown that reaction–diffusion systems [4], DNA [5–7] and slime molds [8,9] are all capable of supporting computation. Chemical computation [10–14] is of special interest because it is fundamental to how living beings function–through a series of chemical reactions.
It is not our long term goal to create an economically viable chemical alternative to silicon logic gates. The NOR gate we developed operates 11 orders of magnitude slower than gates in silicon, the density of chemical gates is six orders of magnitude less than that of semiconductors and the number of cycles that a chemical gate can execute per battery charge is 12 orders of magnitude less than semiconductor devices. Chemical based digital logic is vastly inferior to silicon technology in speed, density and longevity. Consequently, we have no desire to compete with semiconductor technology. Instead, the motivation for this work is bioinspired. We recognize neuro-circuitry allows living organisms to execute a remarkable degree of control and computation. The chemical system we work with possesses several analogies to neurons. Our long term goal is to develop the minimal tools necessary to create purely synthetic chemical equivalents to neuronal based computational and control networks. By successfully engineering a chemical based network we make the first steps in developing this toolkit. In this sense, the creation of a chemical based NOR gate is a means to our end and not an end in itself.
In this work, we exploit previous findings that the Belousov–Zhabotinsky (BZ) reaction can be combined with microfluidics to achieve inhibitory coupling between BZ emulsion droplets [15] in order to create configurable NOR gate arrays with the compartmentalized BZ reaction. We have recently used the compartmentalized BZ reaction to test Turing's theory of the chemical basis of morphogenesis [16], and we now demonstrate that this same system is capable of achieving one of the fundamental bases of boolean logic, the NOR gate.
Many implementations of chemical computation use reaction–diffusion systems including the BZ reaction, an oscillating chemical reaction in which malonic acid is periodically oxidized by acidic bromate. As one of the first oscillating chemical reactions discovered [17], the BZ reaction has become the prototypical system to study nonlinear chemical dynamics [18,19]. The BZ reaction is particularly well-suited for computation due to spatial temporal signals that propagate as excitatory waves, which can be interpreted as Boolean values [13,20–22]. The propagating waves may collide and annihilate to eliminate a signal or propagate untouched which transmits a signal. Other implementations are based on coupled continuously stirred tank reactors (CSTRs) utilizing bi-stable systems [10] and perturbations with activator and inhibitor injections [23]. CSTRs have been used to compute with fuzzy logic as well, which permits additional operations by utilizing the continuity of chemical concentrations [23]. However, these systems typically occupy milliliter volumes. We present a novel system using Boolean logic that is composed of nanoliter volume droplets containing the oscillatory BZ reaction coupled via inhibition.
2 Experimental methods
BZ emulsion formation
BZ emulsion droplets are produced as previously described [24]. In brief, two aqueous streams of BZ reactants are co-encapsulated in a 1:1 ratio into ∼150 μm diameter emulsion droplets containing 400 mM Malonic Acid (MA), 80 mM Sulfuric Acid (H2SO4), 2.5 mM Sodium Bromide (NaBr), 300 mM Sodium Bromate (NaBrO3), 3 mM Ferroin, and 1.2 mM Ru(bpy)3 final concentration. The continuous phase is a fluorinated oil (HFE 7500) containing PFPE-PEG-PFPE surfactant to stabilize against emulsion droplet coalescence [25]. The resulting BZ emulsion droplets are predominantly coupled via inhibition since the communicator of inhibition, Br2, can selectively permeate between neighboring droplets [15,26].
Rectangle glass capillaries (VitroTubes™) were directly used for 2D emulsion storage without further treatment. The capillaries were 100 μm in height, chosen to be somewhat smaller than the droplet diameter such that the emulsion would spontaneously form a monolayer. The capillary widths were 20 times the height and the capillary lengths were hand cut between 2 to 4 cm. Inside the capillary, monodisperse droplets stabilized by the surfactant and driven by gravity spontaneously form a close-packed hexagonal lattice so that the system is at the highest packing density. The capillaries were positioned so that the axis defining the capillary width was oriented parallel to gravity to promote packing of the emulsion.
Modeling
We model BZ emulsion droplets as a system of nonlinear chemical oscillators coupled via inhibition using ordinary differential equations, given by the Vanag-Epstein (VE) model of BZ [27], in MATLAB. To simplify our modeling, we assume well-mixed homogeneous concentrations within each droplet since the characteristic time of diffusive mixing inside a droplet is τD = d2/D ≈ 10 s, which is much less than the 250–350 s period of oscillation[15,24,26]. Therefore, as was first done by Turing [28], each droplet is modeled as a geometric point. Furthermore, we assume there is no accumulation of chemicals between droplets and account for the surfactant and oil separating droplets by rescaling the diffusion constant by the permeation coefficient for each chemical species as done by Turing [16,28]. The equations and coupling used for our simulations are described in detail in Appendix A, along with a sample code file simulating a BZ NOR gate for any input. During each oscillation the main metal catalyst transitions nonlinearly between a long reduced ferroin (red) and a short oxidized ferriin state (blue). We define the phase of each oscillator to be zero at an oxidation spike–when ferriin concentration is greatest.
Programmable Illumination Microscope
To externally control droplet oscillation states, we use a Programmable Illumination Microscope (PIM)[24,29]. The PIM can “read” and “write” individual droplet oscillation states over the course of an experiment. Reading is done by measuring the intensity of transmitted green light; writing is done by illuminating individual droplets with blue light. To achieve optical control we render the BZ reaction light reactive through addition of a photosensitive catalyst Ru(bpy)3, which when exposed to blue light (λ = 452 nm) of sufficient intensity suppresses oscillations by forcing the oscillator into a constantly reduced redox state [30]. Once light is removed, the chemical clock restarts and after an interval of time that is approximately 60% of the period of oscillation, the droplet will spike again. We use a commercial projector to expose custom masks with dots of blue light on designated droplets with controlled light intensity and dot size. For droplet imaging we use a green (λ = 510 nm) Köhler illumination, viewed with a black-and-white CCD. We chose green light as it minimizes uncontrolled Ru(bpy)3 activation, while simultaneously maximizing optical contrast between reduced ferroin and oxidized ferriin. Green light is strongly absorbed by ferroin, but transmited through ferriin. Accordingly, droplets appear bright in the oxidized state and dark in the reduced state [16]. The PIM is directly controlled through custom MATLAB code to record brightness, droplet ID, and period and phase of oscillation while also automatically computing and projecting optical forcing masks [29] in real time; a schematic of the PIM optics is illustrated in Fig. 1.
Fig. 1.
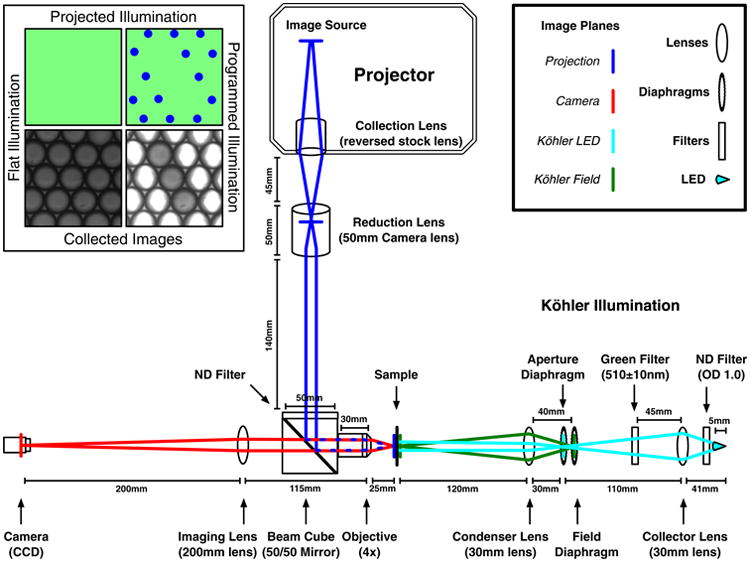
Schematic of the Programmable Illumination Microscope (PIM) optics. It consists of a commercial projector with inverted optics that projects blue light onto the sample, which is illuminated by green Köhler illumination on the right arm. Images are taken by a CCD on the left arm. The top-right inset is a legend for the optical components and image planes. The top-left inset demonstrates the projected illumination and collected images from the PIM. Within the inset the top-left is an illustration of the flat green illumination and bottom-left is an image of the emulsion collected with flat illumination, the top-right is an illustration of programmed illumination and bottom-right is an optically isolated NOR gate. The outer two droplets of the NOR gate are the inputs and the central droplet of the NOR gate is the output.
3 Chemical NOR gate
3.1 Definition
A NOR gate is a two-input logic gate which outputs TRUE when both inputs are FALSE, and outputs FALSE when one or both of the inputs are TRUE. To construct a NOR gate out of BZ droplets, we need to leverage their dynamics in such a way that they satisfy this definition. The simplest choice for a TRUE input signal is an oxidation spike in a droplet defined as the input to our gate, so a FALSE signal is a lack of an oxidation spike. To clarify our design, first inspect Fig. 2(a1). This is a photograph of BZ drops. The NOR gate consists of three drops in a row, two inputs labeled “In 1” and “In 2”, and the output, which is labeled “Out”. Drops that are illuminated with light of sufficient intensity to suppress BZ oscillations are white. In contrast, the output drop is gray because it is not illuminated and therefore oscillates. Figure 2(a2) is a timing diagram of a computational model of the NOR gate, which adopts the usual convention of digital timing diagrams in which high values are treated as logic TRUE and low values as logic FALSE. Inspection of the output reveals a periodic oscillation of the catalyst with a constant period of about 240 seconds. In Fig. 2(a) all drops with the exception of the output drop are exposed to constant illumination and appear white, while the output is never illuminated and appears gray. This pattern of illumination acts to isolate the output from all other drops and consequently the output oscillates with a constant period because the output does not receive time dependent perturbations from its neighbors.
Fig. 2.
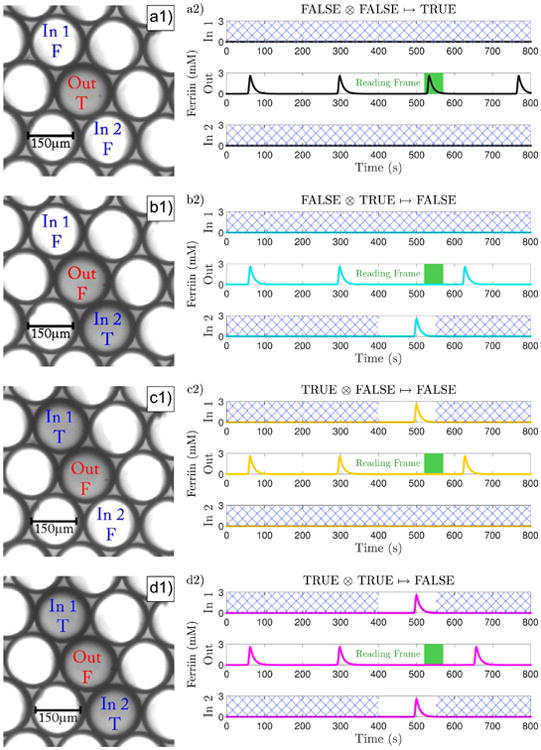
NOR gate droplet configuration and timing diagram. (a, b, c, d) Correspond to the four possible logic states of the inputs to a NOR gate; FF, TF, FT, TT. (a1, b1, c1, d1) Photographs of the BZ drops that comprise the NOR gate. (a2, b2, c2, d2) Timing diagrams of simulations of the NOR gate in which a high concentration of ferriin corresponds to the logic TRUE state, a low value to the logic FALSE state. The hatched area on the inputs represents the time during which light is applied to inhibit the droplets. The green box is the reading frame. (a) Both inputs are constantly suppressed with light and never spike; thus they are registered as FALSE. The output is unperturbed and spikes inside the reading frame; thus it is read as TRUE. (b-c) One input is constantly suppressed (FALSE) while light is removed from the second, allowing it to spike and hence is registered as TRUE. The output is perturbed and spikes outside the reading frame; thus it is read as FALSE. (d) Light is removed from both inputs allowing both to spike (TRUE). The output is perturbed and spikes outside the reading frame; thus it is read as FALSE.
For our 3-drop network to have the proper behavior of a NOR gate we must create an output in such a way that when one or both of our input droplets have an oxidation spike, the behavior of our output is distinguishable from the case when neither input spikes, but the difference between one and two spikes is indistinguishable. Since any oxidation spike in one droplet results in the diffusion of inhibitor to its neighbors, the desired behavior for our NOR gate can be produced by designating the droplet between two input droplets to be the output droplet as shown in Fig. 2. We can control whether or not an input spikes through the use of light. When we remove illumination from an input drop, that drop will spike at some later time. In our 3-drop NOR gate only the inputs have the possibility to be exposed to a variation in light intensity. Inputs are illuminated when we desire a FALSE input and not illuminated when we desire a TRUE input. In Fig. 2 all the unlabeled droplets are permanently illuminated with light, which holds them in a constant chemical state, while the output is never illuminated and oscillates. These conditions hold for all values of the NOR gate truth table. In Fig. 2(a) the two inputs are also permanently illuminated because the inputs are in the FALSE state. In Fig. 2(b,c) the illumination is temporarily removed from one input to momentarily create a TRUE state and in Fig. 2(d) both inputs are momentarily placed in the TRUE state.
If either of the inputs spike, they will inhibit the oscillation of the output, delaying the output spike until later than would otherwise be expected. Since the output droplet will always eventually spike, we can differentiate this delayed spike from the case when neither input spikes through the use of a reading frame. We measure when the output is expected to spike based on its natural period, and we also measure the delay in the output spike we expect from either one or two input spikes. We choose the reading frame to be a temporal window which ends after the output is expected to spike in the absence of input spikes but before it would spike if it receives one or two input spikes. By defining an output spike occurring inside the reading frame to be TRUE and outside the reading frame to be FALSE, we can produce the behavior of a NOR gate.
Figure 2 shows simulated plots of the time dependence of the ferriin concentration of the input and output droplets for each possible gate input. Figure 2(a2) is the timing diagram for the NOR gate with both inputs FALSE and therefore an output state of TRUE. The timing diagram for the output shows four periodic spikes. The reading frame is designated by a green box in the time interval of 520– 560 seconds. Since the spike occurs in the reading frame, it is interpreted as TRUE. Since there were no spikes from the inputs, the output oscillates at regular intervals. Experimentally we use the first two spikes to establish the frequency of the unperturbed output and from this information we calculate the time interval of the reading frame.
Figure 2(b) is a simulation of the NOR gate for the case where one input is FALSE and one input is TRUE. The TRUE input is created by turning off the illumination of the second input drop (In 2) for an interval of 150 seconds, beginning at t = 400 s. Approximately 100 seconds after the illumination is turned off, at t = 500 s, input 2 spikes. This spike occurs about 40 seconds before the output would have spiked had it not been perturbed by input 2. The spike from input 2 causes the output to delay its spike until t = 630 s, which is outside the reading frame; therefore the output is FALSE.
Figure 2(d) is a simulation of the NOR gate for the case where both inputs are FALSE. The TRUE inputs are created by turning off the illumination of both input drops (In 1, In 2) for an interval of 150 seconds, beginning at t = 400 s. Approximately 100 seconds after the illumination is turned off, at t = 500 s, both inputs spike. These two spikes occur about 40 seconds before the output would have spiked had it not been perturbed by the two inputs. This perturbation causes the output to delay its spike until t = 660 s, which also is outside the reading frame; therefore the output is FALSE.
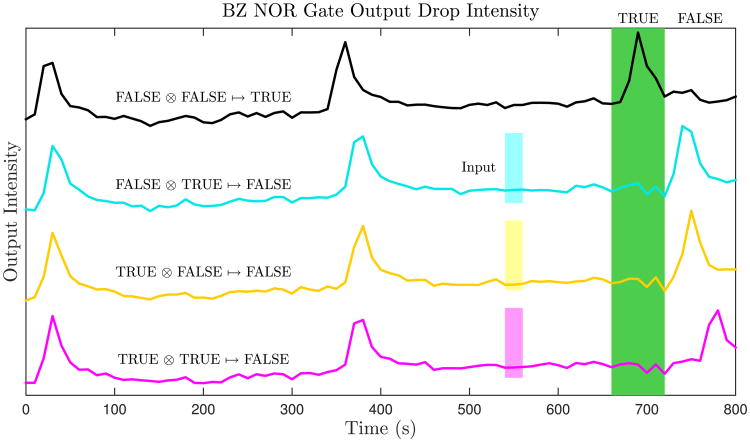
Figure 3 shows experimental outputs of the 3-drop NOR gate that was simulated in Fig. 2(a–d). In all cases, the first two output oscillations, which occur at t ≈ 20 s and t ≈ 380 s while the inputs are suppressed from oscillating by light, establish the reading frame, which we set to be the interval 660 s < t < 720 s, as indicated by the dark green band. The top row (black trace) corresponds to Fig. 2(a) in which both inputs are FALSE. Experimentally this is achieved by constantly illuminating the two inputs and thus suppressing them from oscillating, which means both inputs are in the logic state FALSE. Thus, the output drop is never perturbed and consequently the output oscillates during the reading frame at t = 690 s. This is interpreted as a TRUE output, which is the designed behavior for when both inputs are FALSE.
Fig. 3.
Experimental traces of the intensity of the output droplets of four NOR gates measured over time in experiment. Each trace corresponds to a NOR gate with a different input configuration. The three small colored boxes indicate when the input is received by way of perturbation from a neighboring input droplet. The large green box represents the reading frame of each gate. If the output droplet spikes within the reading frame then the output of that gate is TRUE; otherwise it is FALSE. As expected for a NOR gate, the FALSE ⊗ FALSE input results in a TRUE output, and all other input combinations result in a FALSE output. A movie of each of the four cases is shown in the Appendix B.
The second trace in Fig. 3 (cyan) corresponds to Fig. 2(b) in which one of the inputs (In 2) is placed in the TRUE state. Experimentally this is accomplished by extinguishing the illumination for a limited duration of time, as indicated by the timing diagram in Fig. 2(b). The input spike in the experiment in Fig. 3 (cyan) occurred at t = 550 s caused the output spike to delay until t = 750 s, which is outside the reading frame. Therefore the output was interpreted as FALSE, which is the appropriate logic state. The third case in Fig. 3 (yellow) corresponds to Fig. 2(c), which is the alternate case in which one input is TRUE and one input is FALSE. The output result is FALSE, as expected.
The final trace in Fig. 3 (magenta) corresponds to Fig. 2(d) in which both of the inputs are placed in the TRUE state. The output spike is delayed until t = 780 s, which is a longer delay than for the cases in which only one input is in the TRUE state. Since the output spikes outside the reading frame, the result is FALSE, as expected.
The videos in the Appendix B show the NOR gates in operation for each of the four possible cases. In our experiments we image close to 200 droplets and project light permanently on all but 8 × 3 = 24 droplets in such a way as to create 8 independent NOR gates. Running experiments on 8 NOR gates simultaneously allows us to improve statistics.
3.2 Characterization
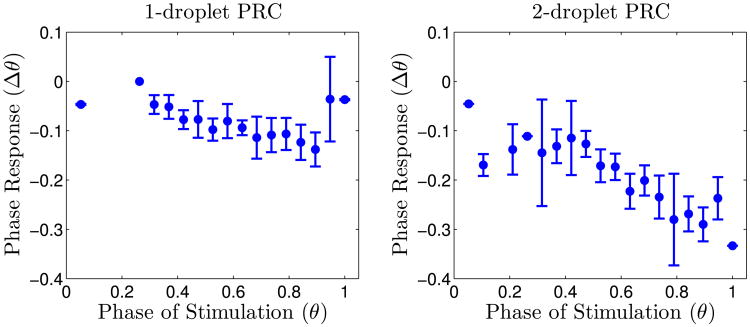
There are several factors we must measure to characterize our gate and verify that it functions reliably. First, the delay of the output's spike following a spike from an input must be significant enough that our reading frame correctly differentiates between TRUE and FALSE outputs. A larger delay means this can be accomplished more consistently. To characterize the delay resulting from an input spike, we measure the phase response curve (PRC). The PRC is the phase shift of the output droplet caused by an input spike as a function of the phase of the unperturbed output droplet. Having our inputs spike when they will produce the most negative phase shift, corresponding to the largest delay, will result in the optimal gate behavior. The PRCs for the case of perturbations from one and two inputs are plotted in Fig. 4. Experimentally, the phase shift produced in the output is roughly linear; two droplets produce twice the phase shift as one. Theoretically, our numerical model predicts that the phase shift from two droplets is 1.3 times the phase shift of one.
Fig. 4.
Phase response curve to perturbation by an oxidation spike from one and two droplets. The spike results in diffusion of Br2, which is converted to inhibitor and thus delays the phase. Approximately 10 measurements were performed for data points with 0.3 < θ < 0.95. Error bars mark one standard deviation above and below the mean phase response.
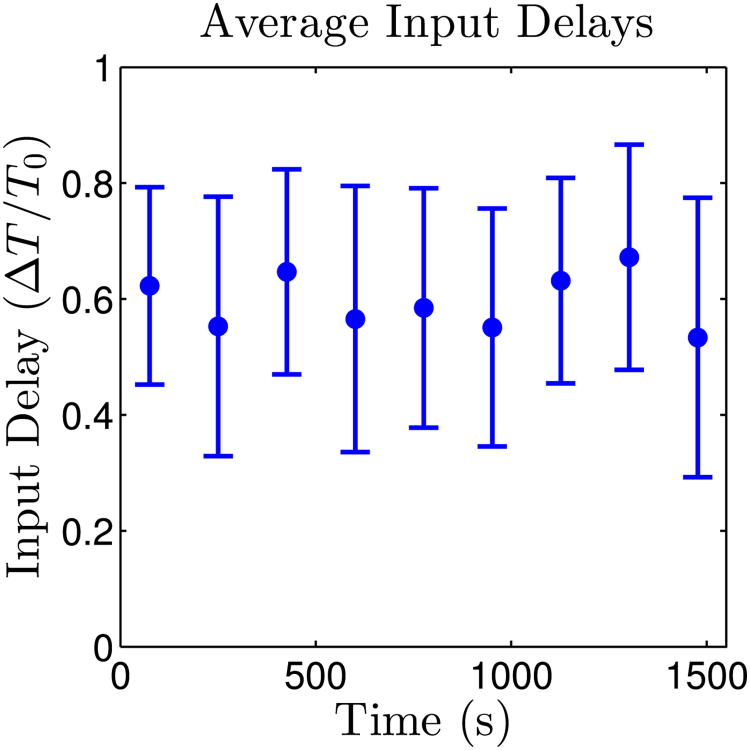
The input droplets are suppressed with light while they are not being used. To send a FALSE input, the input simply remains suppressed so it will not perturb its neighboring output droplet. To send a TRUE input, we cease illumination until it spikes once, then resume illumination, as illustrated in Fig. 3(b–e). Since we aim to have our inputs spike at a particular phase of the output, we must measure the amount of time for them to spike once we remove light; these measurements of the input delay are plotted as a function of time since the start of an experiment in Fig. 5. Once light is removed from a drop, we observe that the droplet spikes after a duration of time corresponding to 0.6 ± 0.2 of an oscillation period. There are no aging effects; the input delay does not change with age of the drop.
Fig. 5.
Average amount of time until an input spikes after light is removed, normalized by the natural period, as a function of time since the start of the experiment. The delay stays relatively constant throughout the experiment. Approximately 20 measurements were performed for each data point. Error bars mark one standard deviation above and below the mean phase response.
We determined the optimal phases to remove light from the inputs for all full NOR gate experiments by taking into consideration data from the one- and two-droplet PRCs as well as the length of time it takes for a droplet to oscillate after removing light. For the most robust operation of the NOR gate, one wants the input to produce a large phase delay on the output in order to reduce the occurrence of false negatives, i.e. cases where an input spike does not shift the output spike outside of the reading frame (Fig. 6). This consideration would lead one to aim to time the input spike to occur late in the period of the output drop, i.e. in the range of 0.8–1.0 in the phase of stimulation shown in Fig. 4, because this leads to the greatest phase delay of the output. However, the large variance of the average input delay (Fig. 5) can produce false negatives. For example, if, due to the large variation in the input delay, the input droplets spike after the output, then the output will not be delayed at all. Therefore it is better to time the release of the input droplet by removing the light in such a way that the maximum input delay occurs at 0.8 of the output droplet period.
Fig. 6.
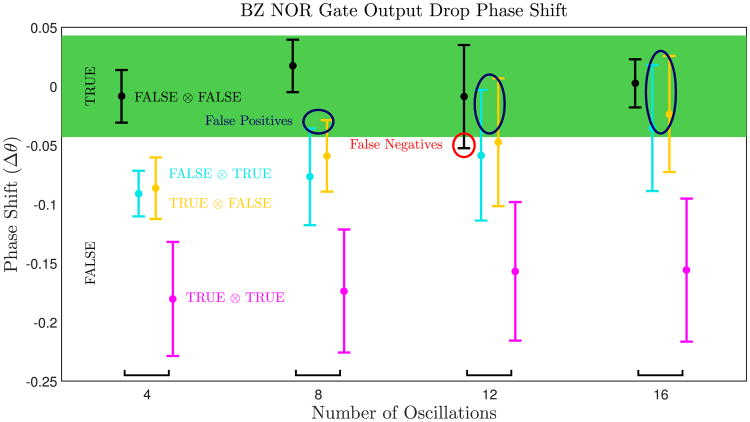
The phase shift (Δθ) of an output droplet for each possible input measured as a function of the number of times the droplets in an experiment have oscillated. Error bars mark one standard deviation above and below the mean phase shift. Phase shifts close to 0 indicate that there has been no perturbation from a TRUE input, so the output is TRUE. Phase shifts of greater magnitude indicate a FALSE output. Sometimes a TRUE input will not produce a large enough phase shift and the output will remain TRUE, resulting in a false positive. Other times due to changes in the period of oscillation of a droplet over time it will appear to have a large phase shift even though both inputs are FALSE, resulting in a false negative. Both of these cases are visible in this plot when the error bars for a particular input cross into the region indicating the incorrect output. However, most of the error bars correspond to the expected output for a given input, demonstrating that our NOR gates function correctly.
3.3 Results
Figure 6 displays the output response elicited from all four combinations of inputs, removing light at the optimal phase. In the experiment, 8 NOR gates were tested simultaneously and each NOR gate was cycled through the 4 different logic operations until they stopped oscillating. The number of cycles until the oscillations stopped was small; typically each NOR gate lasted 3 or 4 cycles, as shown in Fig. 6. Videos showing the data acquisition are included in Appendix A. For each cycle, all four input states were tested simultaneously, with 2 of the 8 gates in each of the four possible input states. A total of 40 independent gates were treated in this fashion. These results demonstrate that the TRUE⊗FALSE, FALSE⊗TRUE, and TRUE⊗TRUE inputs delay the output spike sufficiently for it to occur outside the reading frame and thus is read as a FALSE, while the FALSE⊗FALSE input induces no such delay–and the output spike occurs within the reading frame and thus is read as a TRUE. These are the necessary conditions for a functional NOR gate.
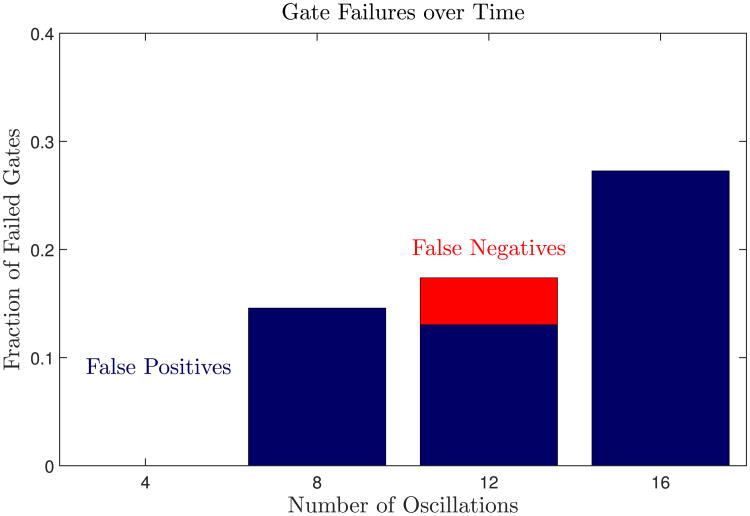
It is important to note that the variation in response is much greater with increasing time. The first two measurements yield fairly robust results, with all perturbations pushing the output spike outside the reading frame. However, the same cannot be said for later measurements when false positive outputs become more frequent. A false positive results when an input spike produces an insufficient phase delay in the output spike to move it outside the reading frame in which case the NOR gate reads TRUE, when it should read FALSE. The increase in false positives with time can be attributed to two factors: 1) large variation in input delay and 2) chemical aging expedited by light since Ru(bpy)3 is constantly oxidized in illuminated droplets. The first factor contributes to false positives since if the input oscillates earlier than expected or much later than expected, the phase response of the output will be smaller as indicated by the PRCs (Fig. 4). The second factor increases the overall consumption of reactants, so prolonged suppression with light reduces the lifetime of the reaction and the oscillators no longer behave as expected. This is confirmed in experiment where the inputs stop oscillating long before the output, which is never illuminated during the NOR gate measurements. Furthermore, a perturbation from an input droplet at a later time at the same phase elicits a smaller phase response from the output; this also increases the likelihood of a false positive. The false negatives are unrelated to either of these two factors, but rather are a consequence of the variation in the period of oscillation of the output which tends to drift over time, depending on MA concentration [26]; in our system, the period tends to increase slightly over time which would register as a negative phase shift.
Another measure of the robustness of our NOR gate is the fraction of computations that misrepresent a NOR gate. Consider the reading frame marked in green in Fig. 6. The FALSE⊗FALSE input will register a false negative if it falls outside the reading frame. Additionally, any case in which one or more of the other possible inputs results in a spike that occurs during the reading frame will register a false positive. We consider the fraction of input cases that register a false negative or false positive as a standard for the performance of our gates. The fraction of inputs that cause failed NOR gates is plotted in Fig. 7. Remarkably, all 40 NOR gates operated correctly during the first cycle, yielding a 100% success rate, but errors increase with age of the droplets.
Fig. 7.
Fraction of outputs which should be FALSE but are read as TRUE (false positive) and fraction of outputs which should be TRUE but are read as FALSE (false negative) as a function of the number of oscillations before each measurement. The first computation performed with each gate has a 100% success rate. The number of false positives increases over time as chemical aging reduces the phase shift in an output droplet from the spike of an input drop. False negatives can occur due to variation in the period of oscillation but there is no trend. After each gate has been used to perform four computations, the inputs no longer oscillate due to chemical aging.
We also compared our experimental results to simulated results using the VE model where several of the chemical concentrations are assumed to be constant, so the temporal effects of chemical aging we see in experiment are not present. A schematic of the output for every input is shown in Fig. 3 with a chosen reading frame that fulfills the logic of a NOR gate. These simulations agree with our experimental results of the fresh drops, when there is a 100% success rate.
4 Conclusion
We have demonstrated that it is possible to implement a NOR gate, a universal boolean gate, using the BZ reaction by compartmentalizing the reaction into droplets coupled via inhibition. Our droplets are small enough that they can be considered well-mixed, and this is supported by the fact that we do not see visible waves of oxidation within a droplet. Using well-mixed chemical oscillators provides an advantage over gates which function with excitatory waves, as such designs often rely on carefully tuning distances and timing within the circuit to ensure that waves will collide and annihilate, while our oscillators have approximately half a period range where a perturbation results in a phase shift on the same order of magnitude as the maximum shift achievable. The size of our droplets is orders of magnitude smaller than previous work using continuous flow stirred tank reactors. Furthermore, our system acts analogously to a Field-Programmable Gate Array (FPGA) since we are arbitrarily able to optically suppress droplets in our experiments and therefore we can easily utilize different configurations of droplets to produce different gates, or larger circuits.
5 Future work
There are multiple ways we envision improving the quality of our current gates. As a larger output delay from a TRUE input is more desirable, we plan to increase the delay by increasing the coupling strength between droplets. This can be simply achieved by reducing the size of our droplets; we are able to produce BZ droplets nearly 50 μm in diameter [16,26]. The issue of gate failure due to chemical aging can be addressed by considering an open system with a continuous flow of new catalyst.
A more important challenge is to solve the “fan-out” problem, that is how to connect an output of a single BZ NOR gates to multiple inputs of other BZ gates in order to create larger, more complex circuits. The main difficulty which must be overcome is that in a circuit consisting of many droplets, chemicals will diffuse equally from the output to the input and vice versa, but a signal in the circuit should only propagate in one direction.
Acknowledgments
We acknowledge support from the Brandeis Center for Bioinspired Soft Materials, an NSF MRSEC, DMR-1420382. We are grateful for the advice generously given on multiple occasions by Irv Epstein and Viktor Horv´ath regarding the BZ chemistry.
A Numerical simulations
Chemical mechanism
A key feature of the BZ reaction is the auto-catalytic oxidation of a catalyst (ferroin) combined with inhibition of the oxidation via a chemical intermediate (Br−). Richard Field, Endre Körös, and Richard Noyes published a detailed mechanism of the BZ reaction in 1972, which has become known as the FKN mechanism [31]. A qualitative description of its oscillatory nature consists of the following three processes:
Process 1. Consumption of inhibitor (Br−).
Process 2. Auto-catalytic oxidation of ferroin.
Process 3. Simultaneous reduction of ferriin and production of inhibitor (Br−).
Once all the ferriin is reduced, there is no longer production of inhibitor. As a result, there is a net consumption of inhibitor which signifies the return to Process 1 and the cycle repeats. The full mechanism is described in Equations (A.1) through (A.10), with rate constant values given in Table A.1.
Table A.1.
Variables, constants, and reaction rates in the VE model and coefficients of diffusive transport used to couple oscillators. Values of the concentration constants and other constants are specific to our simulations; the reaction rates excluding k(I) are specific to the FKN mechanism. For m > 0.1, k9 = 0.12m; otherwise, k9 = 0.7m. We let k(I) = 10−4 s−1 to suppress oscillations.
| Concentration | Vari able | Reaction Rate | Value | |
|---|---|---|---|---|
| [HBrO2] | x (M) | k1 | 2 × 10⁶h (M−1s−1) | |
| [Br−] | y (M) | k2 | 2h2a (s−1) | |
| [Ferrin] | z (M) | k3 | 3 × 10³ (M−1s−1) | |
| [Br2] | u (M) | k4 | 42ha (s−1) | |
| Concentration | Constant | k5 | 5 × 10⁹ h (M−1 s−1) | |
| [H+] | h = 0.16 (M) | k6 | 10 (s−1) | |
|
|
a = 0.30 (M) | k7 | 29m (s−1) | |
| [MA] | m = 0.40 (M) | k8 | 9.3m (s−1) | |
| [BrMA] | b = 0.10m (M) | k9 | 0.07m − 0.12m (s−1) | |
| Other Constants | k10 | 0.05m (s−1) | ||
| c0 = 0.0034 (M) | kr | 2 × 10⁸ (M−1s−1) | ||
| cmin = 6.1 × 10⁻⁵ (M) | kred | 5 × 10⁶ (M−1s−1) | ||
| bC = 0.05 (M) | k(I) | 0 – 10−4 (s−1) | ||
| Coefficients of Diffusive Transport | ||||
| μx = 0.0020 (s−1) | μy = 0 (s−1) | μz = 0 (s−1) | μu = 0.987 (s−1) | |
Process 1.
| (A.1) |
| (A.2) |
| (A.3) |
| (A.4) |
Process 2.
| (A.5) |
| (A.6) |
| (A.7) |
| (A.8) |
Process 3.
| (A.9) |
| (A.10) |
Reactions with light
It has been shown that light at the wavelength λ = 452 nm excites the ruthenium catalyst and causes a series of photo-chemical reactions in the BZ system that produce bromide, the inhibitor [27,30]. The reactions involving the photo-sensitive catalyst Ru(bpy)3 are as follows:
| (A.11) |
| (A.12) |
| (A.13) |
Chemical model
We use the Vanag-Epstein (VE) model which, starting from the FKN mechanism, simplifies the BZ reaction to a model with only four variables, each representing a chemical concentration [27]. The four concentration variables are x = [HBrO2], y = [Br−], z = [oxidized catalyst], and u = [Br2]. The differential equations governing the time evolution of each concentration are as follows:
| (A.14) |
| (A.15) |
| (A.16) |
| (A.17) |
Reaction rate constants are denoted by k with a subscript, k(I) is the rate of excitation of Ru(bpy)3 as given in Eq. (A.11) and is a function of the light intensity I, c0 is the total concentration of catalyst, , bC = kd/kC, and b = [BrMA], all of which are taken to be constants with values listed in Table A.1. We let k(I) = 10−4 s−1 to suppress oscillations.
Coupled oscillators
As stated in the main text, we assume each droplet is a geometric point. We also assume there is no accumulation of chemicals between cells and account for the surfactant and oil separating droplets by rescaling the diffusion constant by the permeation coefficient for each chemical species. Given these assumptions, we treat our droplets as points whose chemicals pass directly to each other with a particular coefficient of diffusive transport μk. The reaction-diffusion equation governing this discrete system is
| (A.18) |
where ci is a vector containing the n chemical species in the i-th oscillator, R : ℝn ↦ ℝn is a vector function that describes the reaction kinetics governing each species ck, Aij is an element in the N × N adjacency matrix A that depends on the network and is equal to one if droplet i and j are coupled and zero if they are uncoupled, and D is a n × n diagonal matrix containing the coefficients of diffusive transport for each chemical species; they are proportional to the diffusion coefficient and depend on the geometry of the system as well as the diffusion and partition coefficients of each chemical species. Equation (A.18) tells us that the time evolution of each oscillator is governed by a reaction within, R(ci), and diffusion from neighbors, hence describing a reaction-diffusion system.
Explicitly in the VE model, c = [x, y, z, u] and R(c) = [ẋ,ẏ,ż,u̇], where ẋ, ẏ, ż, and u̇ are defined by Eqs. (A.14) through (A.17). D is a 4 × 4 matrix given by
| (A.19) |
The numerical values of the entries were derived using a geometric point model [16]; in our simulations, we use (μx, μy, μz, μu) = (0.0020, 0, 0, 0.0987) s−1 as listed in Table A.1.
For two coupled oscillators, the adjacency matrix is
| (A.20) |
and hence Eq. (A.18) reduces to
| (A.21) |
where Δk = kj − ki. The sample code includes 6 MATLAB files, “coupled_drop_ODE.m”, “initialLeda.m”, “input_light.m”, “nor_sim.m”, “parametersLeda.m”, and “reactorLeda.m”, which must all be in the MATLAB path (i.e. in the same folder). Together, they allow “nor_sim.m” to simulate a NOR gate for any input using MATLAB version R2014b code. This code was used to generate Fig. 3 (b–e) and provides a template for simulating other configurations of coupled droplets. Instructions on how to run the simulation and the function of each file are detailed in the README.txt file.
B NOR gate videos
The four annotated videos show the operation of the NOR gate, each consisting of a different input. In each video, both input droplets are suppressed initially. We do not read the output drop, but let the output droplet spike in order to measure its natural period T0. After that initial measurement of the output drop's period, the gate is tested. The videos are sped up 20 times.
Video 1
Light is never removed from either input, so they never spike and thus are both FALSE. We begin reading the output at ti = 0.8T0 and stop at tf = 1.05T0. The output spikes when we are not reading, so it is TRUE. Hence we have FALSE⊗FALSE↦TRUE.
Video 2
Light is never removed from input 1, so it never spikes and thus is FALSE. Light is removed from input 2 and projected again immediately after it spikes. The spike from input 2 perturbs the output, so it is TRUE. We begin reading the output at ti = 0.8T0 and stop at tf = 1.05T0. The output spikes when we are not reading, so it is FALSE. Hence we have FALSE⊗TRUE↦FALSE.
Video 3
Light is removed from input 1 and projected again immediately after it spikes. The spike from input 1 perturbs the output, so it is TRUE. Light is never removed from input 2, so it never spikes and thus is FALSE. We begin reading the output at ti = 0.8T0 and stop at tf = 1.05T0. The output spikes when we are not reading, so it is FALSE. Hence we have TRUE⊗FALSE↦FALSE.
Figures B.1.
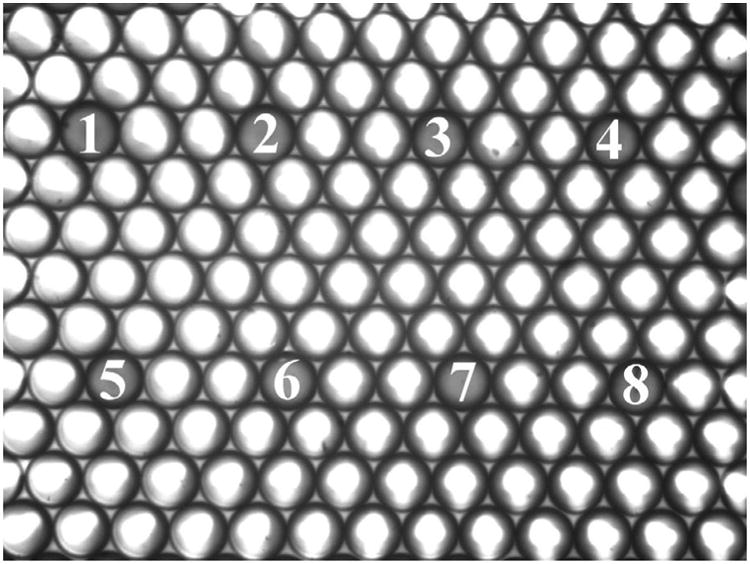
Image taken from Video 5 with each NOR gate labeled 1 through 8.
Table B.2.
List of operations performed by each NOR gate in Video 5 at each cycle. Gate numbers are labeled as in Fig. B.1. TRUE and FALSE are abbreviated as T and F, respectively.
| Gate Number | Cycle 1 | Cycle 2 | Cycle 3 |
|---|---|---|---|
| 1 | T⊗T | F⊗T | T⊗F |
| 2 | T⊗T | F⊗F | T⊗F |
| 3 | T⊗F | F⊗F | T⊗T |
| 4 | F⊗T | T⊗F | F⊗F |
| 5 | F⊗T | T⊗T | F⊗F |
| 6 | F⊗F | T⊗T | F⊗T |
| 7 | F⊗F | T⊗F | F⊗T |
| 8 | T⊗F | F⊗T | T⊗T |
Video 4
Light is removed from both inputs and projected again immediately after they spike, which is detected once the intensity passes a threshold value. Both inputs perturb the output, so they are both TRUE. We begin reading the output at ti = 0.8T0 and stop at tf = 1.05T0. The output spikes when we are not reading, so it is FALSE. Hence we have TRUE⊗TRUE↦FALSE.
Video 5
This unannotated video shows the operation of 8 independent NOR gates simultaneously in a single experiment. It is sped up 200 times. Each gate is cycled through 3 of the 4 possible input states, with 2 of the 8 gates in each of the four possible input states at every cycle. The operation performed in each gate at every cycle is listed in Table B.2, where the gate number corresponds to the label in Fig. B.1.
References
- 1.Sheffer HM. Trans Am Math Soc. 1913;14:481. [Google Scholar]
- 2.Tamsir A, Tabor JJ, Voigt CA. Nature. 2011;469:212. doi: 10.1038/nature09565. [DOI] [PMC free article] [PubMed] [Google Scholar]
- 3.Qian L, Winfree E. Science. 2011;332:1196. doi: 10.1126/science.1200520. [DOI] [PubMed] [Google Scholar]
- 4.Adamatzky A, Costello BDL, Asai T. Reaction-Diffusion Computers. Elsevier; 2005. [Google Scholar]
- 5.Liu Q, Wang L, Frutos AG, Condon AE, Corn RM, Smith LM. Nature. 2000;403:175. doi: 10.1038/35003155. [DOI] [PubMed] [Google Scholar]
- 6.Ogihara M, Ray A. Algorithmica. 1999;25:239. [Google Scholar]
- 7.Qian L, Winfree E, Bruck J. Nature. 2011;475:368. doi: 10.1038/nature10262. [DOI] [PubMed] [Google Scholar]
- 8.Adamatzky A, de Lacy Costello B, Shirakawa T. IJBC. 2008;18:2373. [Google Scholar]
- 9.Tsuda S, Aono M, Gunji YP. BioSystems. 2004;73:45. doi: 10.1016/j.biosystems.2003.08.001. [DOI] [PubMed] [Google Scholar]
- 10.Lebender D, Schneider F. J Phys Chem. 1994;98:7533. [Google Scholar]
- 11.Tóth A, Showalter K. J Chem Phys. 1995;103:2058. [Google Scholar]
- 12.Hjelmfelt A, Weinberger ED, Ross J. Proc Natl Acad Sci U S A. 1991;88:10983. doi: 10.1073/pnas.88.24.10983. [DOI] [PMC free article] [PubMed] [Google Scholar]
- 13.Adamatzky A, Holley J, Dittrich P, Gorecki J, Costello BDL, Zauner KP, Bull L. BioSystems. 2012;109:72. doi: 10.1016/j.biosystems.2011.12.007. [DOI] [PubMed] [Google Scholar]
- 14.Muzika F, Schreiberová L, Schreiber I. R Soc Chem Adv. 2014;4:56165. [Google Scholar]
- 15.Toiya M, González-Ochoa HO, Vanag VK, Fraden S, Epstein IR. J Phys Chem Let. 2010;1:1241. [Google Scholar]
- 16.Tompkins N, Li N, Girabawe C, Heymann M, Ermentrout GB, Epstein IR, Fraden S. Proc Natl Acad Sci U S A. 2014;111:4397. doi: 10.1073/pnas.1322005111. [DOI] [PMC free article] [PubMed] [Google Scholar]
- 17.Belousov BP. Compil Abstr Radiat Med. 1959;147:1. [Google Scholar]
- 18.Fukuda H, Morimura H, Kai S. Physica D. 2005;205:80. doi: 10.1021/jp052717k. [DOI] [PubMed] [Google Scholar]
- 19.Sagués F, Epstein IR. Dalton Trans. 2003;7:1201. [Google Scholar]
- 20.Holley J, Adamatzky A, Bull L, Costello BDL, Jahan I. Nano Commun Netw. 2011;2:50. [Google Scholar]
- 21.Steinbock O, Kettunen P, Showalter K. J Phys Chem. 1996;100:18970. [Google Scholar]
- 22.Heymann M, Harrington KI, Pollack JB, Fraden S. In: Proceedings of the Twelfth International Conference on the Simulation and Synthesis of Living Systems, 2010. Fellermann H, Dörr M, Hanczyc MM, Laursen LL, Maurer S, Merkle D, Monnard PA, Støy K, Rasmussen S, editors. MIT Press; Cambridge: 2010. p. 166. [Google Scholar]
- 23.Gentili PL, Horvath V, Vanag VK, Epstein IR. Int J Unconv Comput. 2012;8:177. doi: 10.1002/anie.201201962. [DOI] [PubMed] [Google Scholar]
- 24.Delgado J, Li N, Leda M, González-Ochoa HO, Fraden S, Epstein IR. Soft Matter. 2011;7:3155. [Google Scholar]
- 25.Holtze C, Rowat AC, Agresti JJ, Hutchison JB, Angile FE, Schmitz CHJ, Koster S, Duan H, Humphry KJ, Scanga RA, Johnson JS, Pisignano D, Weitz DA. Lab Chip. 2008;8:1632. doi: 10.1039/b806706f. [DOI] [PubMed] [Google Scholar]
- 26.Li N, Delgado J, González-Ochoa HO, Epstein IR, Fraden S. Phys Chem Chem Phys. 2014;16:10965. doi: 10.1039/c4cp00957f. [DOI] [PubMed] [Google Scholar]
- 27.Vanag VK, Epstein IR. J Chem Phys. 2009;131:104512. [Google Scholar]
- 28.Turing AM. Phil Trans R Soc B. 1952;237:37. [Google Scholar]
- 29.Tompkins N, Fraden S. Am J Phys. 2016;84:150. doi: 10.1119/1.4935806. [DOI] [PMC free article] [PubMed] [Google Scholar]
- 30.Kalyanasundaram K. Coord Chem Rev. 46:159. [Google Scholar]
- 31.Noyes RM, Field R, Körös E. J Am Chem Soc. 1972;94:1394. [Google Scholar]


