
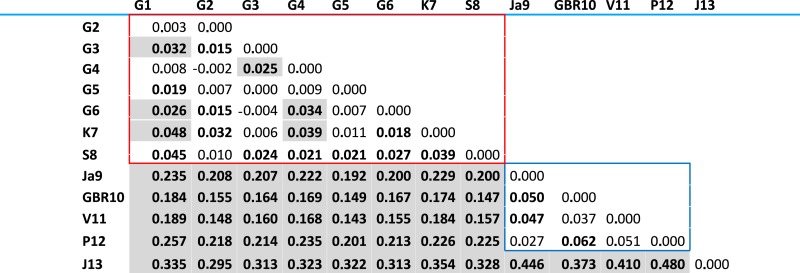
Table 2. Pairwise values for 13 Acanthaster ‘planci’ localities.
Bold numbers and gray cells indicate statistical significance after FDR and Bonferroni correction at P < 0.05. The red and blue squares show the regional group found in this study based on STRUCTURE and PCA analyses (see text for details).
|