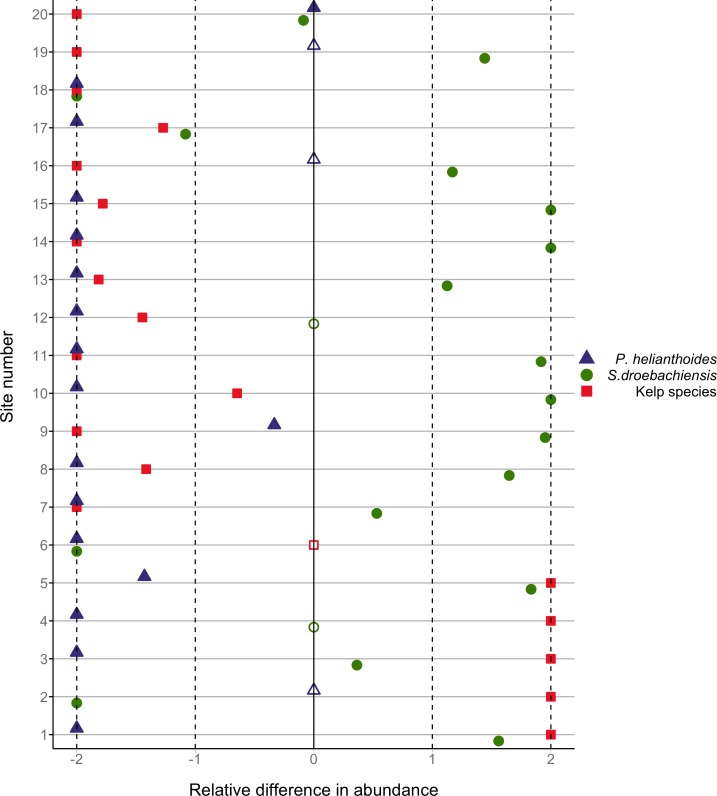
Figure 6. Relative difference in abundance of sea stars, urchins and kelp by site.
The relative difference in total count of sunflower stars (blue triangles) and green urchins (green circles), and the relative difference in the mean percent cover of algae (red squares) before and after the sea star mass mortality. Open symbols indicate sites where population density was zero both before and after the mass mortality. Relative difference was calculated as the change in abundance divided by the mean abundance of both time periods. A relative difference of −2 indicates the population declined to zero. Sites are numbered chronologically according to the order in which they were surveyed, from June to August, 2014. The geographic location of these sites is shown in Fig. 2.

