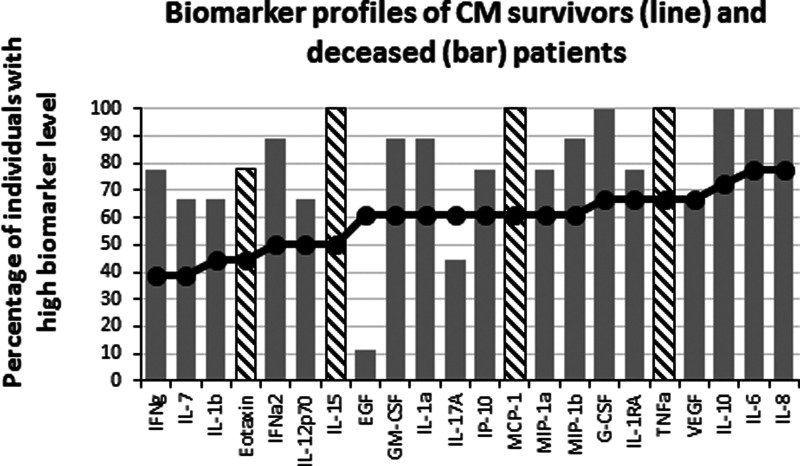
Figure 4. Levels of inflammatory immune mediators are higher in deceased than in survivors of cerebral malaria.
The ascendant biomarker profile curve of the survivors (line) was plotted on the deceased graph (bars) to visualize the difference in the proportion of high biomarker producers. Hatched bars represent biomarkers for which there is a significant difference in Mann–Whitney U pairwise comparison between the two groups after Benjamini–Hochberg multiple test adjustment.

