Introduction
Growth charts are essential and universally used for evaluating growth and development of children in both clinical settings and in public health examinations (1, 2). We previously reported the growth standards for Japanese children with percentile values based on the year 2000 national survey data (3), which were established by the lambda-mu-sigma (LMS) method (4). These standards have been widely used mainly in public health examinations. In clinical practices, Japanese physicians preferably assess growth with standard deviation (SD) scores, because many physicians feel that percentiles are not suitable for monitoring children with extreme growth retardation. Considering this, we created practical growth charts with mean and SD values, based on the criteria of the national medical aid program for specific pediatric chronic diseases by using the eye-fitting method (5). Although these charts have been widely used in clinical settings, they do not reflect the correct distributions of height and weight for Japanese children, especially the weight chart. Weight is not usually distributed normatively, but the practical weight chart was made with the assumption of a normal distribution. To this end, we saw the need for growth standards that can be used appropriately both for clinical and public health purposes. Therefore, we reanalyzed the previously reported growth standard charts with percentile values (3) and constructed the growth standards with mean and SD values for Japanese children, which would be applicable not only for clinical practices but also for public health examinations.
Methods
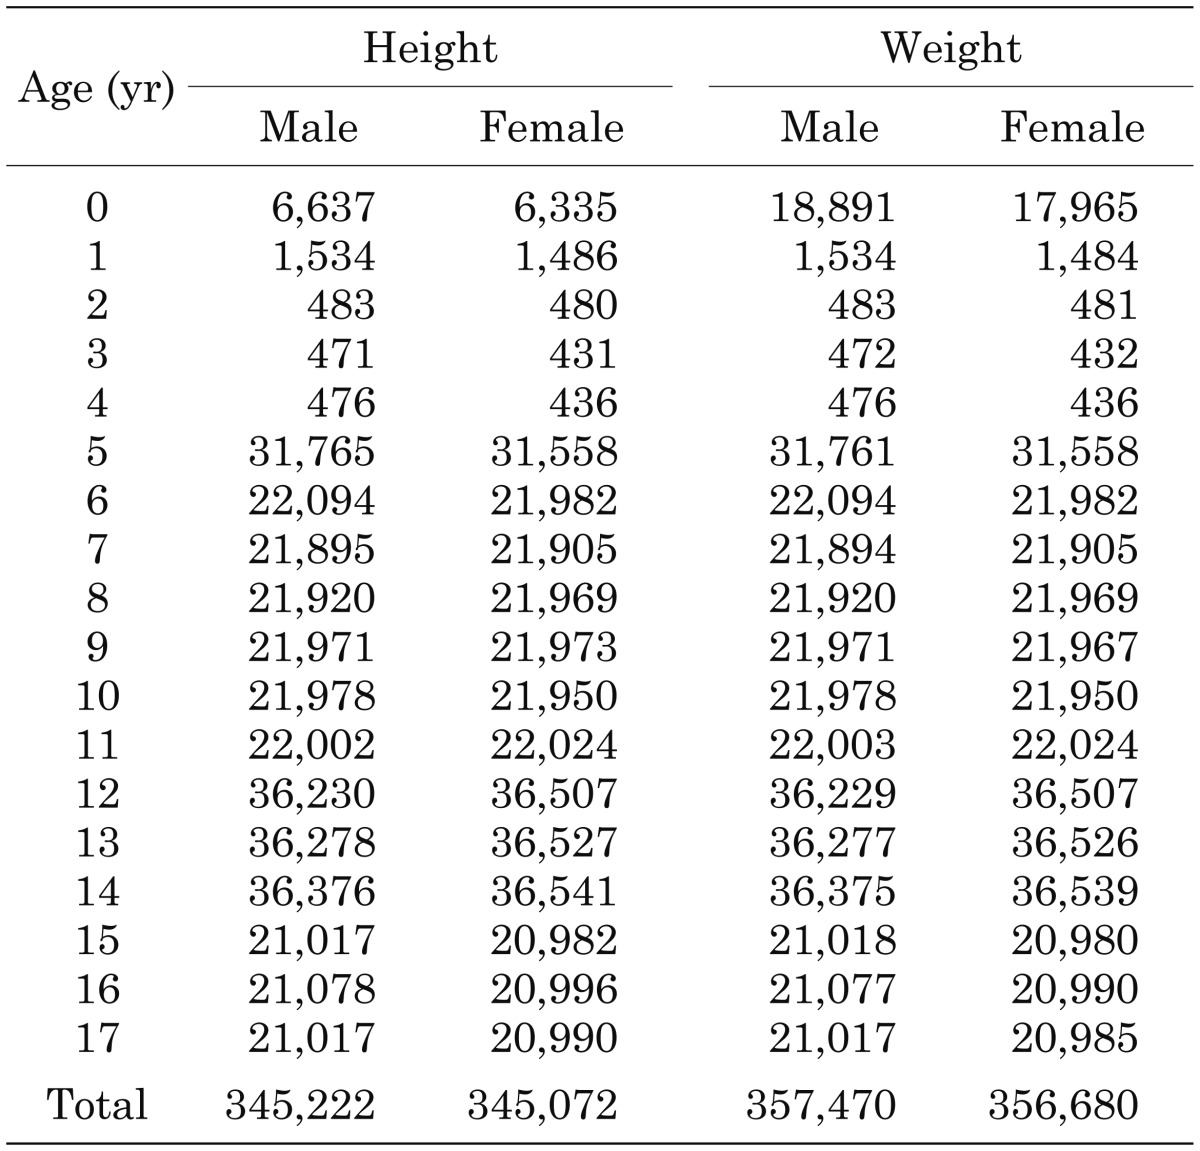
We used the same datasets as those in our previous report (3). In short, we used the data obtained from the national survey in year 2000. The data included 18,550 anthropometric measurements of babies and infants surveyed by the Ministry of Health, Labour and Welfare and 695,600 anthropometric measurements of school children surveyed by the Ministry of Education, Culture, Sports, Science and Technology. Table 1 shows the age distribution of the numbers of measurements used for the analysis. To establish the growth charts, the LMS method (4) was used, with the assumption that the data could be transformed to a normal distribution by utilizing a suitable power transformation (L), and the distribution was summarized by the median (M) and coefficient of variation (S). The three curves (L, M, and S) were fitted and smoothed by polynomial functions with several knots, which were determined by inspecting the curves to be fitted (6). The polynomial functions were determined by the least sum of the squared residuals. The adjustments for ridges of near adult ages were performed by Quo’s method (7).
Table 1. Age distribution of the numbers of measurements used for analysis.
The values of L, M, and S were constrained to change smoothly with age, and fitted values could be used to construct any required centile curves. The SD score (Z-score) of each measurement (y value) could be calculated from the L, M and S curves, using values appropriate for the age and gender, with the following equation: Z = [(y/M)L–1] / (L × S), or Z = ln (y/M)/S if L = 0.
Results
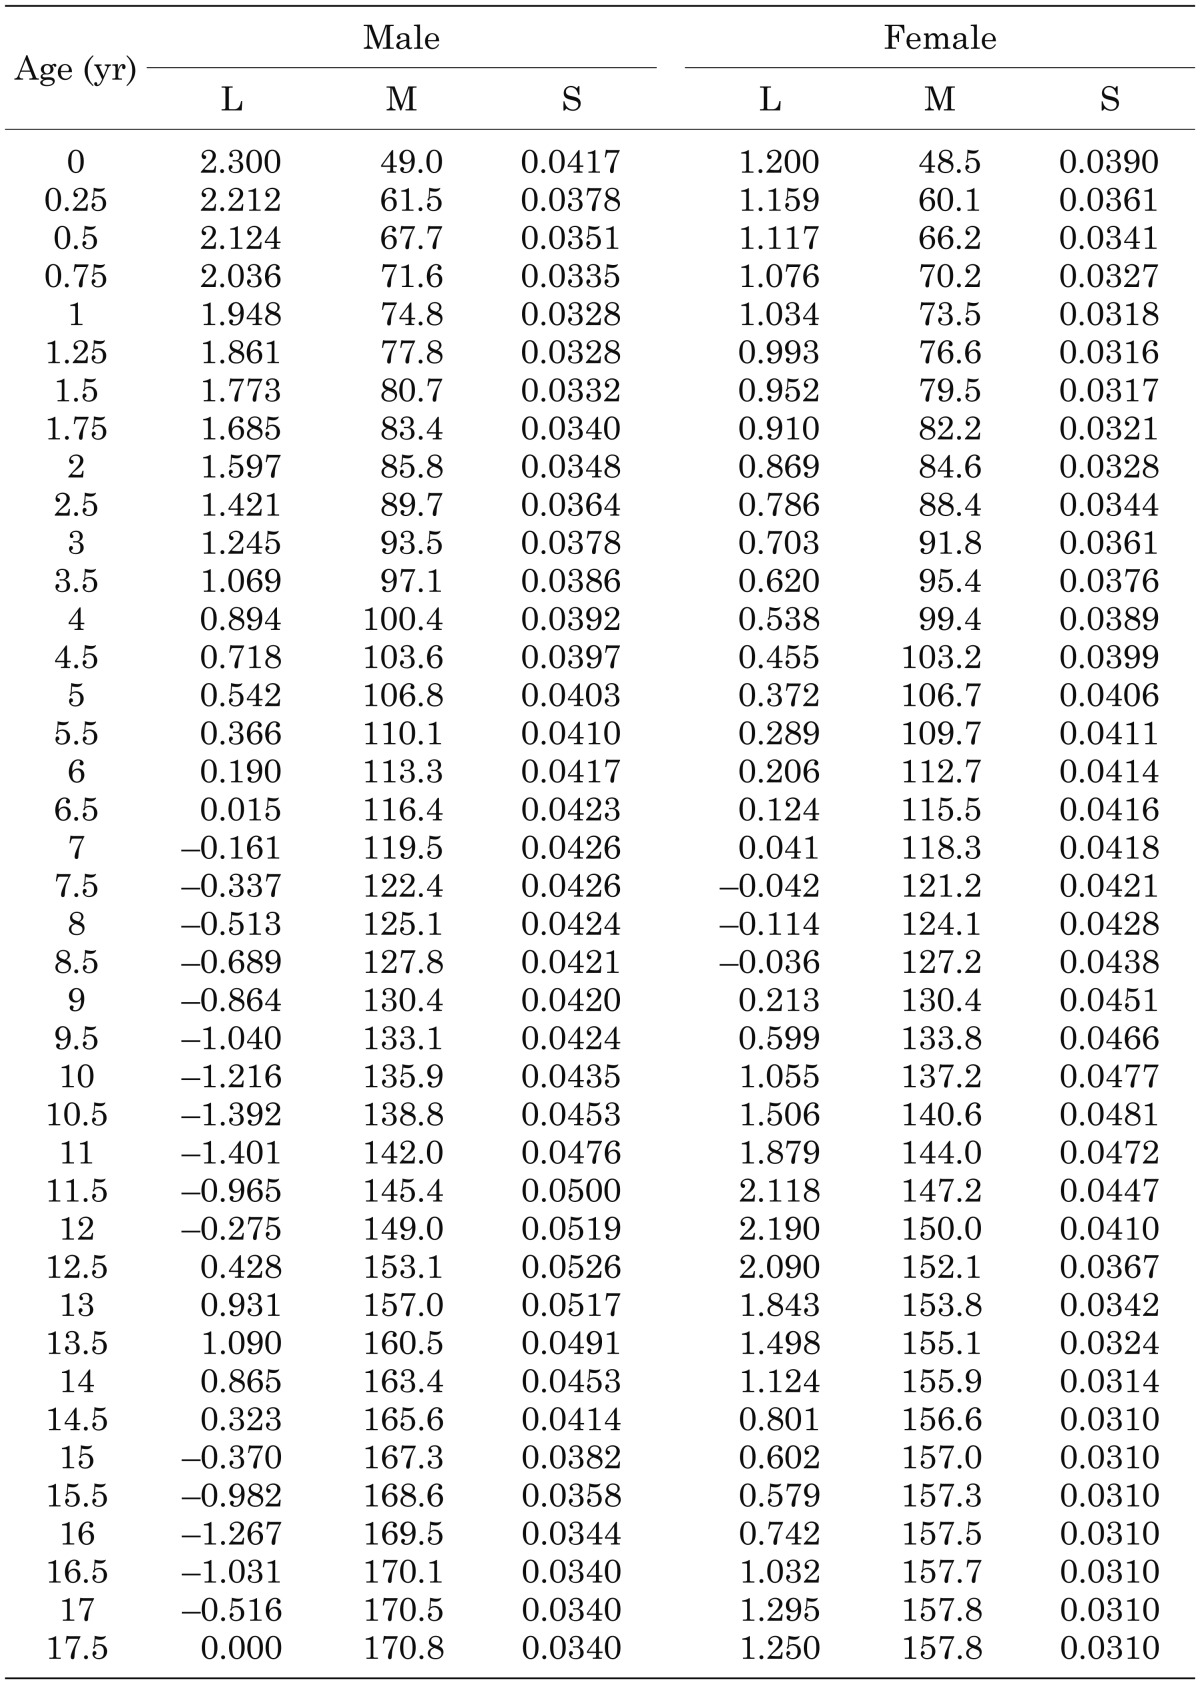
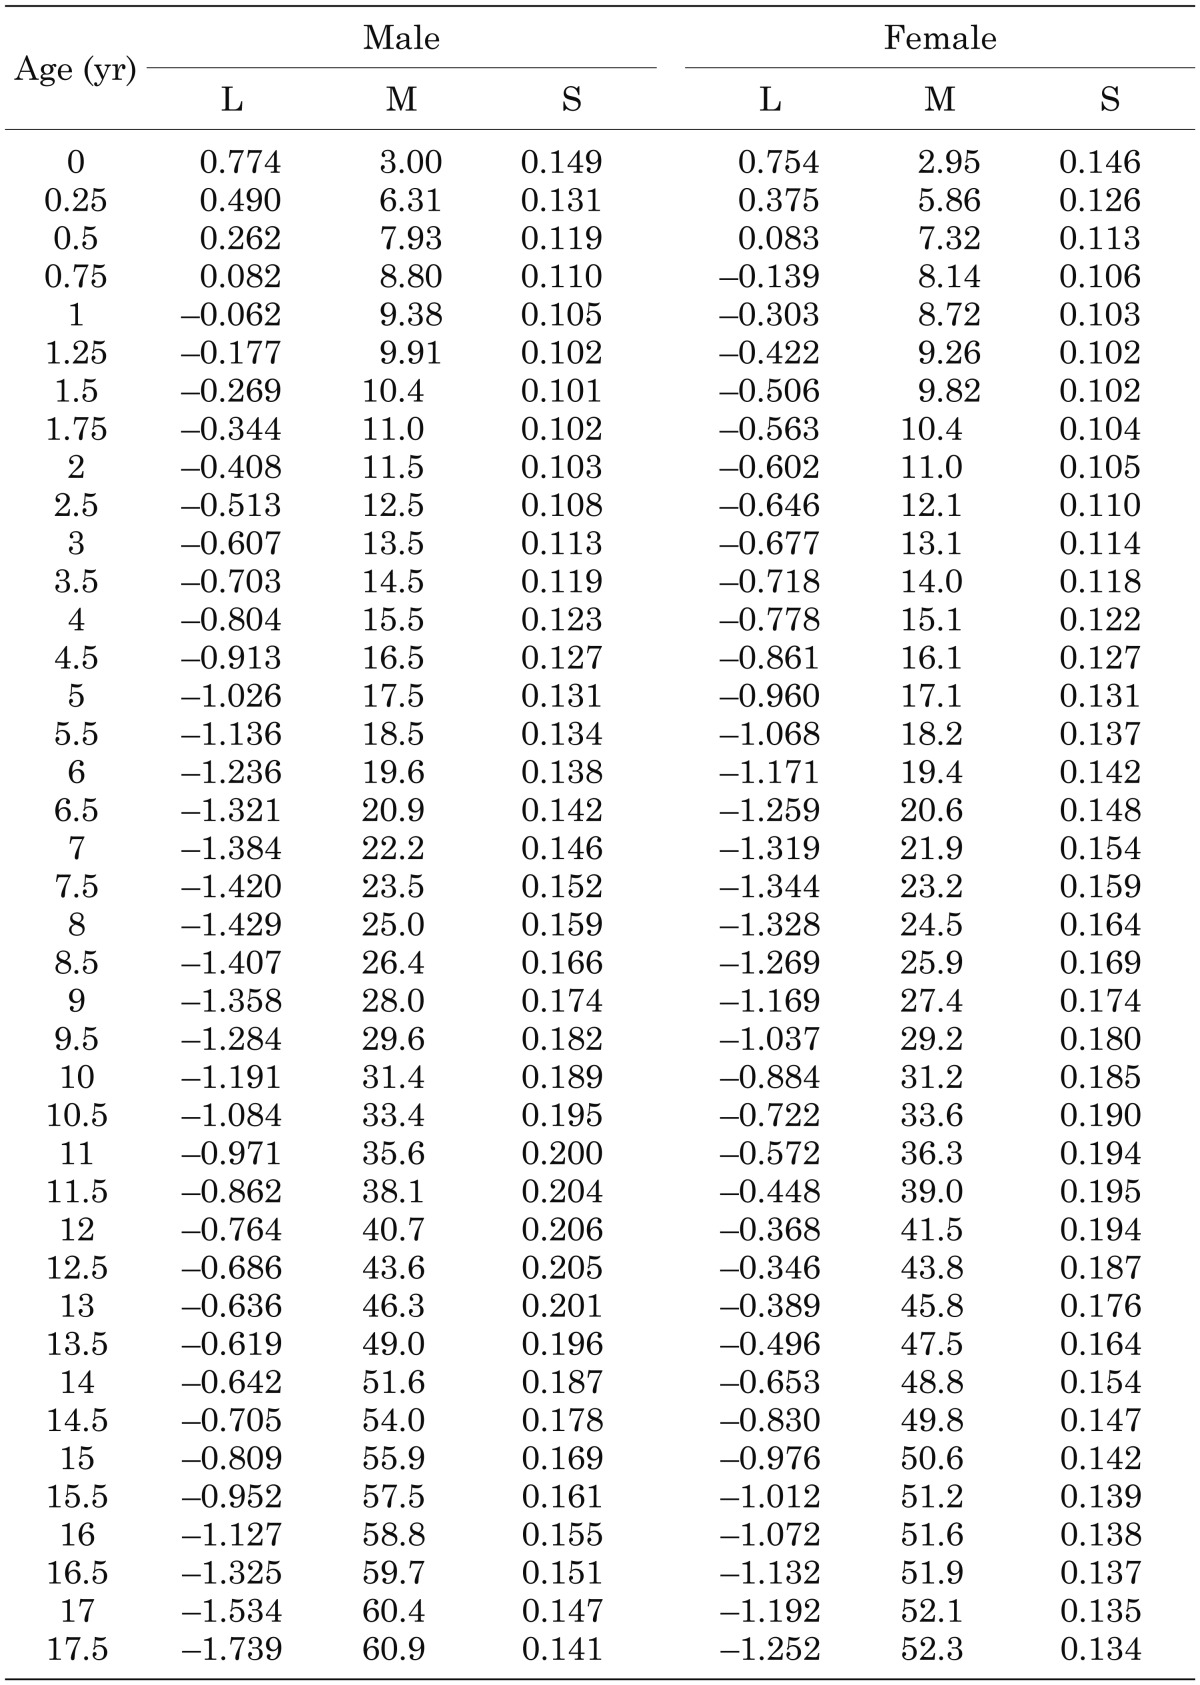
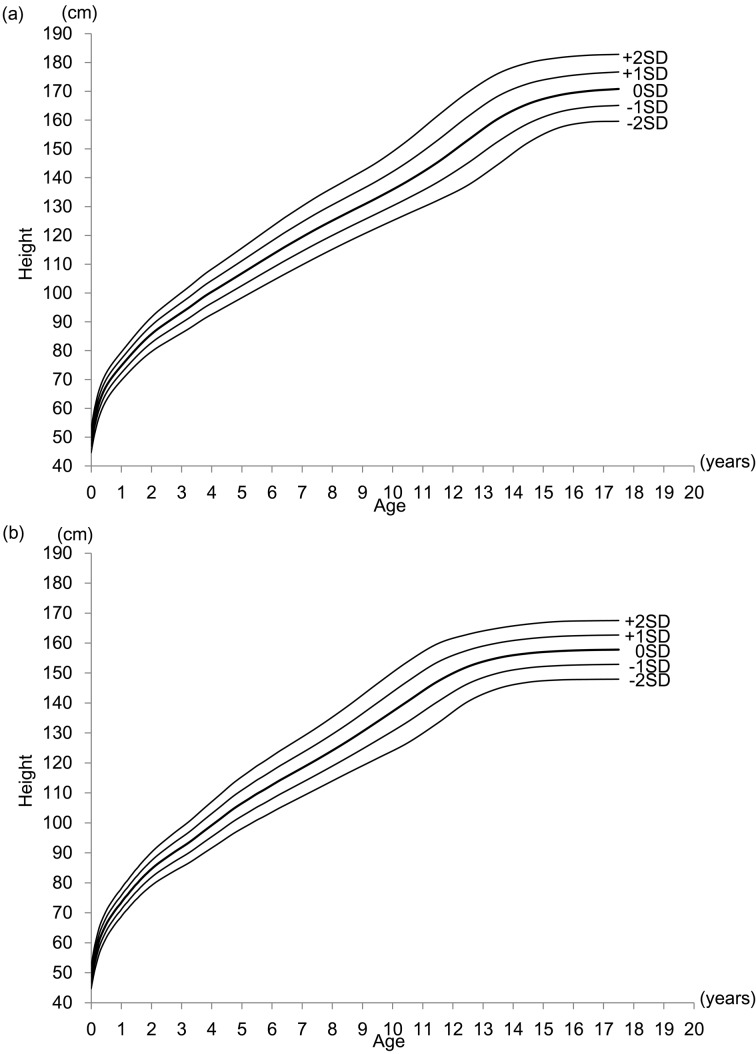
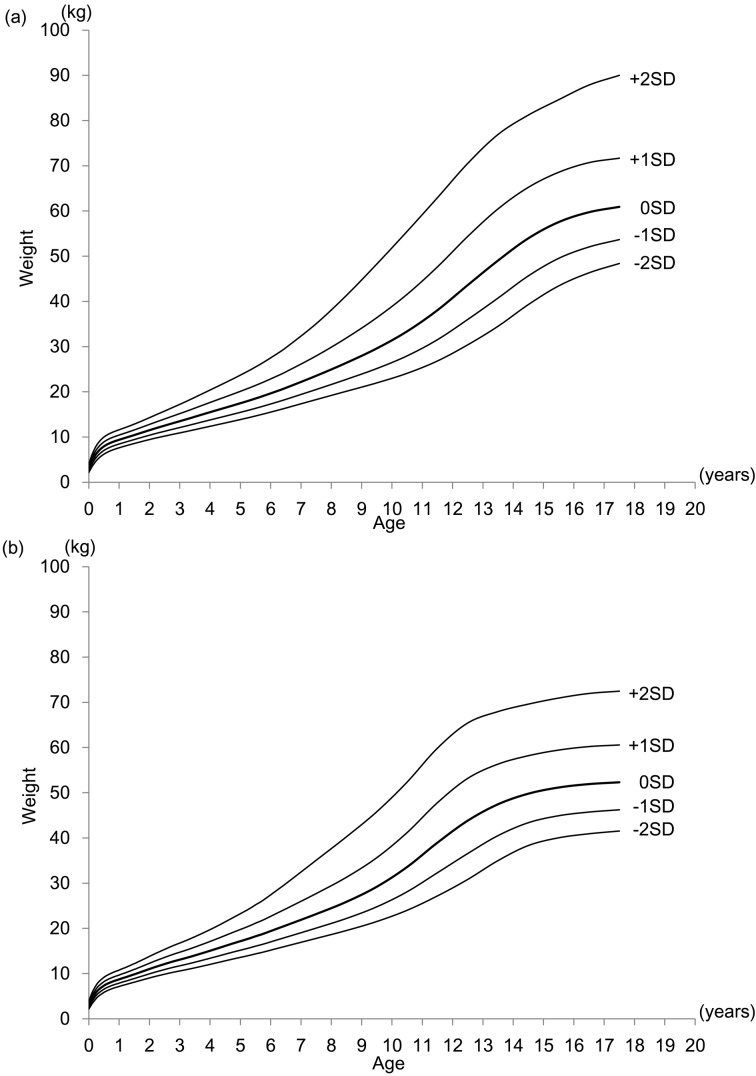
The values of smoothed L, M, and S for height and weight are shown in Tables 2 and 3, respectively. With these values, growth charts with mean and SD values were constructed, and these charts are presented in Fig. 1 (a, height for males; b, height for females) and Fig. 2 (a, weight for males; b, weight for females).
Table 2. LMS values of height for Japanese children.
Table 3. LMS values of weight for Japanese children.
Fig. 1.
Height growth charts with mean, ± 1 SD, and ± 2 SD lines (Z-score lines) for Japanese male (a) and female (b) children.
Fig. 2.
Weight growth charts with mean, ± 1 SD, and ± 2 SD lines (Z-score lines) for Japanese male (a) and female (b) children. It should be noted that the intervals between neighboring lines are not equal because of the skewed distribution of weight.
Discussion
We established growth standard charts with mean and SD values for Japanese children. They were constructed by the LMS method, which we believe is one of the most widely applied approaches (8). In addition, growth charts constructed by the LMS method allowed us to draw any kind of centile curve and convert measurements into an exact SD score (Z-score) by using the resulting L, M, and S curves. This means that values shown by percentiles can easily be converted to those with SD scores.
The new height chart is comparable to the existing practical height chart within ± 2 SD lines (5), but the values outside that range are slightly different. Therefore, physicians should be cautious in their judgments when considering adaptation of their patients’ measurements to the national medical aid program for specific pediatric chronic diseases.
On the other hand, the new weight chart is totally different from the existing practical weight chart (5). Although the practical chart was drawn under the hypothesis of a normal distribution for weight, the weight distribution is not generally normal. Thus, we constructed the new chart with mean and SD values to represent the actual weight distributions. Moreover, we could calculate SD scores from measurements using the L, M, and S values presented in this article, because the new chart is constructed by the LMS method. We recommend that physicians should use this new weight chart in their clinical practices.
In conclusion, our study provides growth standards for Japanese children with mean and SD values, which could be widely used in clinical practices and in public health examinations.
References
- 1.Hermanussen M. Auxology: an update. Horm Res Paediatr 2010;74: 153–64. doi: 10.1159/000317440 [DOI] [PubMed] [Google Scholar]
- 2.de Onis M, Wijnhoven TM, Onyango AW. Worldwide practices in child growth monitoring. J Pediatr 2004;144: 461–5. doi: 10.1016/j.jpeds.2003.12.034 [DOI] [PubMed] [Google Scholar]
- 3.Kato N, Murata M, Kawano M, Taniguchi T, Ohtake T. Growth standard for children from 0 up to 18 years of age. Shonihokenkenkyu 2004.05;63: 345–8 (in Japanese).
- 4.Cole TJ, Green PJ. Smoothing reference centile curves: the LMS method and penalized likelihood. Stat Med 1992;11: 1305–19. doi: 10.1002/sim.4780111005 [DOI] [PubMed] [Google Scholar]
- 5.Ito Y, Kato N, Tachibana K, Fujieda K. Practical tables and growth charts based on the criteria of the national medical aid program for specific pediatric chronic diseases. Shonikashinryo 2005;68: 1343–51(in Japanese). [Google Scholar]
- 6.Kato N, Takimoto H, Sudo N. The cubic functions for spline smoothed L, S and M values for BMI reference data of Japanese children. Clin Pediatr Endocrinol 2011;20: 47–9. doi: 10.1297/cpe.20.47 [DOI] [PMC free article] [PubMed] [Google Scholar]
- 7.Quo SK. Mathematical analysis of the growth of man, with special reference to Formosans. Hum Biol 1953;25: 333–58. [PubMed] [Google Scholar]
- 8.Wright EM, Royston P. A comparison of statistical methods for age-related reference intervals. J R Stat Soc Ser A Stat Soc 1997;160: 47–69. doi: 10.1111/1467-985X.00045 [DOI] [Google Scholar]


