

Abstract
Previous studies showed that better adherence to the Mediterranean diet (MD) is associated with lower risk of chronic diseases, but limited data are available on bone health. We investigated the association of the MD with bone mineral density (BMD) in Chinese adults. We included 2371 participants aged 40–75 years in this community-based cross-sectional study. Dietary information was assessed at baseline and a 3-year follow-up. Alternate Mediterranean diet (aMed) scores were calculated. BMD was determined at the second survey. After adjusting for potential covariates, higher aMed scores were positively and dose-dependently associated with BMD (all P-trends < 0.05). The BMD values were 1.94% (whole body), 3.01% (lumbar spine), 2.80% (total hip), 2.81% (femur neck), 2.62% (trochanter), and 2.85% (intertrochanter) higher in the quintile 5 (highest, vs. quintile 1) aMed scores for all of the subjects (all P-values < 0.05). Similar associations were found after stratifying by gender (P-interaction = 0.338–0.968). After excluding the five non-significant components of vegetables, legumes, fish, monounsaturated to saturated fat ratio, and alcohol intake from the aMed scores, the percentage mean differences were substantially increased by 69.1–150% between the extreme quintiles. In conclusion, increased adherence to the MD shows protective associations with BMD in Chinese adults.
Osteoporosis and relative fractures, characterized by low bone mass, present great economic and health challenges worldwide1. Increasing evidence has shown that nutritional factors may play an important role in the development and prevention of osteoporosis through its life-scope influence2. Epidemiology studies have suggested that various single foods or nutrients have protective (e.g., calcium and Vitamin D3, vegetables and fruits4) or detrimental (e.g., saturated fat5) effects on bone health. However, few studies have examined the associations of general dietary pattern(s) with bone health.
The Mediterranean diet (MD) is a habitual diet adhered to in Mediterranean countries (e.g., Greece, Italy). Many studies have shown that adherence to the MD is associated with a lower risk of many chronic diseases (e.g., coronary heart disease6, stroke6, cognitive disorders7 and some cancers8,9,10) in populations worldwide. These results have suggested that the MD may be beneficial in preventing a variety of chronic diseases. Although several studies have been done in Caucasians, while inconsistent results were found, and few studies have included Asians subjects. In the EPIC cohort study, Benetou et al. found that an increased adherence to the MD was associated with a 7% (95%CI: 2–11%) decrease in hip fracture incidence per 1-unit increase in the MD scores in 48,814 men and 139,981 women11. Similar association with calcareous bone mineral density (BMD) was observed in a cross-sectional study of 200 Spanish women12. However, the MD scores were found to have null associations with bone fractures in an 8-year prospective study of 1,482 French elders13 and with lumbar spine BMD in a cross-sectional study of 196 Greek women (48 ± 12 years)14. Data from other populations (e.g., Asian populations) with different habitual diet patterns are scarce in this field. Our groups recently reported a beneficial association between a high alternate Mediterranean diet (aMed) score and lower hip fracture risk in a case-control study15. However, whether the beneficial association between adherence to the MD and fracture risk is caused by a pre-protection of BMD remains unclear due to the small sample sizes of the aforementioned former studies. Moreover, the aMed scale was developed for general health, and it remains uncertain whether it can be improved for the assessment of bone health. Therefore, studies that focus on BMD are valuable and urgently required.
The purpose of this cross-sectional study was to investigate the association of the MD (assessed via aMed scores) with BMD at the whole body, lumbar spine, and hip sites in middle-aged and elderly Chinese.
Methods
Study Participants
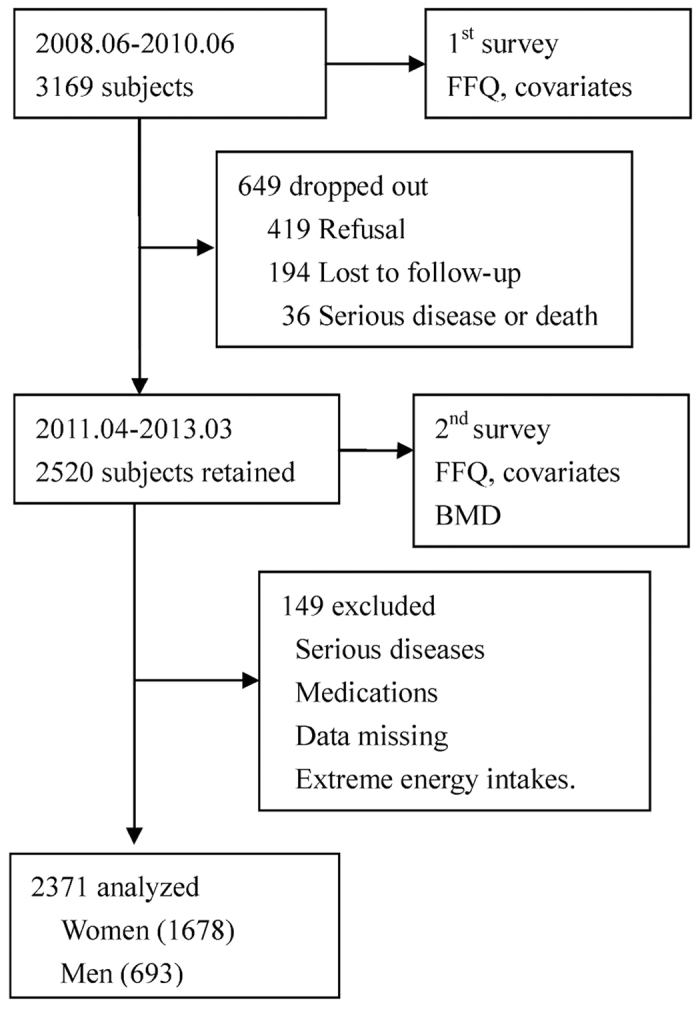
The study was based on the Guangzhou Nutrition and Health Study (GNHS), a community-based prospective cohort study designed to investigate the nutritional determinants of cardiometabolic outcomes and osteoporosis. We recruited 3,169 subjects aged 40–75 years who had lived in urban Guangzhou for more than 5 years via advertisements and subject referrals between June 2008 and June 2010. After about three years between April 2011 and March 2013, 2,520 subjects of them were followed up, while 649 subjects dropped out due to refusal (419 subjects), loss of contact or emigration (194 subjects), or serious disease or death (36 subjects). A questionnaire survey was conducted to collect habitual dietary intake and various covariates at both baseline and follow-up, and BMD was measured at follow-up only. We further excluded 149 subjects for the following reasons: (i) history of serious disease, such as malignancy or hyperthyroidism; (ii) history of medications for osteoporosis; (iii) missing core data; and (iv) extreme energy intakes (<800 or >4,200 kcal/d for men and <600 or >3,500 kcal/d for women). In the end, 2,371 subjects (containing 1,678 women and 693 men) who completed the two surveies and BMD measurements were included in the cross-sectional study (Fig. 1). All of the subjects provided written informed consent. This study was performed in accordance with relevant guidelines and regulations by the Ethics Committee of the School of Public Health at Sun Yat-sen University.
Figure 1. Flow chart of study participants.
Measurements and Data Collection
Subjects were invited to the School of Public Health at Sun Yat-sen University to provide relevant measurements and engage in face-to-face interviews at baseline and follow-up. Structured questionnaires were used to collect information related to demographics (e.g., age, gender, education, martial status, household income); habitual dietary intake; other lifestyle factors (e.g., smoking status, alcohol drinking, physical activities); and history of diseases, medications, and use of supplements (e.g., multivitamin use, calcium supplements use, oral estrogen). Current smokers were defined as those who smoked at least one cigarette per day for the last 6 months. Physical activity was measured and translated into MET·h/d as described previously16. The subjects’ heights and weights were measured with the subjects in a standing position wearing light clothing and no shoes. Their body mass indexes (BMIs, in kg/m2) were then calculated.
Assessment of Dietary Intake
A pre-validated 79-item food-frequency questionnaire (FFQ)17 was used to collect the subjects’ dietary information. The subjects were asked to report the frequencies (never, per year, per month, per week, and per day) and approximate portion sizes of the foods they consumed during the preceding year based on provided pictures. The average daily intake of total energy and specific nutrients were then calculated according to the China Food Composition Table 200218. Average values of the dietary data collected at baseline and follow-up were used for the calculation of the MD scores in the 2,371 subjects.
Alternate Mediterranean Diet (aMed) Score
Adapted from the MD score19 used by Fung et al.6, the aMed score reflects an adaptation of the principles of the traditional MD to non-Mediterranean countries. In this study, the score was calculated based on a scale including nine components: whole grains, vegetables (excluding potatoes), fruits (including juices), legumes, nuts, fish, ratio of monounsaturated fat (MUF) to saturated fat (SF), red and processed meats, and alcohol. All nine of these components were adjusted for the total energy intake using the residual method20. One (or zero) point was assigned to each component and the aMed score was calculated as described previously15. The total aMed score ranged from 0 to 9, and subjects with higher scores were considered to have adhered to a diet more resembling the MD. The Spearman correlation coefficient between the aMed scores at baseline and follow-up of the 2,371 followed subjects was 0.333 (P < 0.001).
BMD Assessment
BMD (g/cm2) at the whole body (WB), lumbar spine (LS), total hip (TH), femur neck (FN), trochanter (TR), intertrochanter (IN) and Ward’s triangle (WT) area sites was measured using dual-energy X-ray absorptiometry (DXA) (Discovery W, Hologic Inc., Waltham, MA, USA) and analyzed with Hologic Discovery software version 3.2 during the follow-up (April 2011 and March 2013). The in-vivo coefficients of variation of the duplicated BMD measurements in 30 subjects after repositioning were 1.18% (WB), 0.87% (LS), 1.02% (TH), 1.92% (FN), 1.82% (TR), and 2.35% (IN), respectively. The long-term CV of the measurements was 0.26%, a value found by testing the phantom daily between March 2011 and May 2015.
Statistical Analysis
Common characteristics were presented as means and standard deviations (SDs) for the continuous variables and as frequencies and percentages for the categorical variables.
The aMed scores were calculated by adding the point values assigned to each food group according to the gender-median intake cutoffs. Men and women had similarly distributed aMed scores and both were grouped into quintiles 1 (lowest) to 5 (highest) based on the points they received, i.e., 0–2, 3, 4, 5, and 6–9, respectively. We used multivariate analyses of covariance to compare the covariate-adjusted BMD means of the quintiles by aMed score. Two covariance models were used with Model I adjusted for age and sex, and Model II further adjusted for BMI, marital status, education, household income, smoking status, calcium supplement use, multivitamin use, physical activity, and daily total energy intake. Stratified analyses were performed according to gender, and years since menopause and use of estrogen were added as factors for females only. Bonferroni tests were conducted to make multiple comparisons between quintiles. A two-sided P-value < 0.05 was considered statistically significant. All of the analyses were performed with SPSS 17.0 for Windows (SPSS, Inc., Chicago, USA).
Results
Our study included 1,678 women and 693 men (Table 1). The mean (SD) age was 59.5 (4.7) years for women (96.8% of whom were postmenopausal) and 62.1 (5.2) years for men. As the aMed scores increased from quintiles 1 to 5 (highest), the subjects tended to have higher household incomes; be more educated; have higher dietary intakes of protein, carbohydrate, whole grain, vegetables, fruits, legumes, nuts, fish, MUF/SF, but lower intakes of total fat, saturated fat, MUF, and red and processed meats; be older; be married; be more likely to use multivitamin supplements; engage in more vigorous physical activity; and smoke less (all P-values < 0.05).
Table 1. Characteristics of study participants by quintile of aMed score.
| Quintile of aMed score for total subjectsa |
P-trend | |||||
|---|---|---|---|---|---|---|
| Q1 | Q2 | Q3 | >Q4 | Q5(highest) | ||
| N = 2371 | 448 | 478 | 502 | 495 | 448 | |
| aMed Score (range) | 0–2 | 3 | 4 | 5 | 6–9 | |
| Age, year | 59.7 (4.84) | 60.6 (4.89) | 60.2 (4.86) | 60.2 (4.86) | 60.7 (5.56) | 0.036 |
| Body mass index, kg/m2 | 23.3 (3.29) | 23.6 (3.15) | 23.3 (2.98) | 23.7 (3.14) | 23.7 (3.27) | 0.065 |
| Household income, N (%) | 0.002 | |||||
| <2000 Yuan·m−1 P−1 | 101 (22.5) | 86(18.0) | 84 (16.7) | 83 (16.8) | 75 (16.7) | |
| 2000–3000 Yuan·m−1· P−1 | 188 (42.0) | 202 (42.3) | 209 (41.6) | 193 (39.0) | 176 (39.3) | |
| >3000 Yuan·m−1· P−1 | 159 (35.5) | 190 (39.7) | 209 (41.6) | 219 (44.2) | 197 (44.0) | |
| Education, y | 0.036 | |||||
| <9 | 132 (29.5) | 147 (30.8) | 140 (27.9) | 117 (23.6) | 121 (27.0) | |
| 9–12 | 227 (50.7) | 215 (45.0) | 233 (46.4) | 253 (51.1) | 218 (48.7) | |
| >12 | 89 (19.9) | 116 (24.3) | 129 (25.7) | 125 (25.3) | 109 (24.3) | |
| Married, N (%) | 391 (87.3) | 425 (88.9) | 447 (89.0) | 445 (89.9) | 398 (88.8) | 0.167 |
| Smokerb, N (%) | 47 (10.5) | 44 (9.2) | 46 (9.2) | 39 (7.9) | 30 (6.7) | 0.033 |
| Calcium supplement user, N (%) | 116 (25.9) | 132 (27.6) | 162 (32.3) | 150 (30.3) | 139 (31.0) | 0.055 |
| Multivitamin regular use, N (%) | 68 (15.2) | 82 (17.2) | 89 (17.7) | 102 (20.6) | 94 (21.0) | 0.008 |
| Physical activityc, MET• h/d | 33.9 (5.50) | 33.4 (4.78) | 34.3 (5.70) | 34.1 (5.85) | 34.7 (6.08) | 0.007 |
| Dietary intaked | ||||||
| Energy intake, kkcal/d | 1.64 (0.41) | 1.64 (0.38) | 1.60 (0.39) | 1.65 (0.39) | 1.63 (0.40) | 0.685 |
| Protein, g/d | 67.2 (9.46) | 68.4 (10.2) | 70.3 (10.5) | 71.9 (10.8) | 72.5 (9.95) | <0.001 |
| Carbohydrate, g/d | 222 (35.4) | 223 (33.2) | 222 (33.9) | 225 (33.3) | 226 (29.2) | 0.050 |
| Total fat, g/d | 53.3 (11.6) | 53.3 (10.9) | 52.1 (10.6) | 51.9 (10.3) | 51.1 (9.50) | <0.001 |
| Saturated fat, g/d | 14.7 (3.48) | 14.2 (3.02) | 13.7 (2.91) | 13.4 (2.86) | 13.0 (2.63) | <0.001 |
| Monounsaturated fat, g/d | 20.4 (4.84) | 20.2 (4.51) | 19.6 (4.37) | 19.4 (4.19) | 19.0 (3.88) | <0.001 |
| Components of a Med score | ||||||
| Whole grainse, g/d | 7.76 (11.6) | 9.73 (10.4) | 11.8 (13.7) | 13.4 (10.0) | 15.8 (9.26) | <0.001 |
| Vegetables (excluded potatoes), g/d | 278 (93.9) | 313 (97.3) | 354 (115) | 398 (123) | 433 (118) | <0.001 |
| Fruits (included juices), g/d | 104 (64.2) | 124 (76.1) | 151 (99.6) | 162 (75.3) | 192 (75.2) | <0.001 |
| Legumes, g/d | 27.3 (17.2) | 35.9 (23.2) | 45.3 (29.8) | 48.8 (28.1) | 57.7 (27.6) | <0.001 |
| Nutsf, g/d | 1.24 (1.33) | 2.05 (2.30) | 2.53 (2.46) | 3.00 (2.78) | 3.59 (2.71) | <0.001 |
| Fish, g/d | 35.1 (20.8) | 42.1 (28.1) | 50.0 (37.0) | 58.0 (46.3) | 63.8 (35.0) | <0.001 |
| Monounsaturated to saturated fat ratio | 1.40 (0.12) | 1.43 (0.14) | 1.44 (0.14) | 1.45 (0.14) | 1.47 (0.13) | <0.001 |
| Red and processed meats, g/d | 96.4 (34.6) | 83.5 (34.3) | 77.3 (33.5) | 67.4 (29.8) | 58.6 (28.2) | <0.001 |
| Moderate alcohol drinker, N (%) | 0 (0.0) | 2 (0.4) | 1 (0.2) | 3 (0.6) | 2 (0.4) | 0.255 |
| Women, N | 319 | 333 | 367 | 343 | 316 | |
| Years since menopause, year | 9.49 (6.00) | 9.89 (5.94) | 9.28 (5.56) | 9.18 (5.77) | 9.81 (6.14) | 0.944 |
| Oestrogen user, N (%) | 11 (3.4) | 21 (6.3) | 26 (7.1) | 20 (5.8) | 21 (6.6) | 0.160 |
We presented continuous variables as Mean (SD) while categorical variables as frequencies (percentage). Linear trends were tested by ANOVA or Chi-square tests as appropriate.
aIncluding 693 men (62.1 ± 5.2, years) and 1,678 women (59.5 ± 4.7, years), 96.8% whom were postmenopausal women.
bSmoker were defined as those smoke ≥1 cigarettes daily for at least six consecutive months.
cPhysical activities included daily activities in occupation, leisure-time, and household-chores was calculated and translated into MET• h/d.
dDietary values presented here were energy-adjusted except for energy intake.
eRefers to non-refined cereals, such as graham bread, oats, cereal flakes, etc., calculated as dry weight.
fValues was calculated and expressed as proteins.
Higher aMed scores were positively and dose-dependently associated with higher BMDs at all of the bone sites (2.41–3.96% higher, quintile 5 vs. quintile 1, all P-values < 0.001), except Ward’s triangle area, after adjusting for age and gender in the subjects (Table 2). Similar associations were retained but slightly attenuated by other variables (e.g., BMI, education, smoking, physical activity, etc.) further adjusted in Model II. The BMD values were 1.94% (WB), 3.01% (LS), 2.80% (TH), 2.81% (FN), 2.62% (TR),and 2.85% (IN) higher in the top (vs. bottom) aMed score quintiles for all of the subjects (all P-values < 0.01). Similar associations were found in both women and men (P-interaction = 0.338–0.964) as shown in Table 3.
Table 2. Comparisons of covariate-adjusted mean of bone mineral density by quintiles of aMed scores.
| Quintiles of aMed scores |
%Diff.b | P-Diff | P-trend | |||||
|---|---|---|---|---|---|---|---|---|
| Q1 | Q2 | Q3 | Q4 | Q5(highest) | ||||
| aMed Score (range) | 0–2 | 3 | 4 | 5 | 6–9 | |||
| N (total 2371) | 448 | 478 | 502 | 495 | 448 | |||
| BMDa, g/cm2 | ||||||||
| Whole body | ||||||||
| Model Ic | 1.078 ± 0.005 | 1.089 ± 0.005 | 1.103 ± 0.004** | 1.104 ± 0.004** | 1.104 ± 0.005** | 2.41 | <0.001 | <0.001 |
| Model IId | 1.081 ± 0.005 | 1.089 ± 0.004 | 1.104 ± 0.004** | 1.102 ± 0.004** | 1.102 ± 0.005* | 1.94 | <0.001 | <0.001 |
| Lumbar Spine L1-4 | ||||||||
| Model Ic | 0.859 ± 0.007 | 0.879 ± 0.007 | 0.883 ± 0.006 | 0.892 ± 0.006** | 0.893 ± 0.007** | 3.96 | 0.003 | <0.001 |
| Model IId | 0.864 ± 0.006 | 0.879 ± 0.006 | 0.886 ± 0.006 | 0.888 ± 0.006 | 0.890 ± 0.006* | 3.01 | 0.030 | 0.003 |
| Total Hip | ||||||||
| Model Ic | 0.817 ± 0.005 | 0.824 ± 0.005 | 0.837 ± 0.005* | 0.843 ± 0.005** | 0.847 ± 0.005***¶ | 3.67 | <0.001 | <0.001 |
| Model IId | 0.821 ± 0.005 | 0.824 ± 0.005 | 0.839 ± 0.004 | 0.839±0.005 | 0.844 ± 0.005**¶ | 2.80 | 0.001 | <0.001 |
| Femur neck | ||||||||
| Model Ic | 0.673 ± 0.005 | 0.684 ± 0.005 | 0.691 ± 0.005 | 0.700 ± 0.005** | 0.699 ± 0.005** | 3.86 | <0.001 | <0.001 |
| Model IId | 0.677 ± 0.005 | 0.685 ± 0.004 | 0.693 ± 0.004 | 0.697 ± 0.004* | 0.696 ± 0.005* | 2.81 | 0.008 | <0.001 |
| Trochanter | ||||||||
| Model Ic | 0.607 ± 0.004 | 0.613 ± 0.004 | 0.620 ± 0.004 | 0.623 ± 0.004* | 0.628 ± 0.004** | 3.86 | 0.002 | <0.001 |
| Model IId | 0.610 ± 0.004 | 0.613 ± 0.004 | 0.621 ± 0.004 | 0.621 ± 0.004 | 0.626 ± 0.004* | 2.62 | 0.018 | 0.001 |
| Intertrochanter | ||||||||
| Model Ic | 0.978 ± 0.006 | 0.987 ± 0.006 | 1.005 ± 0.006* | 1.011±0.006** | 1.015 ± 0.006***¶ | 3.78 | <0.001 | <0.001 |
| Model IId | 0.983 ± 0.006 | 0.987 ± 0.006 | 1.008 ± 0.006* | 1.006 ± 0.006* | 1.011 ± 0.006**¶ | 2.85 | 0.001 | <0.001 |
| Ward’s triangle | ||||||||
| Model Ic | 0.491 ± 0.006 | 0.499 ± 0.006 | 0.509 ± 0.006 | 0.516 ± 0.006* | 0.512 ± 0.006 | 4.28 | 0.016 | 0.002 |
| Model IId | 0.495 ± 0.006 | 0.500 ± 0.006 | 0.510 ± 0.005 | 0.513 ± 0.005 | 0.509 ± 0.006 | 2.83 | 0.137 | 0.024 |
aMean ± SE.
b%Diff: percentage difference = (Q5 − Q1)/Q1 × 100%.
cModel I: adjusted for age and gender.
dModel II: further adjusted for body mass index, martial status, education status, household income, smoking status, calcium supplements use, multivitamin use, physical activities, daily energy intake.*p < 0.05, **p < 0.01, ***p < 0.001, compared with Q1.
¶p < 0.05,
compared with Q2.
Table 3. Comparisons of covariate-adjusted mean of bone mineral density by quintiles of aMed scores stratified by gender.
| quintiles of diet-quality scores |
%Diff.b | P-Diff. | P-trend | P for interaction | |||||
|---|---|---|---|---|---|---|---|---|---|
| >Q1 | Q2 | Q3 | Q4 | Q5(highest) | |||||
| aMed Score (range) | 0–2 | 3 | 4 | 5 | 6–9 | ||||
| Men | |||||||||
| N = 693 | 129 | 145 | 135 | 152 | 132 | ||||
| BMDa, g/cm2 | |||||||||
| Whole body | 1.161 ± 0.009 | 1.175 ± 0.008 | 1.198 ± 0.009 | 1.180 ± 0.008 | 1.187 ± 0.009 | 2.24 | 0.042 | 0.037 | 0.489 |
| Lumbar Spine L1-4 | 0.944 ± 0.013 | 0.955 ± 0.012 | 0.980 ± 0.012 | 0.957 ± 0.012 | 0.974 ± 0.013 | 3.18 | 0.227 | 0.124 | 0.338 |
| Total Hip | 0.892 ± 0.009 | 0.896 ± 0.009 | 0.921 ± 0.009 | 0.915 ± 0.009 | 0.918 ± 0.009 | 2.91 | 0.072 | 0.015 | 0.725 |
| Femur neck | 0.733 ± 0.009 | 0.742 ± 0.009 | 0.753 ± 0.009 | 0.755 ± 0.008 | 0.753 ± 0.009 | 2.73 | 0.344 | 0.066 | 0.964 |
| Trochanter | 0.658 ± 0.008 | 0.658 ± 0.008 | 0.676 ± 0.008 | 0.671 ± 0.007 | 0.675 ± 0.008 | 2.58 | 0.262 | 0.065 | 0.714 |
| Intertrochanter | 1.063 ± 0.011 | 1.070±0.011 | 1.102 ± 0.011 | 1.089±0.010 | 1.091 ± 0.011 | 2.63 | 0.079 | 0.034 | 0.752 |
| Ward’s triangle | 0.510 ± 0.011 | 0.510 ± 0.011 | 0.525 ± 0.011 | 0.526 ± 0.010 | 0.518 ± 0.011 | 1.59 | 0.723 | 0.382 | 0.968 |
| Women | |||||||||
| N = 1678 | 319 | 333 | 367 | 343 | 316 | ||||
| BMDa, g/cm2 | |||||||||
| Whole body | 1.048 ± 0.005 | 1.055 ± 0.005 | 1.065 ± 0.005 | 1.069 ± 0.005 | 1.067 ± 0.005 | 1.81 | 0.023 | 0.002 | |
| Lumbar Spine L1-4 | 0.832 ± 0.007 | 0.850 ± 0.007 | 0.846 ± 0.007 | 0.859 ± 0.007 | 0.856 ± 0.007 | 2.88 | 0.069 | 0.012 | |
| Total Hip | 0.793 ± 0.005 | 0.795 ± 0.005 | 0.805 ± 0.005 | 0.807 ± 0.005 | 0.813 ± 0.005 | 2.40 | 0.056 | 0.003 | |
| Femur neck | 0.656 ± 0.005 | 0.662 ± 0.005 | 0.667 ± 0.005 | 0.672 ± 0.005 | 0.673 ± 0.005 | 2.59 | 0.090 | 0.006 | |
| Trochanter | 0.591 ± 0.004 | 0.595 ± 0.004 | 0.598 ± 0.004 | 0.599 ± 0.004 | 0.607 ± 0.004 | 2.71 | 0.136 | 0.010 | |
| Intertrochanter | 0.952 ± 0.007 | 0.954 ± 0.007 | 0.969 ± 0.006 | 0.971 ± 0.007 | 0.978 ± 0.007 | 2.73 | 0.026 | 0.001 | |
| Ward’s triangle | 0.491 ± 0.007 | 0.496 ± 0.006 | 0.503 ± 0.006 | 0.506 ± 0.006 | 0.506 ± 0.007 | 3.05 | 0.379 | 0.052 | |
All analyses were adjusted for age, body mass index, marital status, education status, household income, smoking status, calcium supplement use, multivitamin use, physical activity, and daily energy intake. For women, years since menopause and oral estrogen use were further adjusted.
aMean ± SE.
b%Diff.: percentage difference = (Q5 − Q1)/Q1 × 100%.
We also examined the associations between each aMed component and BMD. Of the nine components, higher intakes of whole grain, fruit, nuts, and a lower intake of red and processed meats were significantly associated with a higher BMD at several bone sites. No significant associations were found for the other five components (vegetable, legume, fish, MUF/SF, and alcohol) in this study (Supplemental Table 1). After excluding the non-significant components from the calculation of the aMed scores, more significant associations were observed. The mean difference percentages increased by 121% (WB), 117% (LS), 70.0% (TH), 93.6% (FN), 69.1% (TR), 82.5% (IN), and 150% (WT) between the extreme quintiles (Table 4).
Table 4. Comparisons of covariate-adjusted mean of bone mineral density by different aMed models (N = 2371).
| Whole body | Lumbar spine | Total hip | Femur neck | Trochanter | Intertrochanter | Ward’s triangle | |
|---|---|---|---|---|---|---|---|
| BMD, g/cm2a | |||||||
| aMed score, Model I | |||||||
| Quintiles 1a | 1.081 ± 0.005 | 0.864 ± 0.006 | 0.821 ± 0.005 | 0.677 ± 0.005 | 0.610 ± 0.004 | 0.983 ± 0.006 | 0.495 ± 0.006 |
| Quintiles 5 (highest) Diff.b | 0.021 ± 0.005 | 0.026 ± 0.006 | 0.023 ± 0.005 | 0.024 ± 0.005 | 0.016 ± 0.004 | 0.028 ± 0.006 | 0.014 ± 0.006 |
| %Diff. Ic | 1.94* | 3.01* | 2.80** | 2.81* | 2.62** | 2.85** | 2.83 |
| aMed score, Model II | |||||||
| Quintiles 1a | 1.083 ± 0.004 | 0.870 ± 0.006 | 0.822 ± 0.004 | 0.680 ± 0.004 | 0.611 ± 0.003 | 0.985 ± 0.005 | 0.497 ± 0.004 |
| Quintiles 5 (highest) Diff.b | 0.018 ± 0.004 | 0.021 ± 0.005 | 0.022 ± 0.004 | 0.018±0.004 | 0.016 ± 0.003 | 0.026 ± 0.004 | 0.017 ± 0.004 |
| %Diff. IIc | 1.66** | 2.41** | 2.67** | 2.65** | 2.62** | 2.64** | 3.42 |
| aMed score, Model III | |||||||
| Quintiles 1a | 1.082 ± 0.004 | 0.866 ± 0.005 | 0.822 ± 0.004 | 0.677 ± 0.004 | 0.610 ± 0.003 | 0.984 ± 0.005 | 0.495 ± 0.005 |
| Quintiles 5 (highest) Diff.b | 0.023 ± 0.004 | 0.025±0.005 | 0.024 ± 0.004 | 0.022 ± 0.004 | 0.017 ± 0.003 | 0.029 ± 0.003 | 0.018 ± 0.003 |
| %Diff. IIIc | 2.13*** | 2.89** | 2.92*** | 3.25*** | 2.79** | 2.95** | 3.64 |
| aMed score, Model IV | |||||||
| Quintiles 1a | 1.081 ± 0.004 | 0.866 ± 0.005 | 0.820 ± 0.004 | 0.677 ± 0.004 | 0.610 ± 0.003 | 0.981 ± 0.005 | 0.494 ± 0.005 |
| Quintiles 5 (highest) Diff.b | 0.020 ± 0.004 | 0.025 ± 0.006 | 0.024 ± 0.004 | 0.021 ± 0.004 | 0.015 ± 0.003 | 0.031 ± 0.005 | 0.016 ± 0.005 |
| %Diff. IVc | 1.85** | 2.89** | 2.93*** | 3.10** | 2.46* | 3.16*** | 3.24 |
| aMed score, Model V | |||||||
| Quintiles 1a | 1.082 ± 0.004 | 0.869±0.005 | 0.821 ± 0.004 | 0.680 ± 0.004 | 0.611 ± 0.003 | 0.982 ± 0.005 | 0.495 ± 0.005 |
| Quintiles 5 (highest) Diff.b | 0.022 ± 0.004 | 0.020 ± 0.006 | 0.020 ± 0.004 | 0.017 ± 0.004 | 0.013 ± 0.004 | 0.026 ± 0.005 | 0.015 ± 0.005 |
| %Diff. Vc | 2.03** | 2.30 | 2.44** | 2.50* | 2.13 | 2.65** | 3.03 |
| aMed score, Model VI | |||||||
| Quintiles 1a | 1.080±0.005 | 0.864 ± 0.006 | 0.821 ± 0.005 | 0.677 ± 0.005 | 0.610 ± 0.004 | 0.983 ± 0.006 | 0.495 ± 0.005 |
| Quintiles 5 (highest) Diff.b | 0.022 ± 0.004 | 0.027 ± 0.006 | 0.023 ± 0.004 | 0.019 ± 0.004 | 0.017 ± 0.004 | 0.028 ± 0.005 | 0.014±0.005 |
| %Diff. VIc | 2.03** | 3.11* | 2.80** | 2.79* | 2.78* | 2.85** | 2.83 |
| aMed score, Model VII | |||||||
| Quintiles 1a | 1.076 ± 0.007 | 0.857 ± 0.009 | 0.820 ± 0.007 | 0.680 ± 0.006 | 0.610 ± 0.006 | 0.980 ± 0.008 | 0.495 ± 0.008 |
| Quintiles 5 (highest) Diff.b | 0.046±0.007 | 0.056 ± 0.009 | 0.039 ± 0.007 | 0.037 ± 0.006 | 0.027 ± 0.006 | 0.051 ± 0.008 | 0.035 ± 0.008 |
| %Diff. VIIc | 4.28*** | 6.53*** | 4.76*** | 5.44*** | 4.43** | 5.20*** | 7.07* |
| %Diff. incrementd | 121 | 117 | 70.0 | 93.6 | 69.1 | 82.5 | 150 |
All analyses were adjusted for age, body mass index, marital status, education status, household income, smoking status, calcium supplement use, multivitamin use, physical activity, and daily energy intake. In Model I, aMed scores were constructed by the original 9 components (whole grain, vegetables excluded potato, fruits include juices, legumes, nuts, fish, monounsaturated to saturated fat ratio, red and processed meat, and moderate alcohol consume). Vegetable, legumes, fish, monounsaturated to saturated ratio, moderate alcohol consume was each excluded from Model I in Model II, III, IV, V, VI, respectively, and excluded together in the Model VII. Score ranges from 0–9, 0–8, 0–8, 0–8, 0–8, 0–8, and 0–4, respectively in Model I–VII.
aMean ± SE.
bMean difference (Q5–Q1) ± SE.
c%Diff.: percentage difference = (Q5-Q1)/Q1 × 100%.
d%Diff. increment = ([%Diff.VII–%Diff.I])/%Diff.I) × 100%. *p < 0.05, **p < 0.01, ***p < 0.001, compared with Q1.
Discussion
A favorable association between adherence to the MD and BMD was observed in a large community-based cross-sectional study of middle-aged and elderly Chinese. Our findings suggested that the aMed scale is a useful index for assessing appropriate diet quality for BMD. The results highlighted the potential importance of adherence to the MD in improving bone health.
Although the MD has been associated with a lower risk of many chronic diseases in populations worldwide, its association with bone health and especially BMD is less well known. The favorable associations observed in our study were consistent with those in several other studies but not all studies. Increased adherence to the MD was associated with a 7% (95%CI: 0.02–0.11) decrease in hip fracture incidence per 1-unit increase in the MD scores in 48,814 men and 139,981 women (49 ± 11 years) at a 9-year follow-up in the EPIC study11. Our group recently found a similar favorable association between higher aMed scores and a lower risk of hip fracture (OR 0.28, 95%CI 0.18–0.43) in a case-control study of 726 pairs (case/control) of elderly Chinese subjects (55–80 years)15. A similar protective association with calcareous bone BMD (P-trend = 0.001) was also observed in a cross-sectional study of 200 Spanish women12. However, null associations were found with the risk of hip, vertebral, and waist fractures in 1,482 French elders (>65 years) in an 8-year prospective study13 and with lumbar spine BMD in another cross-sectional study of 196 Greek women (48 ± 12 years)14. The non-significant results of these two studies might have been caused by their smaller sample sizes, discrepancies in the different methods or indexes used to assess adherence to the MD, or diverse outcomes at the different sites. Data from Asian subjects in this field are scarce. Nevertheless, the favorable associations between the aMed scores and BMD and the risk of hip fracture found in this study and in our previous study of Chinese adults highlights the importance and potential practical value of the MD in improving BMD and preventing hip fractures in Chinese populations.
Of the nine individual components of the aMed score, four were associated with BMD in this study. Higher intakes of whole grains, fruits, and nuts and a lower intake of red and processed meat were independently associated with higher levels of BMD at several bone sites. Consistent with our results, many studies have associated sufficient intakes of plant foods and their phytonutrients and lower intakes of red and processed meat in diets with a higher BMD12,21,22,23,24. However, although they have shown beneficial associations in other studies, the other five components (vegetable, legume, fish, MUF/SF, and moderate alcohol consumption) showed no independent associations with BMD in this study5,25,26,27,28. The binary classification might attenuate the associations between these nutrients and BMD. Besides, the low intakes of legume and plant-based MUF and the “bottom-up” pattern (either never or excessive drinking) of alcohol drinking might have partly accounted for the null association in this population. Moreover, when we ruled out the five non-significant components from the original score, the favorable associations between the aMed score and BMD tended to be more significant. Our findings suggested that the aMed score may need to be improved to evaluate bone-specific diet quality among different populations. Additional longitudinal studies are required to clarify this issue.
The favorable associations between these components of the aMed score and BMD may result from their nutrients and other nutritional components. For example, calcium; potassium29; vitamins B30, C31, and K32; carotenoids33, and flavonoids34 rich in fruits; and Vitamin E rich in nuts35 showed beneficial associations with BMD as previously reported. In addition, the MD may prevent osteoporosis through an anti-inflammatory path. Better adherence to the MD was associated with lower levels of several pro-inflammatory cytokines (e.g., C-reactive protein and interleukin-6)36,37. Overproduction of these pro-inflammatory cytokines was associated with higher osteoclastic bone resorption rates and an increased risk of osteoporosis38. Moreover, the MD may provide oxidation resistance against oxidative stress and reactive oxygen species39, which inhibits the differentiation of osteoblastic cells and plays an important role in the development of osteoporosis40.
This study has several strengths. First, to our knowledge, it is the first study to examine the association between the MD (aMed scores) and BMD based on a large sample size. Second, the averages of dietary data were used for analyses in this study, providing a better estimation of the intake situation at follow-up. Finally, BMD was scanned at multiple sites, which enabled us to achieve a full-scale understanding of the association.
Our study has several limitations. First, the cross-sectional design could not infer a causal association, although we used average values of dietary intake to better estimate habitual consumption over the period before the BMD assessment, attenuating the possibility of causal inversion. Second, although we carefully adjusted for a variety of BMD-related confounders, residual cofounding might still nevertheless occurred in our study due to measurement errors and the limited number of covariates that could be measured. Finally, the subjects, who were recruited as volunteers, might have led healthy lifestyles or engaged in healthy activities. However, health-related factors, economic and education statuses, smoking, and the use of calcium supplements and multivitamins did not significantly modify the aMed-BMD association (P-interaction range: 0.051–0.877).
In conclusion, we found that better adherence to the MD (indicated by higher aMed scores) was favorably associated with BMD in middle-aged and elderly Chinese. The associations tended to be more significant when five non-significant components were excluded. The results suggest that bone-specific MD scores may be required to evaluate bone-related diet quality in this population. Large-scale and long-term prospective studies are required to better address these results.
Additional Information
How to cite this article: Chen, G.-d. et al. Adherence to the Mediterranean diet is associated with a higher BMD in middle-aged and elderly Chinese. Sci. Rep. 6, 25662; doi: 10.1038/srep25662 (2016).
Supplementary Material
Acknowledgments
This study was jointly supported by the National Natural Science Foundation of China (No. 81273049 and No. 81472965), the 5010 Program for Clinical Researches (No. 2007032) of the Sun Yat-sen University (Guangzhou, China), and Danone Institute China Diet Nutrition Research & Communication Grant in 2012.
Footnotes
Author Contributions Y.M.C. conceived and designed the study, and critically revised the manuscript; G.D.C. analyzed the data and wrote the paper; G.D.C., X.W.D., Y.Y.Z., H.Y.T. and J.H. collected the data. Y.M.C. obtained the funding.
References
- Tella S. H. & Gallagher J. C. Prevention and treatment of postmenopausal osteoporosis. J Steroid Biochem Mol Biol 142, 155–170 (2014). [DOI] [PMC free article] [PubMed] [Google Scholar]
- Kitchin B. & Morgan S. Nutritional considerations in osteoporosis. Curr Opin Rheumatol 15, 476–480 (2003). [DOI] [PubMed] [Google Scholar]
- Bonjour J. P., Gueguen L., Palacios C., Shearer M. J. & Weaver C. M. Minerals and vitamins in bone health: the potential value of dietary enhancement. Br J Nutr 101, 1581–1596 (2009). [DOI] [PubMed] [Google Scholar]
- McTiernan A. et al. Low-fat, increased fruit, vegetable, and grain dietary pattern, fractures, and bone mineral density: the Women’s Health Initiative Dietary Modification Trial. Am J Clin Nutr 89, 1864–1876 (2009). [DOI] [PMC free article] [PubMed] [Google Scholar]
- Corwin R. L., Hartman T. J., Maczuga S. A. & Graubard B. I. Dietary saturated fat intake is inversely associated with bone density in humans: analysis of NHANES III. J Nutr 136, 159–165 (2006). [DOI] [PubMed] [Google Scholar]
- Fung T. T. et al. Mediterranean diet and incidence of and mortality from coronary heart disease and stroke in women. Circulation 119, 1093–1100 10.1161/CIRCULATIONAHA.108.816736. (2009). [DOI] [PMC free article] [PubMed] [Google Scholar]
- Feart C., Samieri C. & Barberger-Gateau P. Mediterranean diet and cognitive health: an update of available knowledge. Curr Opin Clin Nutr Metab Care 18, 51–62 (2015). [DOI] [PubMed] [Google Scholar]
- Bamia C. et al. Mediterranean diet and colorectal cancer risk: results from a European cohort. Eur J Epidemiol 28, 317–328 (2013). [DOI] [PubMed] [Google Scholar]
- Praud D. et al. Adherence to the Mediterranean diet and gastric cancer risk in Italy. Int J Cancer 134, 2935–2941 (2014). [DOI] [PubMed] [Google Scholar]
- Filomeno M. et al. The role of a Mediterranean diet on the risk of oral and pharyngeal cancer. Br J Cancer 111, 981–986 (2014). [DOI] [PMC free article] [PubMed] [Google Scholar]
- Benetou V. et al. Mediterranean diet and incidence of hip fractures in a European cohort. Osteoporos Int 4, 1587–1598 (2013). [DOI] [PubMed] [Google Scholar]
- Rivas A. et al. Mediterranean diet and bone mineral density in two age groups of women. Int J Food Sci Nutr 64, 155–161 (2013). [DOI] [PubMed] [Google Scholar]
- Feart C. et al. Adherence to a Mediterranean diet and risk of fractures in French older persons. Osteoporos Int 24, 3031–3041 (2013). [DOI] [PubMed] [Google Scholar]
- Kontogianni M. D. et al. Association between dietary patterns and indices of bone mass in a sample of Mediterranean women. Nutrition 25, 165–171 (2009). [DOI] [PubMed] [Google Scholar]
- Zeng F. F. et al. Diet-quality scores and risk of hip fractures in elderly urban Chinese in Guangdong, China: a case-control study. Osteoporos Int 25, 2131–2141 (2014). [DOI] [PubMed] [Google Scholar]
- Zhang Z. Q. et al. Comparison of various anthropometric and body fat indices in identifying cardiometabolic disturbances in Chinese men and women. PLoS One 8, e70893 (2013). [DOI] [PMC free article] [PubMed] [Google Scholar]
- Zhang C. X. & Ho S. C. Validity and reproducibility of a food frequency Questionnaire among Chinese women in Guangdong province. Asia Pac J Clin Nutr 18, 240–250 (2009). [PubMed] [Google Scholar]
- Yang Y. G., Wang G. Y. & Pan X. C. China Food Composition 2002. (Peking University Medical Press, Beijing, 2002).
- Trichopoulou A., Costacou T., Bamia C. & Trichopoulos D. Adherence to a Mediterranean diet and survival in a Greek population. N Engl J Med 348, 2599–2608 (2003). [DOI] [PubMed] [Google Scholar]
- Willett W. & Stampfer M. J. Total energy intake: implications for epidemiologic analyses. Am J Epidemiol 124, 17–27 (1986). [DOI] [PubMed] [Google Scholar]
- Mangano K. M. et al. Bone Mineral Density and Protein-Derived Food Clusters from the Framingham Offspring Study. J Acad Nutr Diet 115, 1605- 1613 (2015). [DOI] [PMC free article] [PubMed] [Google Scholar]
- Liu Z. M. et al. Greater fruit intake was associated with better bone mineral status among Chinese elderly men and women: results of Hong Kong Mr. Os and Ms. Os studies. J Am Med Dir Assoc 16, 309–315 (2015). [DOI] [PubMed] [Google Scholar]
- Shin S. & Joung H. A dairy and fruit dietary pattern is associated with a reduced likelihood of osteoporosis in Korean postmenopausal women. Br J Nutr 110, 1926–1933 (2013). [DOI] [PubMed] [Google Scholar]
- Karamati M., Jessri M., Shariati-Bafghi S. E. & Rashidkhani B. Dietary patterns in relation to bone mineral density among menopausal Iranian women. Calcif Tissue Int 91, 40–49 (2012). [DOI] [PubMed] [Google Scholar]
- Farina E. K. et al. Protective effects of fish intake and interactive effects of long-chain polyunsaturated fatty acid intakes on hip bone mineral density in older adults: the Framingham Osteoporosis Study. Am J Clin Nutr 93, 1142–1151 (2011). [DOI] [PMC free article] [PubMed] [Google Scholar]
- Martinez-Ramirez M. J. et al. Dietary fat intake and the risk of osteoporotic fractures in the elderly. Eur J Clin Nutr 61, 1114–1120 (2007). [DOI] [PubMed] [Google Scholar]
- Tucker K. L. et al. Effects of beer, wine, and liquor intakes on bone mineral density in older men and women. Am J Clin Nutr 89, 1188–1196 (2009). [DOI] [PMC free article] [PubMed] [Google Scholar]
- Perez-Lopez F. R., Chedraui P., Haya J. & Cuadros J. L. Effects of the Mediterranean diet on longevity and age-related morbid conditions. Maturitas 64, 67–79 (2009). [DOI] [PubMed] [Google Scholar]
- Zhu K., Devine A. & Prince R. L. The effects of high potassium consumption on bone mineral density in a prospective cohort study of elderly postmenopausal women. Osteoporos Int 20, 335–340 (2009). [DOI] [PubMed] [Google Scholar]
- McLean R. R. et al. Plasma B vitamins, homocysteine, and their relation with bone loss and hip fracture in elderly men and women. J Clin Endocrinol Metab 93, 2206–2212 (2008). [DOI] [PMC free article] [PubMed] [Google Scholar]
- Kim Y. A. et al. Favorable effect of dietary vitamin C on bone mineral density in postmenopausal women (KNHANES IV, 2009): discrepancies regarding skeletal sites, age, and vitamin D status. Osteoporos Int 26, 2329–2337 (2015). [DOI] [PubMed] [Google Scholar]
- Hamidi M. S., Gajic-Veljanoski O. & Cheung A. M. Vitamin K and bone health. J Clin Densitom 16, 409–413 (2013). [DOI] [PubMed] [Google Scholar]
- Chen G. D. et al. Association of dietary consumption and serum levels of vitamin A and beta-carotene with bone mineral density in Chinese adults. Bone 79, 110–115 (2015). [DOI] [PubMed] [Google Scholar]
- Zhang Z. Q. et al. Association between dietary intake of flavonoid and bone mineral density in middle aged and elderly Chinese women and men. Osteoporos Int 25, 2417–2425 (2014). [DOI] [PubMed] [Google Scholar]
- Mata-Granados J. M., Cuenca-Acebedo R., Luque de Castro M. D. & Quesada Gomez J. M. Lower vitamin E serum levels are associated with osteoporosis in early postmenopausal women: a cross-sectional study. J Bone Miner Metab 31, 455–460 (2013). [DOI] [PubMed] [Google Scholar]
- Dai J. et al. Adherence to the mediterranean diet is inversely associated with circulating interleukin-6 among middle-aged men: a twin study. Circulation 117, 169–175 (2008). [DOI] [PMC free article] [PubMed] [Google Scholar]
- Esposito K. et al. Effect of a mediterranean-style diet on endothelial dysfunction and markers of vascular inflammation in the metabolic syndrome: a randomized trial. JAMA 292, 1440–1446 (2004). [DOI] [PubMed] [Google Scholar]
- Mundy G. R. Osteoporosis and inflammation. Nutrition reviews 65, S147–151 (2007). [DOI] [PubMed] [Google Scholar]
- Pitsavos C. et al. Adherence to the Mediterranean diet is associated with total antioxidant capacity in healthy adults: the ATTICA study. Am J Clin Nutr 82, 694–699 (2005). [DOI] [PubMed] [Google Scholar]
- Wilson C. Bone: Oxidative stress and osteoporosis. Nature reviews. Endocrinology 10, 3 (2014). [DOI] [PubMed] [Google Scholar]
Associated Data
This section collects any data citations, data availability statements, or supplementary materials included in this article.