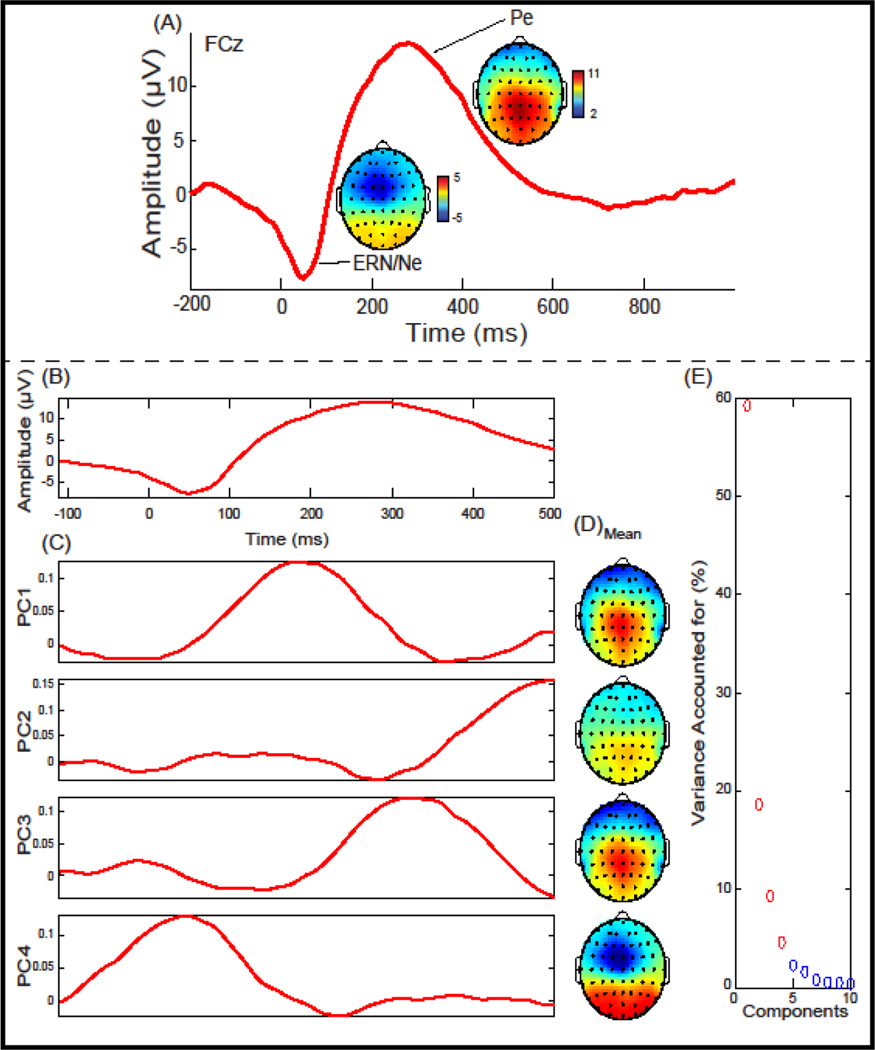
Figure 1.
Response-locked event-related potential (ERP) and Principal Component Analysis (PCA) for False Alarms plotted at FCz: (A) Grand average ERP waveform plotted at FCz. ERP components of interest (ERN/Ne & Pe) and topographical depictions are identified. (B) The Grand average waveform and window used in the principal component analysis. (C) Principal components extracted accounting for 91.79% of the variance. (D) Topographical depiction of the mean spatial distribution for each principal component. (E) Scree plot of singular values which was used to determine a four-component solution.

