

Abstract
Purkinje cell (PC) firing represents the sole output from the cerebellar cortex onto the deep cerebellar and vestibular nuclei. Here, we explored the different modes of PC firing in alert mice by extracellular recording. We confirm the existence of a tonic and/or bursting and quiescent modes corresponding to UP and DOWN state, respectively. We demonstrate the existence of a novel 600-Hz buzz UP state of firing characterized by simple spikes (SS) of very small amplitude. Climbing fiber (CF) input is able to switch the 600-Hz buzz to the DOWN state, as for the classical UP-to-DOWN state transition. Conversely, the CF input can initiate a typical SS pattern terminating into 600-Hz buzz. The 600-Hz buzz was transiently suppressed by whisker pad stimulation demonstrating that it remained responsive to peripheral input. It must not be mistaken for a DOWN state or the sign of PC inhibition. Complex spike (CS) frequency was increased during the 600-Hz buzz, indicating that this PC output actively contributes to the cerebello-olivary loop by triggering a disinhibition of the inferior olive. During the 600-Hz buzz, the first depolarizing component of the CS was reduced and the second depolarizing component was suppressed. Consistent with our experimental observations, using a 559-compartment single-PC model – in which PC UP state (of about −43 mV) was obtained by the combined action of large tonic AMPA conductances and counterbalanclng GABAarglc Inhibition – removal of this inhibition produced the 600-Hz buzz; the simulated buzz frequency decreased following an artificial CS.
Keywords: cerebellum, Purkinje cells, 600 Hz, bistability, simple spike, complex spike
INTRODUCTION
Purkinje cell (PC) firing represents the sole output from the cerebellar cortex onto the deep cerebellar and vestibular nuclei. In vivo and in vitro PC spontaneous simple spikes (SS) firing can occur in three distinct modes, namely tonic, bursting or silent (Llinás and Sugimori, 1980; Womack and Khodakhah, 2002; Swensen and Bean, 2003; Servais et al., 2004). These patterns can be readily detected by extracellular recording. In the tonic mode, SS are fired irregularly at about 50—80 Hz and may be interrupted by brief pause of about 15 ms induced by complex spike (CS) (Schiffmann et al., 1999; Servais et al., 2004; Cheron et al., 2009). This pause may be followed by a long-lasting (~500 ms) inhibition or facilitation of SS (McDevitt et al., 1982). The tonic mode can be suddenly disrupted, giving rise to bursting, which can be rhythmic or irregular.
In extracellular recording, the silent mode of firing is characterized by virtual absence of SS and is ascertained by the occurrence of CS at a frequency of about 0.5–1.0 Hz, confirming that a PC is being recorded. The SS mode of firing is influenced by both intrinsic factors and synaptic modulation. Intrinsic excitability is driven by resurgent Na+ channels (Raman and Bean, 1997), voltage-gated Ca2+ channels, and Ca2+-activated K+ channels (Llinás and Sugimori, 1980; Edgerton and Reinhart, 2003; Swensen and Bean, 2003; McKay and Turner, 2004; Womack and Khodakhah, 2004). Intrinsic excitability induces SS firing even in the absence of synaptic excitation (Häusser and Clark, 1997). Considerable evidence supports the idea that SS frequency is driven by PC intrinsic activity, whereas inhibitory and excitatory inputs are important for precision of SS timing (De Zeeuw et al., 2011, for a review).
The existence of the silent and tonic modes can be explained by an intrinsic bistability of the PC revealed in vitro (Llinás and Sugimori, 1980; Williams et al., 2002). Bistability has also been demonstrated in vivo in anesthetized rats and guinea pigs, where whole-cell recordings showed that the UP and DOWN states, respectively characterized by the tonic SS firing and the silent mode, can be switched by climbing fiber (CF) excitation of the PC (Loewenstein et al., 2005). This specific excitatory input, revealed by CS occurrence, is able either to instantaneously stop the tonic mode of SS firing (UP state) and induce the silent mode (DOWN state), or to trigger tonic SS firing at a latency of ~70 ms. Given the effect of anesthetic agents on PC firing rate rhythmicity (Servais and Cheron, 2005) and discrepant results about PC bistability in intact circuits (see Engbers et al., 2013 for a review) it remains important to explore whether bistable behavior of the PC is present in alert animals.
Here, we confirm the existence of this bistability in extracellular recordings in alert mice, and we demonstrate the existence of a particular UP state of SS firing in which the PC produces very small spikes at about 600 Hz. As for the classical UP-to-DOWN state transition, we show that the CF input is able to switch the 600-Hz state of firing into the down state. Conversely, the CF input can initiate a typical SS pattern directly followed by a 600-Hz episode. In addition, PC modeling confirms the possibility of producing this specific 600-Hz UP state paradoxically characterized by low-amplitude SS (which must not be mistaken for a DOWN state or as a sign of PC inhibition).
EXPERIMENTAL PROCEDURES
Mice
Male wild-type FVB mice (n = 30), aged 5–8 months, obtained from an authorized supplier (Charles River Laboratories, Wilmington, MA, USA), were used as experimental animals.
The occurrence of 600-Hz episodes was also checked in different knockout mice presenting normal cerebellum morphology. These included: the mdx (C57BL/10ScSn-Dmdmdx) mouse model of Duchenne muscular dystrophy (n = 10) (Prigogine et al., 2010); Purkinje neuron-specific knockout mice for the large conductance BK potassium channels (n = 14) (Marquez-Ruiz et al., 2013); ptprr−/−mice (n = 5) (Chirivi et al., 2007) and a maternal Ube3a null mutation mouse model of Angelman syndrome (n = 5) (Cheron et al., 2005) (these two knockouts were generated on a C57Bl/6 genetic background). Chi-square tests were used to test for differences in the 600-Hz occurrence depending of the mice types. An analysis of variance (ANOVA) test for repeated measures followed by post hoc comparison was also used to compare inter-spike intervals (ISS) of CS before and during 600-Hz episodes. Results are expressed and illustrated as mean ± S.D. and are considered significant if p < 0.05. All statistical analyses were performed using Statistica 7.0.
All animal procedures were approved by the University of Mons Ethics Committee and conducted in conformity with the European Union directive 609/86/EU. Every effort was made to minimize the number of animals and their discomfort.
Surgical preparation
Animals were prepared for chronic recordings of local field potential (LFP) and PC single-unit activity (Cheron et al., 2004). Mice were anesthetized with xylido-dihydrothiazin (Rompun©, Bayer-SA Belgium, 10 mg/kg) and ketamine (Ketalar©, Pfizer Belgium, 100 mg/kg). Animals were administered an additional dose of xylido-dihydrothiazin (3 mg/kg) and ketamine (30 mg/kg) when they demonstrated agitation or marked increases in respiration or heart rate during the procedure. In addition, local anesthesia (0.5 mL of 20 mg/mL lidocaine and adrenaline [1:80,000, Xylocaine©, Astra Zeneca Belgium]) was administered subcutaneously during the soft tissue removal. During surgery, two small bolts were cemented perpendicular to the skull to immobilize the head during the recording sessions, and a silver reference electrode was placed on the surface of the parietal cortex. To allow access to the Crus I and II areas in the cerebellum, an acrylic recording chamber was constructed around a posterior craniotomy (2 × 2 mm) and covered with a thin layer of bone wax (Ethicon©, Johnson & Johnson Belgium).
Electrical stimulation of the whisker region
Facial dermatomes of the whisker regions were electrically stimulated with a pair of small cutaneous needles inserted under the skin (inter-electrode distance 3—4 mm). Electrical stimulation consisted of a single square pulse, 0.2 ms in duration and <2 mA current intensity, delivered by an isolation unit (Isoflex, AMPI, Israel) connected to an analog pulse generator (Master 8, AMPI, Israel). The amplitude of the current delivered at intervals of 10 ± 3 s in the whisker region was adjusted in order to avoid overt movements and animal discomfort. The movement of the whisker was recorded by means of a home-made system using the A3515/16 BiCMOS linear Hall-effect sensors measuring the displacement of a micro-magnet of 0.003 g (1.0-mm diameter and 0.5-mm height), glued onto one whisker.
Single-unit and multiple-unit recordings in alert mice
Twenty-four hours after anesthesia, alert mice were restrained for the recording session. The dura was removed over the cerebellum to expose the tissue in the recording chamber. Recordings were performed in the vermis and the Crus I or II area, and the depths of the electrodes were noted. To avoid unnecessary stress for the animals and movement artifacts, recording sessions were performed in a quiet room, when the animals were awake and calm. The alertness level was controlled by looking for the maintenance of whisking activity during the recording session. We used quartz–platinum/tungsten microelectrodes (1.2–3 MΩ) in a seven-channel Eckhorn microdrive (Thomas Recordings©, Giessen, Germany). All measures of impedance were made with a 1-kHz sinusoidal current and checked throughout the recording session. In the present study, only recordings performed with a single microelectrode (outer and shaft diameters of 80 and 25 μm, respectively) were taken into account. This restriction was adopted in order to avoid tissue damage more often reported when multiple electrodes array and glass micropipettes were used. Extrapolation from the data of Baker et al. (1999) indicated that less than 0.5% of the cortical volume explored being displaced by a single microelectrode, presenting also more flexibility than classical glass micropipettes. The microelectrode was mounted into a stretched elastic rubber tube to enable proper positioning via DC-micromotors (resolution of 0.27 μm). Neural activity signal recordings were filtered at 100-Hz high-pass and 10-kHz low-pass. LFP and unitary electrical activities were stored digitally on a computer after conversion with an analog–digital converter (Power 1401, CED©, Cambridge, UK). The recorded data were digitized continuously at 20 kHz. Off-line analysis and illustrations were performed with Spike 2 CED software (CED©, Cambridge, UK).
A neural signal was considered to originate from a PC when it presented two types of spiking activities: SS, characterized by a single depolarization (300—800 μs) that occurred between 20 and 200 Hz; and CS, characterized by an initial fast depolarization (300–600 μs), followed by smaller, and relatively constant wavelets. SS and CS were considered to originate from the same PC when a transient pause (~15 ms) in SS firing followed each CS. Recordings were analyzed when a stable signal was present for longer than 60 s.
Modeling
A 559-compartments single PC model was used, as described in detail in Traub et al. (2008). Briefly, this model contains six unmyelinated axonal compartments, soma, dendritic shaft, branching smooth dendrites, branching spiny dendrites. It was stimulated with “AMPA” conductances to smooth and/or spiny dendrites (reversal potential 0 mV), or “GABAA” conductance across various (or all) dendritic compartments (reversal potential −75 mV). CSs were evoked by an alpha-function-shaped large AMPA conductance to smooth dendrites. Parallel fiber inputs were simulated (in a highly idealized fashion) by inputs to the spiny dendrites, that were either constant in time, or linearly increasing in time.
The model had 12 active conductances: transient and persistent gNa in the axon, soma, and dendritic shaft, with transient gNa having high density in the axon and soma; three types of gCa in the smooth and spiny dendrites (R, T, and P channels); a low-density delayed rectifier; and six types of K+ channels: delayed rectifier (gK(DR)). at highest density in soma and axon; the transient, inactivating gK(A) at highest density in dendrites; the slow gK(D) at highest density in dendrites; the M type of non-inactivating gK, of low density (highest in axon, soma and dendritic shaft); and two types of Ca2+-dependent gK. The latter were the slow afterhyperpolarization (AHP) conductance; and the rapid “C” conductance, mediated by BK channels, that are also voltage-dependent. Details of kinetic properties, densities, and Ca2+ dynamics are given in Traub et al. (2008).
Statistical analysis
Data were analyzed using paired-t-test, one-way ANOVA test and Bonferroni’s post hoc test after assessing their normality by a Kolmogorov–Smirnov test using Statistica software (Statsoft, www.statsoft.com). Differences were considered significant at P < 0.05.
RESULTS
The mode of firing of the PC in alert wild-type mice was reported on 278 PCs. Fifty percent of these neurons presented a tonic mode, 25% a bursting mode, 16% a tonic to bursting mode and 9% a silent mode followed by bursting or a tonic mode.
Fig. 1 illustrates these different modes of firing recorded from a same PC in an alert mouse. The PC may alternate between a tonic mode (Fig. 1A), where mean SS frequency is about 75 Hz, to a silent mode (Fig. 1B), where only CS occur. The same PC may switch from one of these two modes to a bursting state characterized by either irregular bursts occurring at a mean frequency of 4 Hz (Fig. 1C), or regular fast bursts discharging at about 12 Hz (Fig. 1D).
Fig 1.

Four modes of PC firing. Extracellular recordings from a same PC are shown. (A) Tonic mode in the UP state; (B) silent mode characterizing the DOWN state; (C) bursting mode (at lower rate) in the UP state; (D) bursting mode (at higher rate) in the UP state. The black dots index CS firing.
Occasionally during this bursting state, PC seemed to stop firing SS (where indexed by the red in Fig. 2A), and the well-known drum-like beating sound associated with SS firing was replaced by a previously unrecognized whizz or buzz noise associated with a thickened trace of the extracellular signals (underlined in red in Fig. 2). After the buzz, the PC could return to its previous, normal tonic firing mode as illustrated in Fig. 2E.
Fig. 2.

Emergence of the 600-Hz buzz. (A–E) Example of extracellular recordings of one representative PC presenting episode of 600-Hz buzz corresponding to the thickening trace of the recorded signal and underlined by red horizontal bars. The black dots index CS firing. Note that the number of CS increase during the 600-Hz buzz. (For interpretation of the references to color in this figure legend, the reader is referred to the web version of this article.)
Despite the presence of CS, these “buzz” periods do not correspond to the silent mode. Indeed, finer signal analysis (Fig. 3A, B) did not reveal absence of SS spiking as in classical PC inhibition, but instead a very high firing rate of the PC. In the transition from the bursting mode to this novel UP state of firing, SS frequency increased to about 600 Hz (called “buzz” for simplicity), while SS amplitude decreased by about 85% to reach a small but constant amplitude (Fig. 3C). The superimposition of different 600-Hz buzz episodes confirmed the high reproducibility of this firing transition as expressed by exponential profiles (Fig. 3C).
Fig 3.

Relationship between the amplitude and firing frequency of the SS at the emerging period of the 600-Hz buzz. (A, B) Two examples of recording of SS firing showing SS amplitude progressive decrement ending in 600-Hz buzz. (C) Superimposition of the exponential profile corresponding to six episodes of 600-Hz buzz emergence. The open circles correspond to data from one of these curves.
As these 600-Hz buzz occurred spontaneously in alert mouse preparation no predetermined paradigms were made for studying this unpredictable event. Only a posteriori analysis was made on the PC recordings presenting this behavior. Precise quantification of the rate of occurrence and the duration of this phenomenon largely depends on many independent factors, including number and duration of recording sessions, number of identified PC and experimental purposes at the time of the recording session. The 600-Hz buzz was observed in 100 identified PC on a total of 598 PC recorded in the wild-type and the different knockout mice. The 600-Hz buzz occurrence was about 19% for the WT mice and ranged from 9% to 21% for the knockout mice (Table 1). Chi-square test demonstrated that the 600-Hz buzz occurrence was not different whatever the type of examined mice (p = 0.13).
Table 1.
Distribution of 600-Hz buzz occurrence in wild-type and different knockout mice presenting normal cerebellum morphology. Pearson Chi-square: 7.01 df = 4, p = 0.13
| Type of mice | Number of normal PC firing |
Number of PC presenting 600-Hz buzz |
|---|---|---|
| Wild type | 226 | 52 |
| PC-specific BK−/− | 118 | 13 |
| mdx | 85 | 23 |
| Ube3a | 32 | 6 |
| Ptprr−/− | 37 | 6 |
There were no differences in SS waveform (total duration of the SS and the duration of the depolarizing phase), the duration of the CS and duration of the SS pause following the CS between PC presenting the 600-Hz buzz and PC that do not (Table 2). We also found that the SS waveform completely recovered their original waveform after 600-Hz buzz (Table 3), making the possibility that the PC presenting the 600 Hz were significantly damaged by the microfiber recording unlikely.
Table 2.
Comparison of the firing properties of control PC versus PC presenting 600-Hz buzz
| PC control (n = 29) | PC presenting 600 Hz (n = 22) | One-way ANOVA | |
|---|---|---|---|
| Total SS duration (ms) | 4.3 ± 1.0 | 3.9 ± 0.6 | P = 0.09 |
| SS depolarizing duration (ms) | 0.47 ± 0.12 | 0.52 ± 0.10 | P = 0.09 |
| CS duration (ms) | 8.3 ± 1.6 | 7.8 ± 1.2 | P = 0.20 |
| SS pause triggered by CS (ms) | 13.0 ± 4.0 | 12.0 ± 3.1 | P = 0.22 |
Table 3.
Configuration of the simple spike (SS) before and after 600-Hz episode
| SS before 600-Hz buzz | SS after 600-Hz buzz | t-Test (n = 25) | |
|---|---|---|---|
| SS amplitude (mV) | 2.0 ± 0.5 | 2.0 ± 0.4 | P = 0.86 |
| Total duration of the SS (ms) | 4.3 ± 0.5 | 4.2 ± 0.5 | P = 0.62 |
| SS depolarizing phase duration (ms) | 0.57 ± 0.10 | 0.56 ± 0.10 | P = 0.90 |
In 23% of cases (n = 127), the transitions toward the 600-Hz buzz were triggered after a delay of 33.4 ± 11.3 ms by the occurrence of a CS. A rather stereotyped pattern emerged where the CS occurrence triggered a series of 8—10 SS followed by 600-Hz buzz, regardless of the SS firing pattern preceding the CS (Fig. 4). Conversely, in 63% of case the 600-Hz episodes were themselves suppressed by CS occurrence producing a long pause of 167.6 ± 82.7 ms (Fig. 5A—C). In the illustrated example, FFT quantification of this phenomenon indicates a dominant peak > 600 Hz (750 Hz in the illustrated case) that disappears after CS occurrence (Fig. 5A). This was also illustrated by CS-triggered averaging of the filtered and rectified signals around the peak frequency (Fig. 5B, C). Mean frequency of this very high frequency phenomenon was 601.0 ± 110.3 Hz (n = 22 PC recorded in nine WT mice). During the maintenance of the 600-Hz buzz, CS induced a shorter pause of 20.0 ± 6.2 ms. When electrical stimulation was given to the whisker pad producing whisker movement during a 600-Hz buzz, the latter was suppressed for about 190 ms (Fig. 5D), indicating that the PC remained responsive to peripheral stimulation during the 600-Hz buzz.
Fig 4.
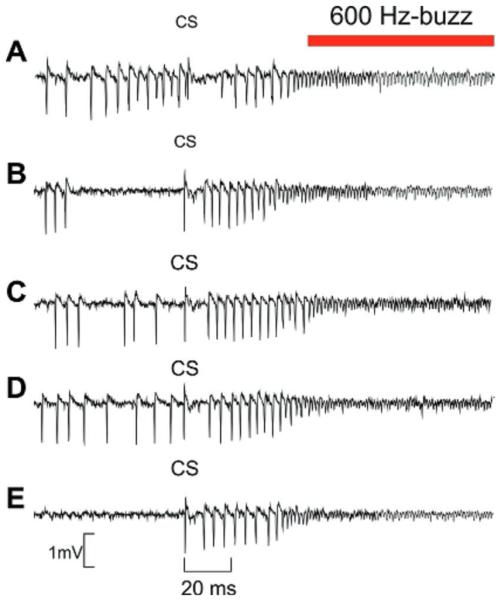
Stereotyped PC firing pattern leading to 600-buzz emergence. Five recordings of PC activity where the CS are aligned in order to show the stereotyped sequence of 8–10 SS followed by 600-Hz buzz (red line). (For interpretation of the references to color in this figure legend, the reader is referred to the web version of this article.)
Fig. 5.

CS and 600-Hz buzz behavioral relationship. (A, B) Fast Fourier Transform (FFT) of the raw signals corresponding to continuous recording showing in succession: a 600-Hz buzz suppressed by CS occurrence (open triangle) then the occurrence of SS followed by a new period of 600 Hz. Two examples of such type of recordings are given in B and the corresponding FFT peaking in these cases at 750 Hz are given in A. Note the suppression of the 750-Hz FFT peak produced by the CS. (C) Effect of the CS occurrence on the filtered (FIR band pass from 700 to 800 Hz), rectified and averaged 750 Hz (blue area). (D) Effect of electrical stimulation (stim, arrow) of the whisker pad on whisker displacement (upper trace) and on the same 750-Hz signals (blue area). (For interpretation of the references to color in this figure legend, the reader is referred to the web version of this article.)
Mean ISS within CS was 0.93 ± 0.66 s (n = 93 ISS recorded in four mice) before 600-Hz buzz occurrence, but it shifted to 0.62 ± 0.56 s (n = 113 ISS recorded in four mice) (p < 0.005) during 600-Hz buzz episodes. This indicates a significant effect of the PC output during the 600-Hz buzz on the CS frequency; such an effect corroborates the contribution of the cerebello-olivary loop acting to trigger a disinhibition of the inferior olive (IO).
Given the previously documented alteration in CS waveform following high-frequency SS firing (Servais et al., 2004), we compared the CS waveform during and outside 600-Hz buzz. Fig. 6 shows the superimposition of averaged CS, illustrating two main differences in CS waveform, when these occur outside vs. during 600-Hz episodes. During these episodes (red traces) the first depolarizing component (FDC) of the CS was strongly reduced (from 0.65 ± 0.08 to 0.15 ± 0.04 mV, n = 16 p < 0.001), and the second depolarizing component (SDC) was completely suppressed. In contrast, the positive component of the CS following the first depolarizing spike (0.32 ± 0.03 mV outside the 600-Hz episodes versus 0.31 ± 0.02 mV during the episodes), and the total duration of the CS-related pause, were not altered during the 600-Hz buzz.
Fig. 6.

CS configuration before and during 600-Hz buzz. (A) superimposition of averaged CS recorded before (black line) and during (red line) the 600-Hz episode. Note the amplitude reduction of the FDC and the suppression of the SDC during the 600-Hz episode. (B) Evolution of the FDC amplitude measured before and during the emergence of 600-buzz (n = 5). Each symbol corresponds to a single CS ordered by their ordinal occurrence with respect to the onset of the 600-Hz buzz. The five sequences are realigned on the 600-Hz onset (vertical arrow). Abbreviation: CS, complex spike; FDC, first depolarizing component; SDC, second depolarizing component. (For interpretation of the references to color in this figure legend, the reader is referred to the web version of this article.)
Modeling
We used a multicompartment, multiconductance simulation model of a PC (Traub et al., 2008), in order to investigate testable mechanisms by which a > 300-Hz “buzz” might be generated. In this model, we could produce such a buzz when the somatic membrane was depolarized to near −40 mV. It proved difficult to depolarize the soma much beyond −40 mV; analysis of the somatic steady-state membrane current—voltage relation showed that this was the result of large outward K+ currents developing at such potentials. Large depolarizations could be induced by, for example, blocking BK channels, but this mechanism is unlikely to operate in vivo. Alternatively, we could induce an UP state-associated buzz with quite large tonic AMPA conductances in the spiny dendrites, combined with an absence of counteracting GABAergic inhibition.
Fig. 7 illustrates the model response to three patterns of synaptic input: first, as demonstrated earlier (Traub et al., 2008), a CS occurs in response to large transient synaptic excitation of the proximal smooth dendrites. Next, in response to large tonic AMPA conductances (to the spiny dendrites), but counterbalanced by strong tonic inhibition to the soma and proximal dendrites, there occurs a series of rhythmic SS. Finally, when the counterbalancing inhibition is removed, an UP state occurs with superimposed very fast oscillations (here, ~600 Hz), fluctuating around a mean membrane potential of about −43.5 mV. The comparison between the first CS occurring in resting condition and the second one occurring when PC membrane is “permissive” for the 600-Hz buzz shows that the first depolarization phase is reduced during this state (Fig. 7) as experimentally observed in the alert preparation (Fig. 6).
Fig. 7.
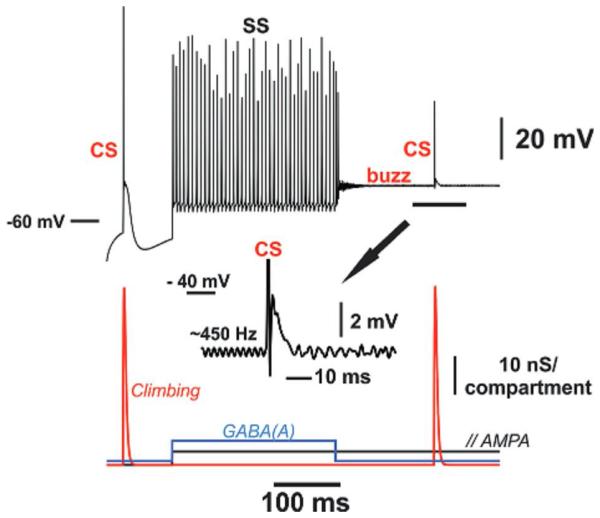
Three types of firing behavior in 559-compartment model Purkinje cell (axon + soma + smooth dendrites + spiny dendrites). Soma potential shown above and in the inset, synaptic inputs (obviously idealized) below. The input to only a single one of the many actually stimulated compartments is plotted. The climbing fiber input was delivered to the 24 proximal smooth dendritic compartments; parallel fiber (“//”) inputs to the 528 distal spiny dendritic compartments; GABAergic inhibition to all 552 dendritic compartments. CS = complex spike (truncated in the inset); SS = simple spikes, present during the combination of tonic excitation and inhibition; buzz = high-frequency oscillations, present during tonic excitation alone, at a membrane potential of ~−43 mV. Note that the buzz is replaced by a slower oscillation, immediately following a CS.
Some of the relevant properties of the simulated 600-Hz buzz UP state were as follows:
(1) With the parameters used, the buzz was strongly voltage-dependent, peaking at about −44 to −42 mV. This potential range is somewhat hyper-polarized, relative to the potential (about −30 mV) for the peak steady-state current of transient gNa.
(2) The buzz required both transient gNa and the delayed rectifier gK. Specifically, complete block of transient gNa caused the buzz to disappear almost completely; altering gK(DR) had strong effects on the amplitude (not illustrated).
(3) Buzz amplitude was higher in the axon than the soma (Fig. 8). Thus, axonal firing might be possible during the buzz, if axonal spikes are generated at some distance from the soma. However, the axonal portion of our PC model was too short to demonstrate this explicitly.
(4) A CS transiently suppressed the buzz in our model (Fig. 8). which we attribute to transient inactivation of gNa caused by the large depolarization. Such suppression was consistent with our experimental observations. In the model, however, a slower oscillation (~200 Hz) appeared while the buzz was suppressed – the slower oscillation was produced by gCa, particularly P channels (not illustrated). It is possible that experimental intracellular recordings would show whether this slower oscillation actually exists in real PC, following a within-buzz CS.
Fig. 8.
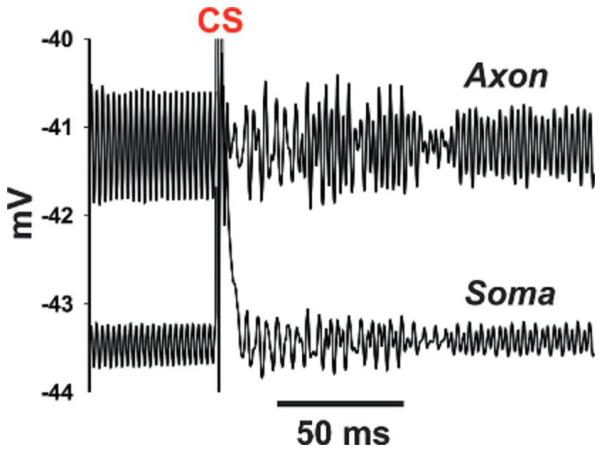
Axonal amplification of simulated 600-Hz buzz. Simulated 600-buzz has a larger amplitude, and occurs at a more depolarized mean potential, in the axon (distal compartment), as compared with the soma. Data are from the same simulation illustrated in Fig. 7. This figure also shows return of the buzz, following a CS (truncated in this figure).
DISCUSSION
In the present study, we characterize a previously undescribed temporary UP state mode of fast (ca. 600 Hz). low-amplitude SS firing. The 600-Hz buzz episodes, alternating with the other (tonic, bursting or silent) modes, were recorded in different PC over long recording times and were never accompanied by the classical electrophysiological signs of PC injury or death. It is noteworthy that this phenomenon was observed with the same frequency of occurrence in wild-type mice as well as in a number of knockout mice with functional cerebellar abnormalities. This 600-Hz buzz UP state may have been previously misinterpreted as quiescent (DOWN state) due to strong reduction in SS amplitude associated with frequency increase. This added complexity likely calls for refinement of the classical notion of PC bistability that describes toggling between two states. In addition to the DOWN state, there are three distinctive, discrete UP states: tonic, bursting and 600-Hz buzz episodes.
The physiological relevance of discrete neuronal states, namely UP and DOWN states has increasingly been recognized as a modus operandi of neocortical neurons (Steriade et al., 1993a,b; Hughes and Crunelli, 2013). These states are readily identified by the presence of step-like depolarization and firing in the UP states and hyperpolarization and absence of spiking in the DOWN states (Crunelli and Hughes, 2010). Similar states have been documented in cerebellar PC in slice preparations (Fernandez et al., 2007; McKay et al., 2007; Kitamura and Häusser, 2011; Engbers et al., 2012). PC bistability is also present in anesthetized animals (Loewenstein et al., 2005; Tal et al., 2008; Kitamura and Häusser, 2011). Although the existence of PC bistability in the awake animal was questioned Schonewille et al. (2006), it has been extensively documented in alert mice (Servais et al., 2004), in freely moving rats (Lev et al., 2006) and in awake restrained cats (Yartsev et al., 2009).
In PC DOWN state, there is virtual absence of SS, but CS firing is present, indicating continuing control exerted by the IO. In PC UP state, two SS firing modes have classically been described, namely tonic and bursting (Servais et al., 2004).
The mechanisms underlying PC bistability are still debated. Some authors propose that the transition from one state to another is induced by a unitary event, namely CF input (Fernandez et al., 2007; McKay et al., 2007; Kitamura and Häusser, 2011; Engbers et al., 2012). However, such transitions have been demonstrated in vivo in anesthetized rats only with sustained (40 min) CF inactivation (Cerminara and Rawson, 2004). The emerging pattern was characterized by alternating bursts of high-frequency discharges at up to 100–150 Hz, followed by 10–20-s periods of quiescence. Conversely, reintroduction of CF input in vitro (1 Hz) blocked transition between states (McKay et al., 2007).
It is unlikely that 600-Hz buzz results solely from the PC intrinsic pacemaker, which originates mainly from resurgent Na+ and K+ conductances, as this is highly regular within 30–150-Hz range (Häusser and Clark, 1997; Raman and Bean, 1999).
Additional contributions to this high-frequency UP state may result from mossy-fiber input via direct excitation from granule cells, which is known to shift PC to UP state (Rokni et al., 2009), and/or by suppression of indirect PC inhibition via molecular layer interneurons (MLI), which is involved in the UP-to-DOWN state transition (Jacobson et al., 2008; Oldfield et al., 2010).
The present model supports the latter combination of depolarization via AMPA conductance and the arrest of GABAA conductance as a trigger mechanism for the 600-Hz buzz UP state. The appearance of the buzz resembled the subthreshold oscillations recorded in squid axons in low Ca2+ (Guttman and Barnhill, 1970), and analyzed by Mauro et al. (1970). We hypothesize that the mechanisms may be similar, reflecting the dynamics of specific intrinsic membrane conductances, most importantly the leak conductance, gNa and voltage-dependent, non-inactivating gK.
Another possibility for inducing this 600-Hz buzz firing could be the release of the corticotropin-releasing factor (CRF) by the CF, as local application of CRF in slice was demonstrated to toggle the PC into the UP state (Libster et al., 2010).
Before studying the influence of the CF on the 600-Hz buzz, it is important to ensure that the recorded CS originate from the same PC. This was first assumed by the presence of a clear SS pause triggered by the CS and by the presence of a unique CS waveform before and after the 600-Hz period. An additional argument only valid in the present situation was that in case of different origin of the SS fired by one PC and the CS by a neighboring PC, the waveform of the CS would not be altered during the 600-Hz mode. Our consistent finding of CS waveform alteration during the 600-Hz period followed by complete recovery after the 600-Hz period further supports the conclusion that this arose from the same PC. However, recent experimental evidence of the effects of extrasynaptic neurotransmitter spillover engaging local microcircuits unpredicted by conventional synapses (Coddington et al., 2013) reveals more complexity. In this context, a single CF appears to be able to activate inhibitory interneurons acting on many PCs. By using simultaneous recordings of two neighboring PCs, one showing the all-or-none excitatory postsynaptic current (EPSC) induced by its proper CF and not the second one, Coddington et al. (2013) demonstrated that the latter PC was indeed inhibited by spillover action on the MLI. However, these authors also showed that the SS spontaneous firing was only partially inhibited and no absolute pause was evoked in this case. This confirms that a clear CF-evoked pause in SS (0 spiking for about more than 10 ms) remains a good criterion indicating that when a single PC is isolated, the recorded SS and CS present a high likelihood of being produced by the same PC.
The high stereotypy of the CS evoking a short series of SS directly followed by the 600-Hz buzz firing suggests that in addition to inhibitory control exerted by CF on the intrinsic SS generator (Colin et al., 1980; Rawson and Tilokskulchai, 1981; Demer et al., 1985; Savio and Tempie, 1985; Cerminara and Rawson, 2004; Mathews et al., 2012), CF may activate a particular SS pattern building up to 600-Hz buzz firing.
The dynamics of PC inhibition is complex as it is exerted by different neuronal mechanisms subserved by the MLI (stellate and basket cells) activated by granule cells (Dizon and Khodakhah, 2011), CF (Szapiro and Barbour, 2007; Mathews et al., 2012; Coddington et al., 2013) and PC collaterals (Orduz and Llano, 2007). Mossy fiber input produces both excitation of the PC via granule cells patches located above the PC and inhibition via the granules cells patches located on either side of the PC activating the MLIs (lateral inhibition). This was simulated in our model, where AMPA and GABAA currents coexist during the UP state before the occurrence of the 600-Hz buzz simulation. The CF activate the MLIs through a pure glutamate spillover mechanism (Szapiro and Barbour, 2007, 2009; Mathews et al., 2012; Coddington et al., 2013) inducing effective inhibition of the PC. However, this PC inhibition may be inhibited by the action of glutamate spillover activating AMPA receptors on the MLI axons, thus preventing GABA release onto the PC (Satake et al., 2000). Moreover, Coddington et al. (2013) demonstrated that while the MLIs situated within the area of glutamate spillover are excited by the CF action, the MLIs situated outside this area are strongly inhibited. This latter inhibition of the MLIs was simulated in our model, with the effect of inducing the 600-Hz buzz.
Our results show that the CF is able to switch PC firing to a higher state (600 Hz) and also to stop it. These transitions could be hypothesized to depend on the amplitude of CF input (Fernandez et al., 2007; Davie et al., 2008; Kitamura and Häusser, 2011). However, we show that induction of 600-Hz buzz cannot be predicted based on CS amplitude, though the amplitude of the initial depolarizing component of the CS amplitude was reduced during 600-Hz buzz, while the hyperpolarizing phase was conserved. It was recently demonstrated that SS and CS are both initiated at the distal axon initial segment (Palmer et al., 2010). Consistently, the present model supports that the reduction in CS initial depolarizing phase and the reduction in SS amplitude during 600-Hz buzz episodes are both due to transient inactivation of gNa caused by the large depolarization (Traub et al., 2008; Palmer et al., 2010).
Another characteristic of CS morphology during 600-Hz episodes is the suppression of the SDC. This component has been described in slice preparation during LTD at the CF–PC synapse (Hansel and Linden, 2000), and is associated with a reduction in the CS-associated Ca2+ transient during CF LTD (Weber et al., 2003). The importance of the CS-associated Ca2+ synchrony among neighboring PC was highlighted by Schultz et al. (2009). The same group (Kitamura and Häusser, 2011) demonstrated, with patch-clamp recordings and two-photon Ca2+ imaging in anesthetized rats, that the peak amplitude of CF-associated Ca2+ transients in UP state was significantly larger than that in DOWN state. In the same line of evidence, when CF stimulation evokes a CS associated with a large Ca2+ transient, the second depolarizing spike is present, but in contrast, when the CF evokes a CS with a smaller Ca2+ transient the second depolarizing spike is absent (see Fig. 2 of Ohtsuki et al., 2009). This could indicate that during the 600-Hz buzz, the Ca2+ transient associated with CF input is reduced, explaining the suppression of the SDC of the CS. With a less sophisticated method, our group previously demonstrated in alert mice that the amplitude of the SDC is inversely proportional to the SS firing rate preceding the CS and that this amplitude is independent of previous CS firing rate (Servais et al., 2004). The same observation has been made by Tai et al. (2008) both in slice and in anesthetized rats. They concluded to the existence of two types of CS configuration, for the DOWN and the UP state, respectively. This means that the suppression of the SDC of the CS during the 600-Hz buzz may be interpreted by the same mechanisms as proposed for the modulation of this component during the tonic mode. One explanation could be that when 600-Hz spiking precedes the CS, the integrated depolarization renders voltage-sensitive Ca2+ channels in the PC inactive, thus suppressing the SDC. Alternatively, if the 600-Hz firing is produced by an increase of the synaptic input originating in the granule cell layer, the parallel fiber activity is able to modulate the CS configuration via the inhibitory molecular interneurons. Indeed, off-beam stimulation of parallel fibers has been shown to decrease the secondary spikes of the CS (Campbell and Hesslow, 1986) and direct or disynaptic stellate activation decreases Ca2+ entry during a CS (Callaway et al., 1995).
In UP state, the peak amplitude of CF-associated Ca2+ transients that triggered transitions from UP-to-DOWN state was significantly larger than those that did not trigger transitions (Kitamura and Häusser, 2011). Therefore, the present altered CS configuration during the 600-Hz buzz state indicates that a single CF input is not able to directly toggle the PC state from the 600-Hz buzz state to the DOWN state. However, the increase in CS frequency and the conserved efficacy of CS triggered pause on the 600-Hz spiking may contribute to momentary escape from the 600-Hz buzz state. Consistently with our experimental observations, the PC model reproduces the transient suppression of the 600-Hz buzz by the CS occurrence. However, a slower oscillation (~200 Hz) appeared while the buzz was suppressed – the slower oscillation was produced by gCa, particularly P channels. It is possible that experimental intracellular recordings would show whether this slower oscillation actually exists in real PC, following a within-buzz CS.
The conservation of the classical pause induced by the CS during the 600-Hz state shows that the regulation exerted by the dendritic Ca2+ spike on the somatic output spiking (Davie et al., 2008) remains active even during this high rate firing.
The fact that the present model indicates that the small SS amplitude of the 600-Hz buzz can be higher in the axon than those recorded in the soma reinforces the possibility for the transmission of this very high frequency signal toward the deep cerebellar or vestibular nuclei. Indeed, the higher CS frequency reported during 600-Hz periods could be explained by the olivo-cerebellar feedback loop. In this circuit, the 600-Hz buzz transmitted by the PC axon would increase their inhibition on deep cerebellar nuclei, which would in turn reduce inhibition of the inferior olivary nucleus, inducing in fine an increase in CS firing. Similarly, Chen et al. (2010) thus explained a decrease in CS frequency by a reduction in SS frequency in PC BK−/− mice.
Acknowledgments
We thank M. Dufief, E. Toussaint T. D’Angelo, E. Hortmanns, and M. Petieau, for expert technical assistance. This work was funded by the Belgian Federal Science Policy Office, the European Space Agency, (AO-2004, 118), the Belgian National Fund for Scientific Research (FNRS), the research funds of the Universite Libre de Bruxelles and of the Université de Mons (Belgium).
Abbreviations
- ANOVA
analysis of variance
- CF
climbing fiber
- CRF
corticotropin-releasing factor
- CS
complex spike
- IO
inferior olive
- ISS
inter-spike intervals
- LFP
local field potential
- MLI
molecular layer interneurons
- PC
Purkinje cell
- SDC
second depolarizing component
- SS
simple spikes
REFERENCES
- Baker SN, Philbin N, Spinks R, Pinches EM, Wolpert DM, MacManus DG, Pauluis Q, Lemon RN. Multiple single unit recording in the cortex of monkeys using independently moveable microelectrodes. J Neurosci Methods. 1999;95:5–17. doi: 10.1016/s0165-0270(99)00121-1. [DOI] [PubMed] [Google Scholar]
- Callaway JC, Lasser-Ross N, Ross WN. IPSPs strongly inhibit climbing fiber-activated [Ca2+]i increases in the dendrites of cerebellar Purkinje neurons. J Neurosci. 1995;15:2777–2787. doi: 10.1523/JNEUROSCI.15-04-02777.1995. [DOI] [PMC free article] [PubMed] [Google Scholar]
- Campbell NC, Hesslow G. The secondary spikes of climbing fibre responses recorded from Purkinje cell somata in cat cerebellum. J Physiol. 1986;377:207–224. doi: 10.1113/jphysiol.1986.sp016182. [DOI] [PMC free article] [PubMed] [Google Scholar]
- Cerminara NL, Rawson JA. Evidence that climbing fibers control an intrinsic spike generator in cerebellar Purkinje cells. J Neurosci. 2004;24:4510–4517. doi: 10.1523/JNEUROSCI.4530-03.2004. [DOI] [PMC free article] [PubMed] [Google Scholar]
- Chen X, Kovalchuk Y, Adelsberger H, Henning HA, Sausbier M, Wielzorrek G, Ruth P, Yarom Y, Konnerlh A. Disruption of the olivo-cerebellar circuit by Purkinje neuron-specific ablation of BK channels. Proc Natl Acad Sci U S A. 2010;107:12323–12328. doi: 10.1073/pnas.1001745107. [DOI] [PMC free article] [PubMed] [Google Scholar]
- Cheron G, Gall D, Servais L, Dan B, Maex R, Schiffmann SN. Inactivation of calcium-binding protein genes induces 160 Hz oscillations in the cerebellar cortex of alert mice. J Neurosci. 2004;24:434–441. doi: 10.1523/JNEUROSCI.3197-03.2004. [DOI] [PMC free article] [PubMed] [Google Scholar]
- Charon G, Servais L, Wagstaff J, Dan B. Fast cerebellar oscillation associated with ataxia in a mouse model of Angelman syndrome. Neuroscience. 2005;130(3):631–637. doi: 10.1016/j.neuroscience.2004.09.013. [DOI] [PubMed] [Google Scholar]
- Cheron G, Sausbier M, Sausbier U, Neuhuber W, Ruth P, Dan B, Servais L. BK channels control cerebellar Purkinje and Golgi cell rhythmicity in vivo. PLoS ONE. 2009;4:e7991. doi: 10.1371/journal.pone.0007991. [DOI] [PMC free article] [PubMed] [Google Scholar]
- Chirivi RG, Noordman YE, Van der Zee CE, Hendriks WJ. Altered MAP kinase phosphorylation and impaired motor coordination in PTPRR deficient mice. J Neurochem. 2007;101:829–840. doi: 10.1111/j.1471-4159.2006.04398.x. [DOI] [PubMed] [Google Scholar]
- Coddington LT, Rudolph S, Vande Lune P, Overstreet-Wadiche L, Wadiche JI. Spillover-mediated feedforward inhibition functionally segregates interneuron activity. Neuron. 2013;78:1050–1062. doi: 10.1016/j.neuron.2013.04.019. [DOI] [PMC free article] [PubMed] [Google Scholar]
- Colin F, Manil J, Desclin JC. The olivocerebellar system. I. Delayed and slow inhibitory effects: an overlooked salient feature of cerebellar climbing fibers. Brain Res. 1980;187:3–27. doi: 10.1016/0006-8993(80)90491-6. [DOI] [PubMed] [Google Scholar]
- Crunelli V, Hughes SW. The slow (< 1 Hz) rhythm of non-REM sleep: a dialogue between three cardinal oscillators. Nat Neurosci. 2010;13:9–17. doi: 10.1038/nn.2445. [DOI] [PMC free article] [PubMed] [Google Scholar]
- Davie JT, Clark BA, Häusser M. The origin of the complex spike in cerebellar Purkinje cells. J Neurosci. 2008;28:7599–7609. doi: 10.1523/JNEUROSCI.0559-08.2008. [DOI] [PMC free article] [PubMed] [Google Scholar]
- De Zeeuw Cl, Hoebeek FE, Bosman LW, Schonewille M, Witter L, Koekkoek SK. Spatiotemporal firing patterns in the cerebellum. Nat Rev Neurosci. 2011;12:327–344. doi: 10.1038/nrn3011. [DOI] [PubMed] [Google Scholar]
- Demer JL, Echelman DA, Robinson DA. Effects of electrical stimulation and reversible lesions of the olivocerebellar pathway on Purkinje cell activity in the flocculus of the cat. Brain Res. 1985;346:22–31. doi: 10.1016/0006-8993(85)91090-x. [DOI] [PubMed] [Google Scholar]
- Dizon MJ, Khodakhah K. The role of interneurons in shaping Purkinje cell responses in the cerebellar cortex. J Neurosci. 2011;31:10463–10473. doi: 10.1523/JNEUROSCI.1350-11.2011. [DOI] [PMC free article] [PubMed] [Google Scholar]
- Edgerton JR, Reinhart PH. Distinct contributions of small and large conductance Ca2+-activated K+ channels to rat Purkinje neuron function. J Physiol. 2003;548:53–69. doi: 10.1113/jphysiol.2002.027854. [DOI] [PMC free article] [PubMed] [Google Scholar]
- Engbers JOT, Fernandez FR, Turner RW. Bistability in Purkinje neurons: Ups and downs in cerebellar research. Neural Netw. 2013;47:18–31. doi: 10.1016/j.neunet.2012.09.006. [DOI] [PubMed] [Google Scholar]
- Fernandez FR, Engbers JDT, Turner RW. Firing dynamics of cerebellar Purkinje cells. J Neurophysiol. 2007;98:278–294. doi: 10.1152/jn.00306.2007. [DOI] [PubMed] [Google Scholar]
- Guttman R, Barnhill R. Oscillation and repetitive firing in squid axons. Comparison of experiments with computations. J Gen Physiol. 1970;55:104–118. doi: 10.1085/jgp.55.1.104. [DOI] [PMC free article] [PubMed] [Google Scholar]
- Hansel C, Linden DJ. Long-term depression of the cerebellar climbing fiber-Purkinje neuron synapse. Neuron. 2000;26:473–482. doi: 10.1016/s0896-6273(00)81179-4. [DOI] [PubMed] [Google Scholar]
- Häusser M, Clark BA. Tonic synaptic inhibition modulates neuronal output pattern and spatiotemporal synaptic integration. Neuron. 1997;19:665–678. doi: 10.1016/s0896-6273(00)80379-7. [DOI] [PubMed] [Google Scholar]
- Hughes S, Crunelli V. UP states rise from the depths. Nat Neurosci. 2013;16:115–117. doi: 10.1038/nn.3313. [DOI] [PubMed] [Google Scholar]
- Jacobson GA, Rokni D, Yarom Y. A model of the olivo-cerebellar system as a temporal pattern generator. Trends Neurosci. 2008;31:617–625. doi: 10.1016/j.tins.2008.09.005. [DOI] [PubMed] [Google Scholar]
- Kitamura K, Hausser M. Dendritic calcium signaling triggered by spontaneous and sensory-evoked climbing fiber input to cerebellar Purkinje cells in vivo. J Neurosci. 2011;31:10847–10858. doi: 10.1523/JNEUROSCI.2525-10.2011. [DOI] [PMC free article] [PubMed] [Google Scholar]
- Lev I, Jacobson G, Yarom Y, Cohen D. Bistable behavior of cerebellar neurons revealed by chronic recordings of neuronal activity in freely moving rats. Society for Neuroscience; Atlanta: 2006. [Google Scholar]
- Libster AM, Lefler Y, Yaron-Jakoubovitch A, Yarom Y. Ataxia and the olivo-cerebellar module. Funct Neurol. 2010;25:129–133. [PubMed] [Google Scholar]
- Llinás R, Sugimori M. Electrophysiological properties of in vitro Purkinje cell dendrites in mammalian cerebellar slices. J Physiol. 1980;305:197–213. doi: 10.1113/jphysiol.1980.sp013358. [DOI] [PMC free article] [PubMed] [Google Scholar]
- Loewenstein Y, Mahon S, Chadderton P, Kitamura K, Sompolinsky H, Yarom Y, Häusser M. Bistability of cerebellar Purkinje cells modulated by sensory stimulation. Nat Neurosci. 2005;8:202–211. doi: 10.1038/nn1393. [DOI] [PubMed] [Google Scholar]
- Marquez-Ruiz J, Prigogine C, Cheron J, Ammann C, Dan B, Sausbier M, Ruth P, Cheron G. Effects of climbing fiber driven inhibition on Purkinje neuron spiking. Soc Neurosci Abstr. 2013 469.02/FFF6. [Google Scholar]
- Mathews PJ, Lee KH, Peng Z, Houser CR, Olis TS. Effects of climbing fiber driven inhibition on Purkinje neuron spiking. J Neurosci. 2012;32:17968–17997. doi: 10.1523/JNEUROSCI.3916-12.2012. [DOI] [PMC free article] [PubMed] [Google Scholar]
- Mauro A, Conti F, Dodge F, Schor R. Subthreshold behavior and phenomenological impedance of the squid giant axon. J Gen Physiol. 1970;55:497–523. doi: 10.1085/jgp.55.4.497. [DOI] [PMC free article] [PubMed] [Google Scholar]
- McDevitt CJ, Ebner TJ, Bloedel JR. The changes in Purkinje cell simple spike activity following spontaneous climbing fiber inputs. Brain Res. 1982;237:484–491. doi: 10.1016/0006-8993(82)90460-7. [DOI] [PubMed] [Google Scholar]
- McKay BE, Turner RW. Kv3 K+ channels enable burst output in rat cerebellar Purkinje cells. Eur J Neurosci. 2004;20:729–739. doi: 10.1111/j.1460-9568.2004.03539.x. [DOI] [PubMed] [Google Scholar]
- McKay BE, Engbers JOT, Mehaffey WH, Gordon GRJ, Molineux ML, Bains JS, Turner RW. Climbing fiber discharge regulates cerebellar functions by controlling the intrinsic characteristics of Purkinje cell output. J Neurophysiol. 2007;97:2590–2604. doi: 10.1152/jn.00627.2006. [DOI] [PubMed] [Google Scholar]
- Ohtsuki G, Piochon C, Hansel C. Climbing fiber signaling and cerebellar gain control. Front Cell Neurosci. 2009;3:4. doi: 10.3389/neuro.03.004.2009. http:l/dx.doi.ora/ 10.3389/neuro.03.004.2009. Epub 2009 Jul 6. [DOI] [PMC free article] [PubMed] [Google Scholar]
- Oldfield CS, Marty A, Stell BM. Interneurons of the cerebellar cortex toggle Purkinje cells between up and down states. Prue Natl Acad Sci U S A. 2010;107:13153–13158. doi: 10.1073/pnas.1002082107. [DOI] [PMC free article] [PubMed] [Google Scholar]
- Orduz D, Llano I. Recurrent axon collaterals underlie facilitating synapses between cerebellar Purkinje cells. Proc Natl Acad Sci U S A. 2007;104:17831–17836. doi: 10.1073/pnas.0707489104. [DOI] [PMC free article] [PubMed] [Google Scholar]
- Palmer LM, Clark BA, Gründemann J, Roth A, Stuart GJ, Häusser M. Initiation of simple and complex spikes in cerebellar Purkinje cells. J Physiol. 2010;588:1709–1717. doi: 10.1113/jphysiol.2010.188300. [DOI] [PMC free article] [PubMed] [Google Scholar]
- Prigogine C, Dan B, Cheron G. Purkinje cell firing alteration in mdx mice. Dev Med Child Neurol. 2010;52(Suppl. 4):p65. [Google Scholar]
- Raman IM, Bean BP. Resurgent sodium current and action potential formation in dissociated cerebellar Purkinje neurons. J Neurosci. 1997;17:4517–4526. doi: 10.1523/JNEUROSCI.17-12-04517.1997. [DOI] [PMC free article] [PubMed] [Google Scholar]
- Raman IM, Bean BP. Ionic currents underlying spontaneous action potentials in isolated cerebellar Purkinje neurons. J Neurosci. 1999;19:1663–1674. doi: 10.1523/JNEUROSCI.19-05-01663.1999. [DOI] [PMC free article] [PubMed] [Google Scholar]
- Rawson JA, Tilokskulchai K. Suppression of simple spike discharges of cerebellar Purkinje cells by impulses in climbing fibre afferents. Neurosci Lett. 1981;25:125–130. doi: 10.1016/0304-3940(81)90319-0. [DOI] [PubMed] [Google Scholar]
- Rokni D, Tai Z, Byk H, Yarom Y. Regularity, variability and bi-stability in the activity of cerebellar Purkinje cells. Front Cell Neurosci. 2009;3:12. doi: 10.3389/neuro.03.012.2009. http:ljdx.doi.org/10.3389/neuro.03.012.2009. Epub 2009 Nov 9. [DOI] [PMC free article] [PubMed] [Google Scholar]
- Satake S, Saitow F, Yamada J, Konishi S. Synaptic activation of AMPA receptors inhibits GABA release from cerebellar interneurons. Nat Neurosci. 2000;3:551–558. doi: 10.1038/75718. [DOI] [PubMed] [Google Scholar]
- Savio T, Tempie F. On the Purkinje cell activity increase induced by suppression of inferior olive activity. Exp Brain Res. 1985;57:456–463. doi: 10.1007/BF00237832. [DOI] [PubMed] [Google Scholar]
- Schiffmann SN, Cheron G, Lohof A, d’ Alcantara P, Meyer M, Parmentier M, Schurmans S. Impaired motor coordination and Purkinje cell excitability in mice lacking calretinin. Proc Natl Acad Sci U S A. 1999;96:5257–5262. doi: 10.1073/pnas.96.9.5257. [DOI] [PMC free article] [PubMed] [Google Scholar]
- Schonewille M, Khosrovani S, Winkelman BH, Hoebeek FE, De Jeu MT, Larsen IM, Van der Burg J, Schmolesky MT, Frens MA, De Zeeuw Cl. Purkinje cells in awake behaving animals operate at the upstate membrane potential. Nat Neurosci. 2006;9:459–461. doi: 10.1038/nn0406-459. [DOI] [PubMed] [Google Scholar]
- Schultz SR, Kitamura K, Post-Uiterweer A, Krupic J, Häusser M. Spatial pattern coding of sensory information by climbing fiber-evoked calcium signals in networks of neighboring cerebellar Purkinje cells. J Neurosci. 2009;29:8005–6015. doi: 10.1523/JNEUROSCI.4919-08.2009. [DOI] [PMC free article] [PubMed] [Google Scholar]
- Servais L, Cheron G. Purkinje cell rhythmicity and synchronicity during modulation of fast cerebellar oscillation. Neuroscience. 2005;134:1247–1259. doi: 10.1016/j.neuroscience.2005.06.001. [DOI] [PubMed] [Google Scholar]
- Servais L, Bearzatto B, Hourez R, Dan B, Schiffmann SN, Cheron G. Effect of simple spike firing mode on complex spike firing rate and waveform in cerebellar Purkinje cells in non-anesthetized mice. Neurosci Lett. 2004;367:171–178. doi: 10.1016/j.neulet.2004.05.109. [DOI] [PubMed] [Google Scholar]
- Steriade M, Nu;ñez A, Amzica F. A novel slow (< 1 Hz) oscillation of neocortical neurons in vivo depolarizing and hyerpolarizing components. J Neurosci. 1993a;13:3252–3265. doi: 10.1523/JNEUROSCI.13-08-03252.1993. [DOI] [PMC free article] [PubMed] [Google Scholar]
- Steriade M, Nu;ñez A, Amzica F. Intracellular analysis of relations between the slow (< 1 Hz) neocortical oscillation and other sleep rhythms of the electroencephalogram. J Neurosci. 1993b;13:3266–3283. doi: 10.1523/JNEUROSCI.13-08-03266.1993. [DOI] [PMC free article] [PubMed] [Google Scholar]
- Swensen AM, Bean BP. Ionic mechanisms of burst firing in dissociated Purkinje neurons. J Neurosci. 2003;23:9650–9663. doi: 10.1523/JNEUROSCI.23-29-09650.2003. [DOI] [PMC free article] [PubMed] [Google Scholar]
- Szapiro G, Barbour B. Multiple climbing fibers signal to molecular layer interneurons exclusively via glutamate spillover. Nat Neurosci. 2007;10:735–742. doi: 10.1038/nn1907. [DOI] [PubMed] [Google Scholar]
- Szapiro G, Barbour B. Parasynaptic signalling by fast neurotransmitters: the cerebellar cortex. Neurcscience. 2009;162:644–655. doi: 10.1016/j.neuroscience.2009.03.077. [DOI] [PubMed] [Google Scholar]
- Tai Z, Chorev E, Yarom Y. State-dependent modification of complex spike waveforms in the cerebellar cortex. Cerebellum. 2008;7:577–582. doi: 10.1007/s12311-008-0058-4. [DOI] [PubMed] [Google Scholar]
- Traub RD, Middlelon SJ, Knöpfel T, Whittington MA. Model of very fast (> 75 Hz) network oscillations generated by electrical coupling between the proximal axons of cerebellar Purkinje cells. Eur J Neurosci. 2008;28:1603–1616. doi: 10.1111/j.1460-9568.2008.06477.x. [DOI] [PMC free article] [PubMed] [Google Scholar]
- Weber JT, De Zeeuw Cl, Linden DJ, Hansel C. Long-term depression of climbing fiber-evoked calcium transients in Purkinje cell dendrites. Proc Natl Aced Sci U S A. 2003;100:2878–2883. doi: 10.1073/pnas.0536420100. [DOI] [PMC free article] [PubMed] [Google Scholar]
- Williams SR, Christensen SR, Stuart GJ, Häusser M. Membrane potential bistability is controlled by the hyperpolarization-activated current I(H) in rat cerebellar Purkinje neurons in vitro. J Physiol. 2002;539:469–483. doi: 10.1113/jphysiol.2001.013136. [DOI] [PMC free article] [PubMed] [Google Scholar]
- Womack M, Khodakhah K. Active contribution of dendrites to the tonic and trimodal patterns of activity in cerebellar Purkinje neurons. J Neurosci. 2002;22:10603–10612. doi: 10.1523/JNEUROSCI.22-24-10603.2002. [DOI] [PMC free article] [PubMed] [Google Scholar]
- Womack MD, Khodakhah K. Dendritic control of spontaneous bursting in cerebellar Purkinje cells. J Neurosci. 2004;24:3511–3521. doi: 10.1523/JNEUROSCI.0290-04.2004. [DOI] [PMC free article] [PubMed] [Google Scholar]
- Yartsev MM, Givon-Mayo R, Maller M, Donchin O. Pausing Purkinje cells in the cerebellum of the awake cat. Front Syst Neurosci. 2009;3:2. doi: 10.3389/neuro.06.002.2009. 0.3389/neuro.06.002.2009 Epub 2009 Feb 10. [DOI] [PMC free article] [PubMed] [Google Scholar]