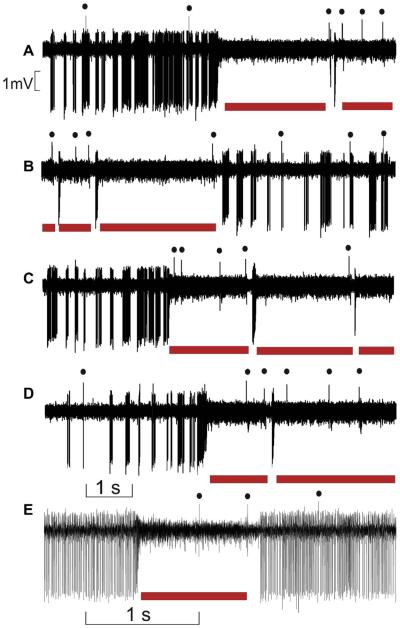
Fig. 2.
Emergence of the 600-Hz buzz. (A–E) Example of extracellular recordings of one representative PC presenting episode of 600-Hz buzz corresponding to the thickening trace of the recorded signal and underlined by red horizontal bars. The black dots index CS firing. Note that the number of CS increase during the 600-Hz buzz. (For interpretation of the references to color in this figure legend, the reader is referred to the web version of this article.)

