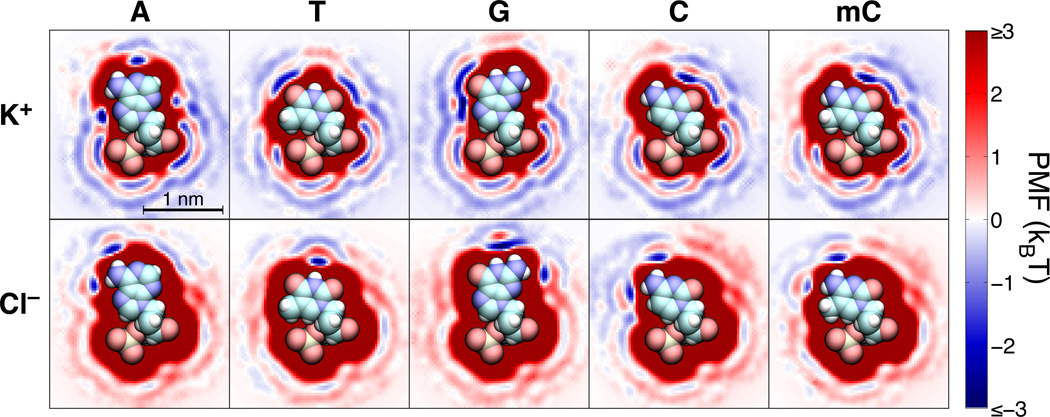
Fig. 1.
The interaction free energy of K+ and Cl− ions with individual DNA nucleotides. Each image shows a cross section of the corresponding three-dimensional free energy map within the plane of the nucleotide’s base. The three-dimensional free-energy maps were obtained by the umbrella sampling method from explicit solvent all-atom MD simulations33. The energies are shown in units of kBT at a temperature of 295 K. Atomic renderings of the nucleic acid structures are faithfully overlaid on the free-energy cross sections. Hydrogen, carbon, nitrogen, oxygen, and phosphorus atoms are shown, respectively, as white, cyan, blue, red, and beige spheres.

