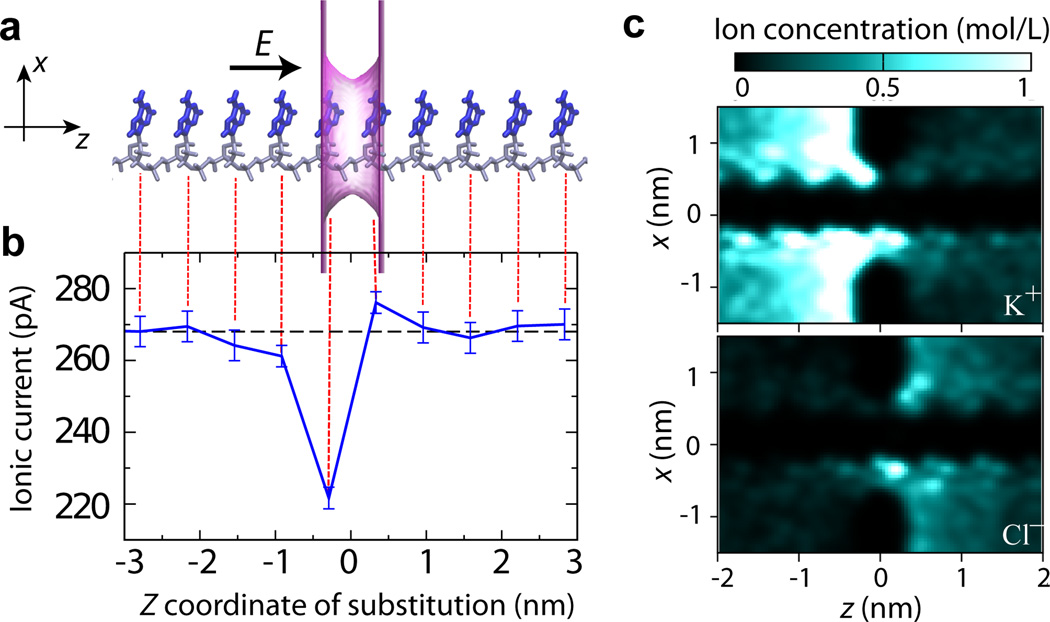
Fig. 3.
The effect of the location of a single nucleotide substitution on the ionic current blockade. (a) Schematics of a simulation system. A poly(dA)18 homopolymer in an idealized (repeat) conformation it threaded through a phantom nanopore. The phantom nanopore has an elliptical cross section of 1.6 nm × 1.1 nm and an effective thickness of 0.7 nm. The phantom pore is shown as a translucent magenta surface; the bases and backbone of DNA are drawn in blue and gray, respectively; only ten nucleotides nearest to the pore are shown. The arrow indicates the direction of the applied electric field that produces a transmembrane bias of 175 mV. The system contains K+ and Cl− ions (not shown) corresponding to bulk ion concentration is 0.1 M. (b) Ionic current (blue) as a function of the location of a single G base substitution in a poly(dA) homopolymer. The center of the phantom pore is located at z = 0. Each data point was obtained by averaging multiple ARBD trajectories for an aggregate simulation time of 10 µs; the error bars indicate the standard error of the mean. The dashed black line indicates the ionic current for the poly(dA) homopolymer (without any base substitutions). The image of the simulation system (panel a) is aligned with the z-coordinate axis of the plot to visually indicate the locations of the G base substitutions. (c) The local concentration of K+ (top) and Cl− (bottom) ions near the nanopore. The density maps illustrate the average ion distribution within the x – z cross section of the simulation system along the nanopore axis (the z axis).

