Abstract
Epithelial cells receive growth and survival stimuli through their attachment to an extracellular matrix (ECM)1. Overcoming the addiction to ECM-induced signals is required for anchorage-independent growth, a property of most malignant cells2. Detachment from ECM is associated with enhanced reactive oxygen species (ROS) due to altered glucose metabolism2. Here we identify an unconventional pathway that supports redox homeostasis and growth during adaptation to anchorage independence. We observed that detachment from monolayer culture and growth as anchorage-independent tumor spheroids was accompanied by changes in both glucose and glutamine metabolism. Specifically, oxidation of both nutrients was suppressed in spheroids, whereas reductive formation of citrate from glutamine was enhanced. Reductive glutamine metabolism was highly dependent on cytosolic isocitrate dehydrogenase-1 (IDH1), because the activity was suppressed in cells homozygous null for IDH1 or treated with an IDH1 inhibitor. This activity occurred in absence of hypoxia, a well-known inducer of reductive metabolism. Rather, IDH1 mitigated mitochondrial ROS in spheroids, and suppressing IDH1 reduced spheroid growth through a mechanism requiring mitochondrial ROS. Isotope tracing revealed that in spheroids, isocitrate/citrate produced reductively in the cytosol could enter the mitochondria and participate in oxidative metabolism, including oxidation by IDH2. This generates NADPH in the mitochondria, enabling cells to mitigate mitochondrial ROS and maximize growth. Neither IDH1 nor IDH2 was necessary for monolayer growth, but deleting either one enhanced mitochondrial ROS and reduced spheroid size, as did deletion of the mitochondrial citrate transporter protein. Together, the data indicate that adaptation to anchorage independence requires a fundamental change in citrate metabolism, initiated by IDH1-dependent reductive carboxylation and culminating in suppression of mitochondrial ROS.
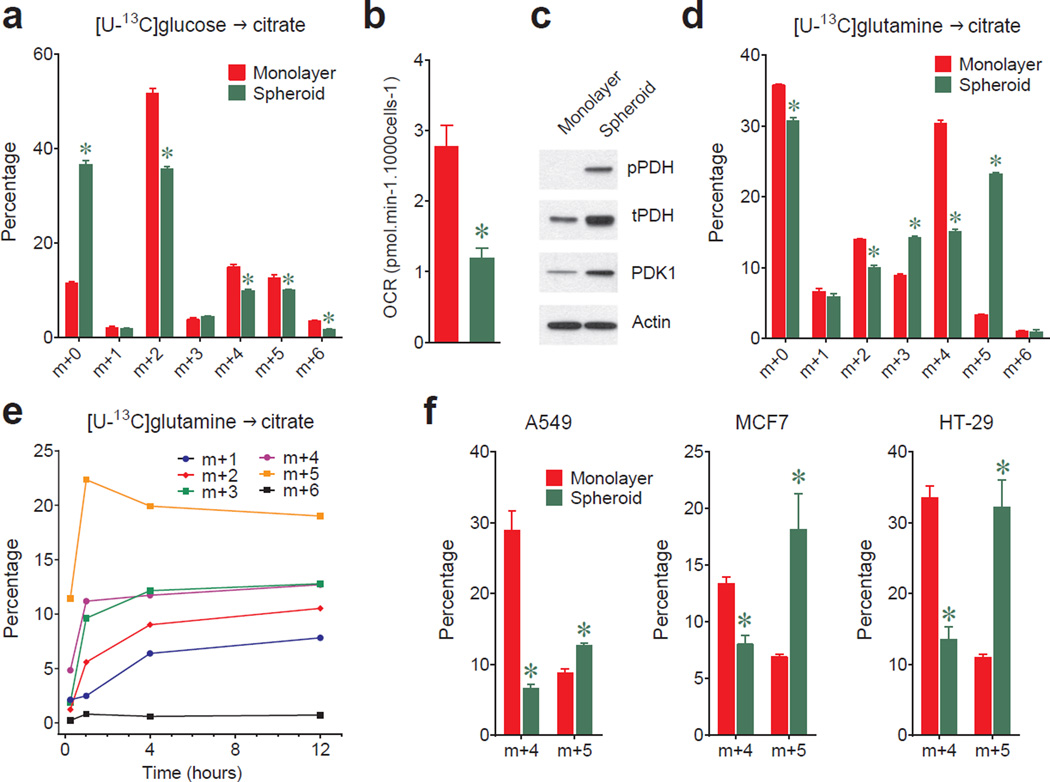
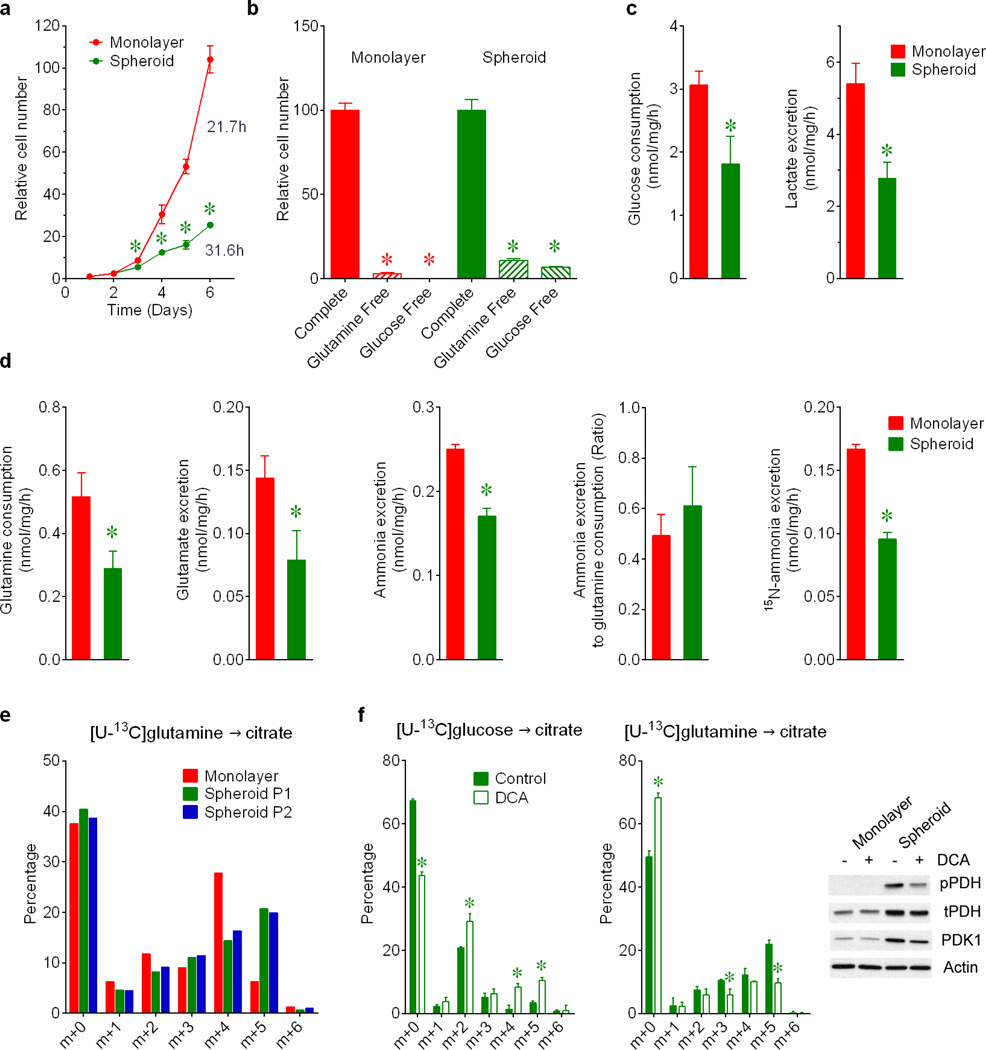
In monolayer cultures, growth factors direct cells to take up glucose and glutamine and use them to produce macromolecules. Both nutrients are used to produce the lipogenic precursor citrate (Extended Data Fig.1a). To identify metabolic alterations during anchorage independence, H460 lung cancer cells were detached from monolayers and aggregated into spheroids. Cells within spheroids proliferated at a reduced rate (Extended Data Fig.2a). Although growth in both conditions required glucose and glutamine (Extended Data Fig.2b), spheroids consumed less of both and secreted less lactate, glutamate and ammonia (Extended Data Fig.2c,d). The ratio of ammonia released to glutamine consumed was comparable between conditions (Extended Data Fig.2d). Spheroids displayed reduced entry of glucose-derived carbon into citrate (Fig.1a) and consumed less oxygen per cell (Fig.1b). These findings implied reduced pyruvate dehydrogenase (PDH) activity, as demonstrated previously during matrix detachment3. Indeed, inhibitory PDH phosphorylation and expression of PDH kinase-1 (PDK1) were elevated in spheroids (Fig.1c). Citrate labeling from [U-13C]glutamine persisted in spheroids (Fig.1d), but the 13C distribution was altered, particularly in that the m+5 fraction (the fraction containing five 13C nuclei) exceeded m+4 (Fig.1d). This persisted when cells were disaggregated and permitted to reform spheroids (Extended Data Fig.2e). The m+5 fraction appeared rapidly and endured as the most prominent labeled form (Fig.1e), regardless of the type of culture medium (Supplementary Table 1; this Table contains all 13C data throughout the paper). Because PDH inhibition can alter glutamine metabolism4, we examined the effect of the PDK1 inhibitor dichloroacetate (DCA), which activates PDH, on 13C labeling. DCA enhanced glucose-dependent citrate labeling and reduced the m+5 fraction from [U-13C]glutamine (Extended Data Fig.2f), indicating that m+5 citrate resulted from reduced PDH activity.
Figure 1. Reductive glutamine metabolism in spheroids.
a, Mass isotopolgue analysis of citrate in H460 cells cultured with [U-13C]glucose and unlabeled glutamine (n=3 cultures from a representative experiment). b, Oxygen consumption rates (OCR) of cells grown in monolayer or spheroid culture (n=10 monolayer cultures and 11 spheroids from a representative experiment). c, Western blot for total (t) and phosphorylated (p, Ser293) PDH, and PDH kinase-1 (PDK1). d, Mass isotopologue analysis of citrate in cells cultured with [U-13C]glutamine and unlabeled glucose (n=3 cultures from a representative experiment). e, Evolution of citrate mass isotopologues in spheroids cultured with [U-13C]glutamine (n=2 cultures for each time point). f, Citrate m+4 and m+5 isotopologues in monolayer and spheroid cultures of A549, HT-29 and MCF7 cells cultured with [U-13C]glutamine (n=3 A549 monolayer cultures; n=4 cultures for all other conditions). Complete mass isotopologue distributions are in Supplementary Table 1. *p<0.05, Welch's unequal variances t-test. All experiments were repeated 3 times or more.
Culture with [1-13C]glutamine demonstrated that spheroids induced reductive glutamine metabolism to generate isocitrate/citrate (Extended Data Fig.3a). Reductive citrate labeling was observed in spheroids from multiple lung, colon and breast cancer cell lines (Fig.1f). However, labeling of other TCA cycle intermediates predominantly reflected oxidative (m+4) rather than reductive (m+3) metabolism (Extended Data Fig.3b). To test whether reductive metabolism occurred in non-transformed cells, we compared [U-13C]glutamine metabolism between lung cancer cells and nonmalignant bronchial epithelial cells (BECs) from the same patient5. Cancer cells but not BECs displayed enhanced citrate m+5 labeling upon detachment (Extended Data Fig.3c).
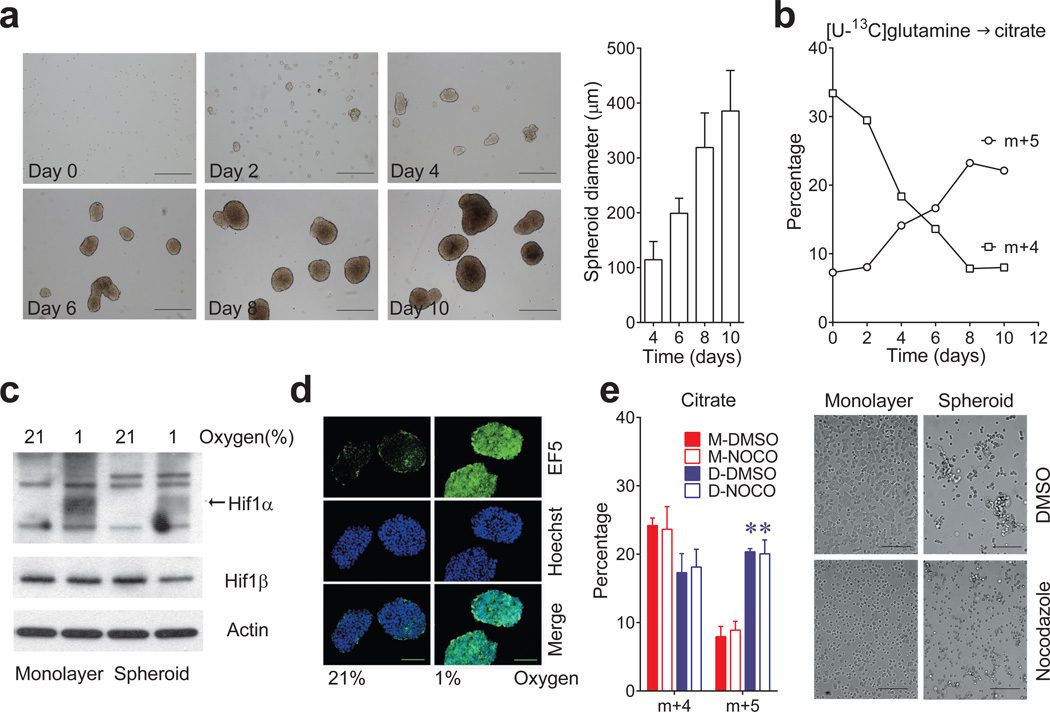
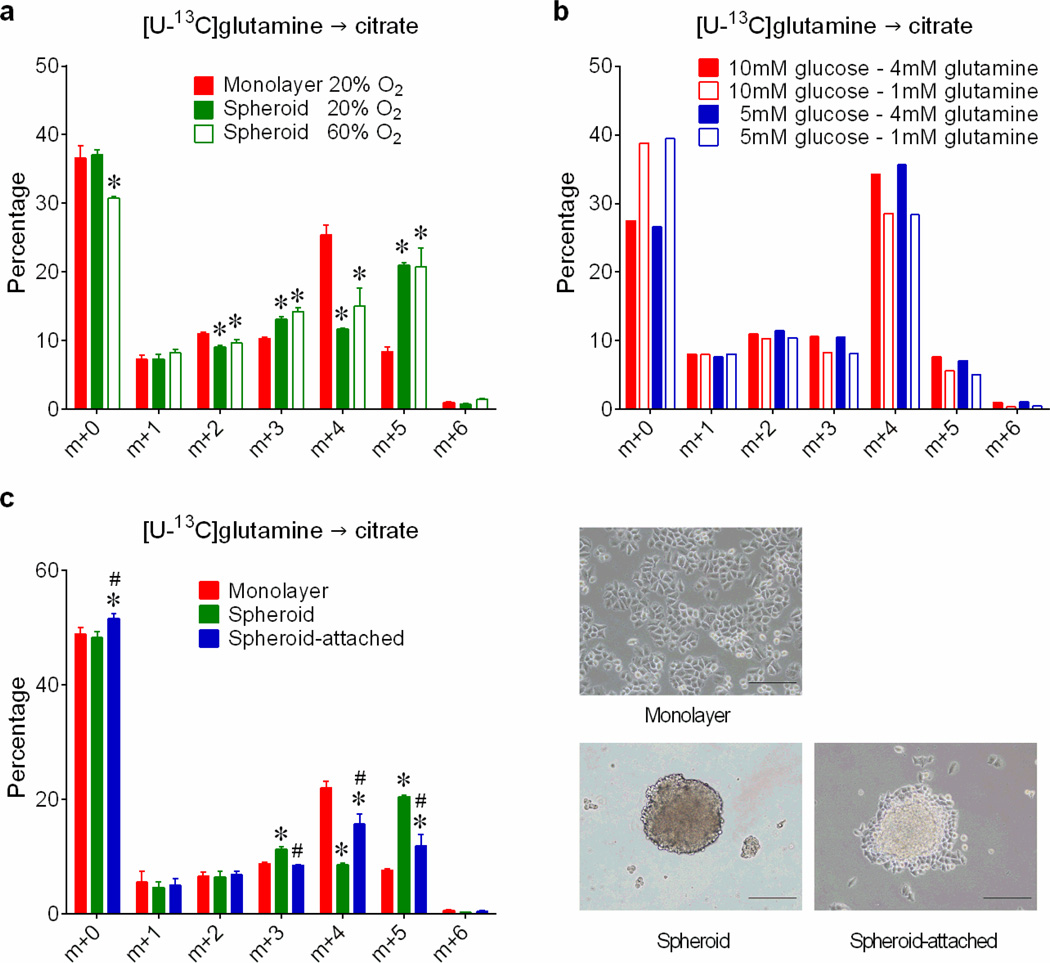
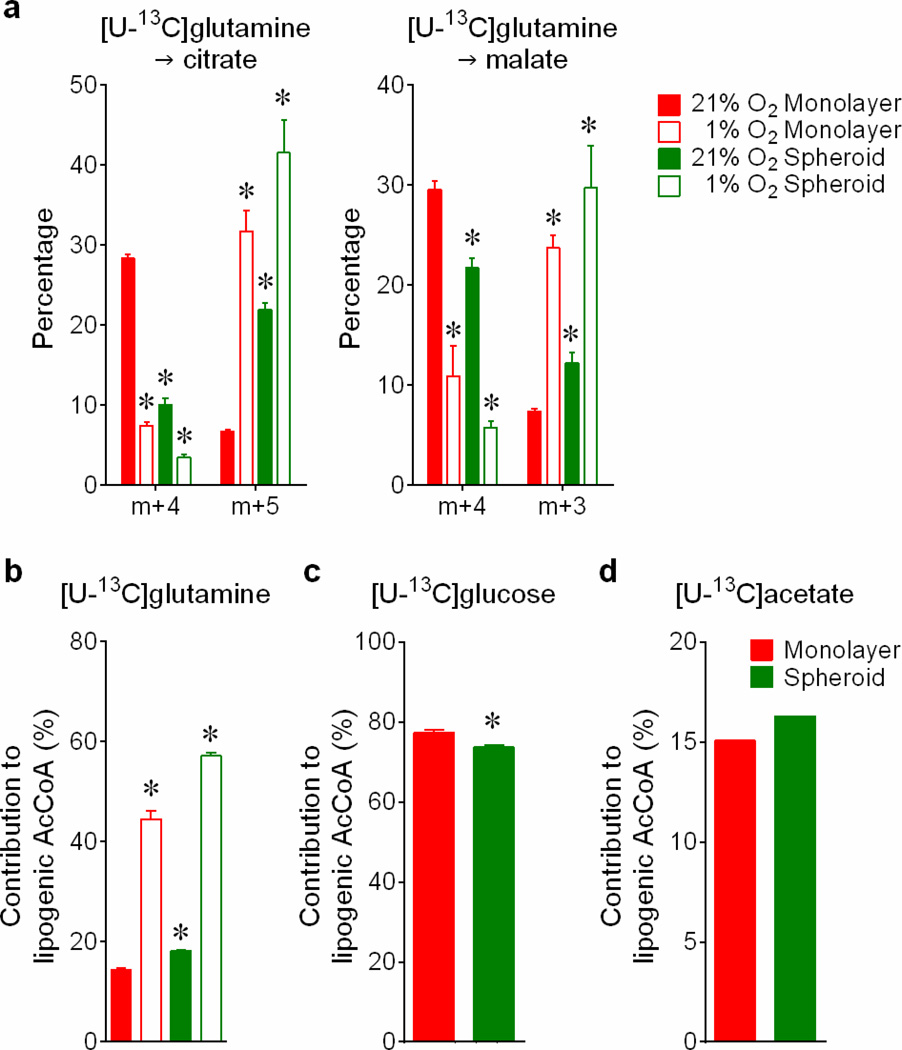
Reductive carboxylation is enhanced during hypoxia through a HIF1-dependent mechanism that transmits glutamine carbon to fatty acids6. Although large spheroids contain gradients of oxygenation, reductive labeling occurred in spheroids much smaller than the limit of oxygen diffusion7 (Fig.2a,b), and hyperoxia did not normalize citrate m+5 (Extended Data Fig.4a). We detected neither HIF1α stabilization nor staining with a hypoxia probe in spheroids cultured under 21% oxygen (Fig.2c,d). Furthermore, although large spheroids contain gradients of nutrient availability8, experimentally reducing glucose/glutamine availability did not increase citrate m+5 (Extended Data Fig.4b). Most compellingly, detachment without aggregation was sufficient to enhance citrate m+5 (Fig.2e), and spheroids lost the reductive pattern when allowed to adhere to plastic (Extended Data Fig.4c). Hypoxia elicited numerous labeling changes distinct from patterns observed in normoxic spheroids (Extended Data Fig.5a and Supplemental Discussion). Strikingly, reductive citrate labeling was not associated with increased contribution of glutamine to palmitate unless the spheroids were cultured under hypoxia (Extended Data Fig.5b). Glucose was the predominant lipogenic carbon source in both monolayer and spheroid cells (Extended Data Fig.5c). Acetate, a source of lipogenic acetyl-CoA in hypoxia9, was only a minor source of lipogenic carbon in normoxic H460 spheroids (Extended Data Fig.5d). Together, these data suggest that anchorage loss per se rather than oxygen/nutrient limitation stimulates a mode of reductive metabolism distinct from hypoxia.
Figure 2. Spheroid metabolism is distinct from the metabolic alterations induced by hypoxia.
a, Time-dependent increase in H460 spheroid diameter. Scale bars, 500 µm. (n=20 spheroids on days 4 and 6; n=18 spheroids on day 8; n=16 spheroids on day 10). b, Citrate isotopologues in spheroids cultured for 4h with [U-13C]glutamine and unlabeled glucose (n=2 cultures for each time point). c, Effect of hypoxia on HIF1α protein expression in monolayer and spheroid culture. HIF1α protein is indicated by an arrow, with nonspecific bands also present on the blot. d, EF5 staining in sectioned spheroids cultured under 21% or 1% oxygen for 16 hours. Scale bars, 100 µm. e, Citrate m+4 and m+5 isotopologues in monolayer (M) or detached (D) H460 cells labeled with [U-13C]glutamine and treated with DMSO or nocodazole (NOCO) to prevent aggregation (n=4 cultures from two experiments). Scale bars, 200 µm. *p<0.05, Welch's unequal variances t-test followed by multiple-comparison correction. Experiments in a and b were repeated twice. Experiments in c, d and e were repeated 3 times or more.
We next used metabolic flux analysis to better understand the metabolic effects of anchorage loss. Steady state fluxes were calculated by integrating extracellular flux rates and 13C distributions in several metabolites from multiple tracers (see Methods and Supplementary Tables 2 and 3). Modeling with a set of conventional reactions and compartmentation did not produce an adequate fit for the spheroid data (Extended Data Fig.6a). This was related to discrepant labeling between citrate, which contained evidence of enhanced reductive carboxylation, and palmitate, which did not. To rectify this discrepancy, we modified the model to force isocitrate/citrate produced reductively in the cytosol into the mitochondria, as if by channeling (Extended Data Fig.6b). This pool then mixed with mitochondrial isocitrate/citrate before being used for fatty acid synthesis in the cytosol. This modification greatly improved the model’s ability to fit the data, with the resulting fit indicating persistent but reduced glycolysis, PDH flux and glucose/glutamine oxidation in spheroids, as well as an enhanced reductive IDH flux in the cytosol (Extended Data Fig.6b and Table 1). The model also indicated bidirectional isocitrate/citrate traffic across the mitochondrial membrane, with net flux in the direction of export to the cytosol.
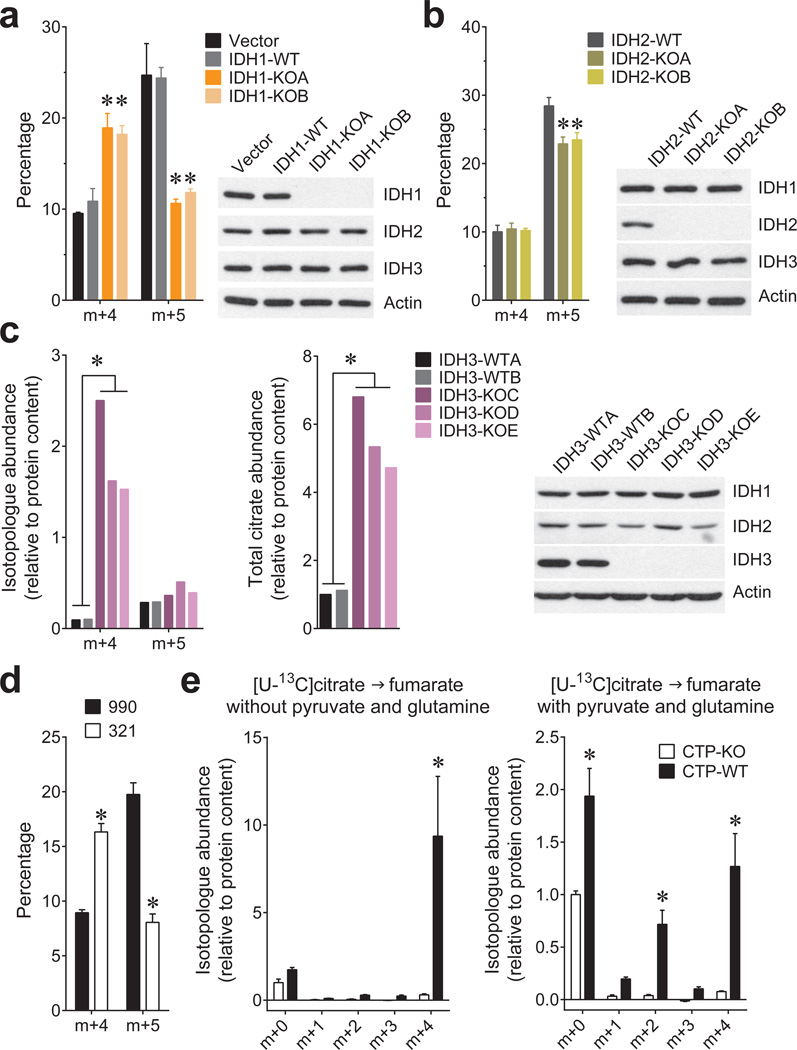
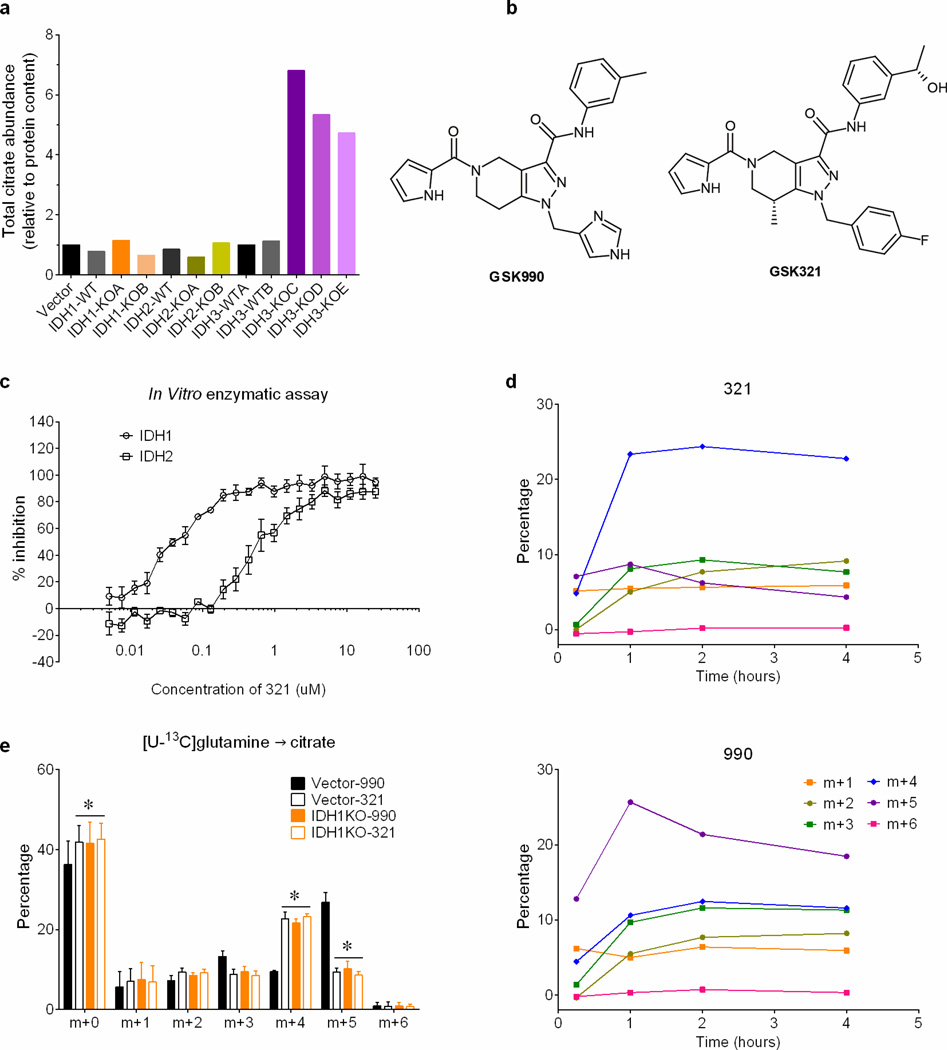
Mammals contain three IDH isoforms. IDH1 and IDH2 catalyze the reversible, NADP+/NADPH-dependent interconversion of isocitrate and αKG in the cytosol and mitochondria, respectively, and participate in reductive carboxylation10. IDH3 is mitochondrial, NAD+-dependent and essentially irreversible11. To determine the roles of all three isoforms in spheroids, CRISPR/Cas9 was used to generate H460 clones lacking each one. IDH1 or IDH2 deletion reduced citrate m+5, although the effect of IDH1 was more pronounced (Fig.3a,b). Deleting IDH3 caused a large accumulation of citrate (Fig.3c), whereas deleting IDH1 or IDH2 had only minor effects on citrate abundance (Extended Data Fig.7a). Thus, IDH3 is primarily responsible for citrate oxidation in the TCA cycle while IDH1 is primarily responsible for reductive carboxylation. Like IDH1 deletion, an IDH1 inhibitor (compound 321)12 eliminated the spheroids’ gain in citrate m+5 and enhanced the m+4 fraction (Fig.3d and Extended Data Fig.7b–e). The drug had no effect on citrate m+5 in IDH1-deleted spheroids, consistent with its selectivity for IDH1 (Extended Data Fig.7e).
Figure 3. Reductive carboxylation in spheroids is primarily dependent on cytosolic IDH1.
Fractional abundance of citrate m+4 and m+5 in spheroids containing or lacking IDH1 (a) or IDH2 (b) cultured in [U-13C]glutamine (n=3 cultures from two experiments). c, Abundance of total citrate and of citrate m+4 and m+5 from [U-13C]glutamine in H460 spheroids containing or lacking IDH3 (n=2 cultures from a representative experiment). d, Fractional abundance of citrate m+4 and m+5 in H460 spheroids cultured with [U-13C]glutamine and treated with an IDH1 inhibitor (321) or a structurally similar control compound (990) (n=4 cultures from two experiments). e, Fumarate mass isotopologues in mitochondria isolated from cells containing or lacking the citrate transporter protein (CTP-WT and CTP-KO, respectively). Isolated mitochondria were cultured with [U-13C]citrate as the sole carbon source (left), or [U-13C]citrate with unlabeled pyruvate and glutamine (right) (n=4 cultures from two experiments). *p<0.05, ANOVA (a–b), or Welch's unequal variances t-test (c–e). All experiments were repeated 3 times or more.
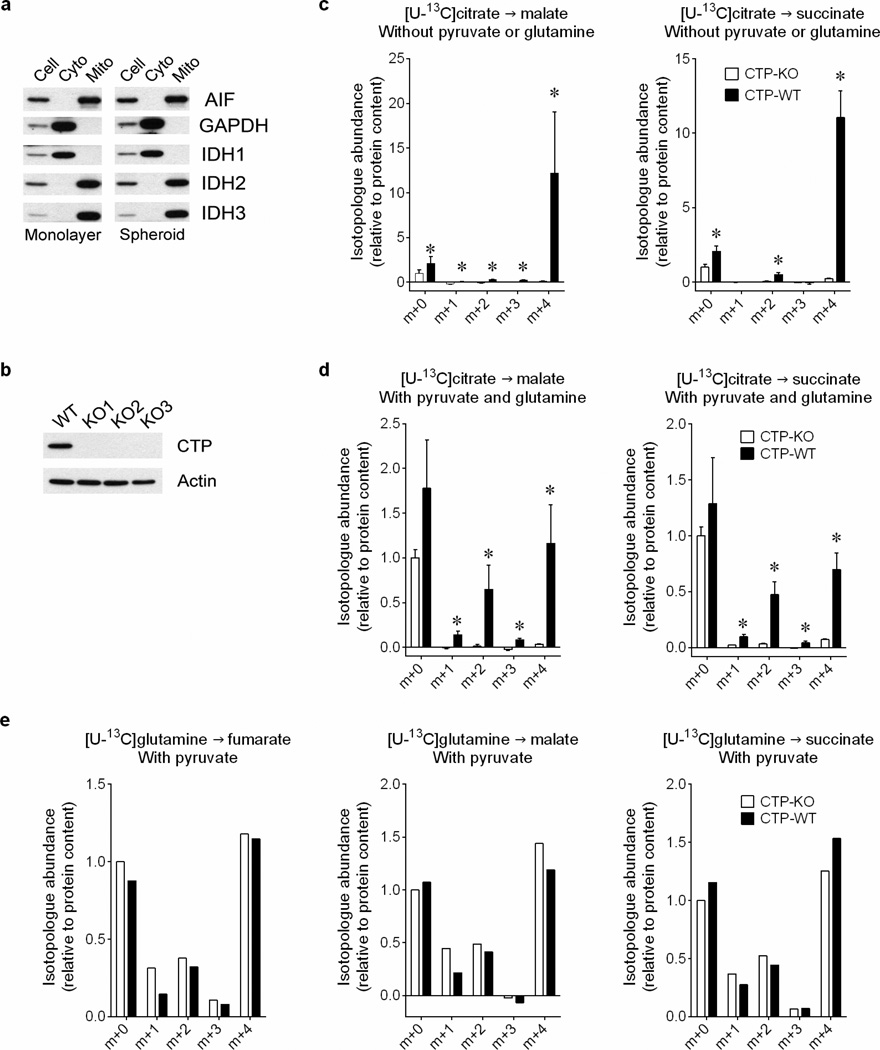
Because reductive citrate metabolism was not associated with enhanced palmitate labeling from glutamine, we tested whether citrate was transported into mitochondria, as predicted by the model. Citrate export to the cytosol through a citrate transporter protein (CTP) encoded by SLC25A1 is a key component of lipogenesis13, but mitochondrial citrate import has also been reported14. We prepared mitochondria from H460 cells containing or lacking CTP and examined their ability to metabolize citrate (Extended Data Fig.8a,b). CTP-wild type mitochondria took up [U-13C]citrate and converted it to succinate, fumarate and malate, with the majority of these intermediates labeled as m+4 in the first turn of the TCA cycle (Fig.3e and Extended Data Fig.8c). Adding unlabeled glutamine and pyruvate to [U-13C]citrate resulted in m+2 labeling from multiple turns (Fig.3e and Extended Data Fig.8d). Labeling from [U-13C]citrate was essentially absent in CTP-deficient mitochondria, even though [U-13C]glutamine was metabolized normally (Fig.3e and Extended Data Fig.8c–e).
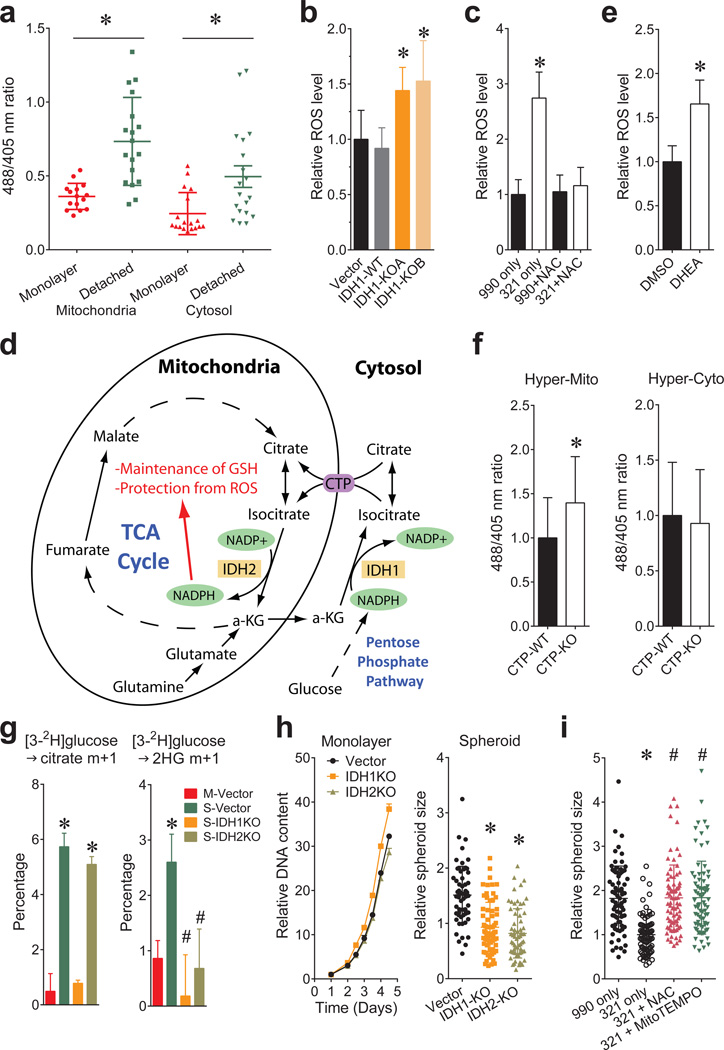
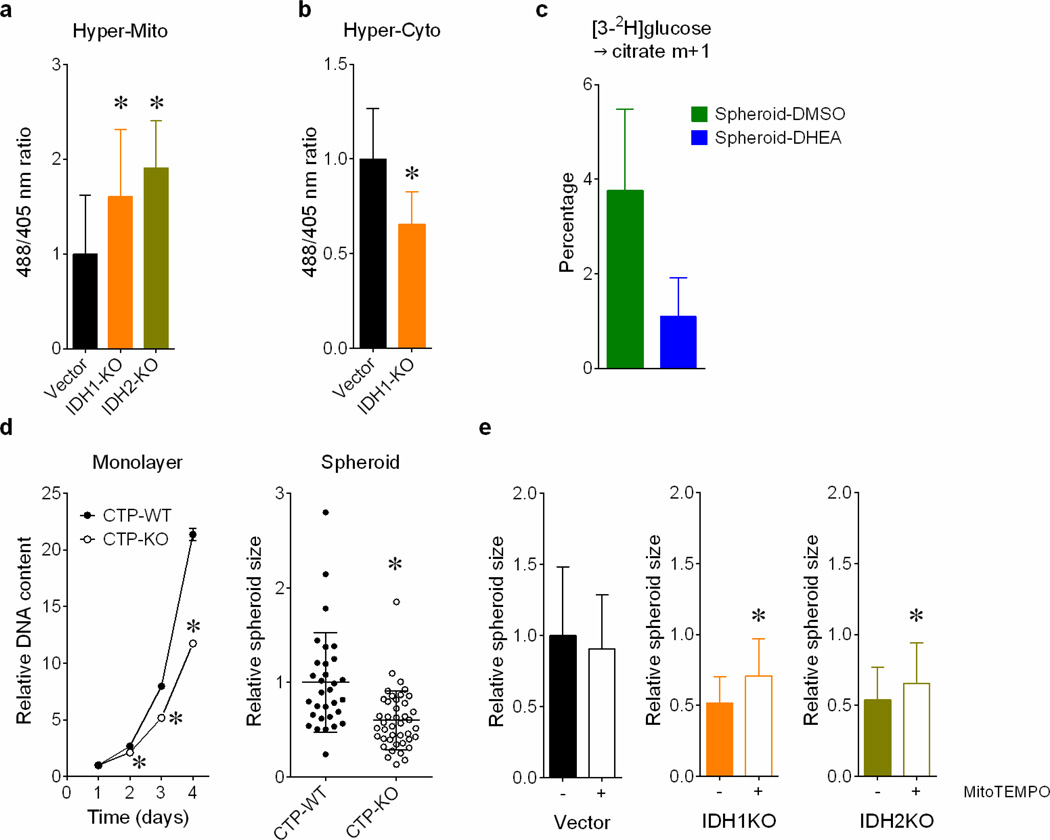
In non-transformed breast epithelial cells, matrix detachment enhances ROS by reducing pentose phosphate pathway (PPP) activity, but oncogenes sustain the PPP and viability during detachment2. Transgenic reporters that sense ROS in either the cytosol or mitochondria15 revealed that detachment increased ROS in both compartments, but particularly the mitochondria (Fig.4a). IDH1 knockout (Fig.4b) or inhibition with 321 (Fig.4c) further increased mitochondrial ROS, consistent with a pathway in which isocitrate/citrate is formed through NADPH-dependent reductive carboxylation in the cytosol, followed by metabolism of one or both metabolites in the mitochondria to produce NADPH and fortify ROS defenses (Fig.4d and Extended Data Fig.1b). Consistent with this model, both the PPP inhibitor dehydroepiandrosterone (DHEA) and IDH2 knockout enhanced mitochondrial ROS (Fig.4e and Extended Data Fig.9a). IDH1 knockout reduced cytosolic ROS, suggesting that PPP-derived NADPH is repurposed to counteract cytosolic ROS in the absence of IDH1 (Extended Data Fig.9b). CTP knockout enhanced mitochondrial ROS without affecting cytosolic ROS, as predicted if mitochondrial isocitrate/citrate import generates reducing equivalents to mitigate mitochondrial ROS (Fig.4f).
Figure 4. Reductive glutamine metabolism mitigates mitochondrial ROS and promotes spheroid growth.
a, Transient expression of mitochondrial and cytosolic hydrogen peroxide reporter (HyPer) vectors in H460 cells. Cells were cultured under monolayer or detached conditions for 48 hours before imaging to assess ROS levels. (n=15 HyperMito monolayer cells; n=18 HyperMito detached cells; n=18 HyperCyto monolayer cells; n=19 HyperCyto detached cells). b, Staining of parental or IDH1-deficient H460 spheroids with the mitochondrial ROS sensor MitoSOX. (n=16 Vector spheroids; n=18 IDH1-WT spheroids; n=17 IDH1-KOA spheroids; n=15 IDH1-KOB spheroids). c, Effect of IDH1 inhibition by compound 321 and the ROS scavenger N-acetylcysteine (NAC) on MitoSOX signal in H460 spheroids. (n=31 990 only spheroids; n=25 321 only spheroids; n=33 990+NAC spheroids; n=30 321+NAC spheroids). d, Pathway through which cytosolic reductive carboxylation, followed by isocitrate/citrate import into the mitochondria, can contribute to the mitochondrial NADPH pool and suppress mitochondrial ROS. e, MitoSOX staining of DHEA-treated H460 spheroids (n=53 spheroids for each condition). f, HyPer signal for mitochondrial (left) and cytosolic (right) ROS in H460 cells containing or lacking CTP. (n=28 HyperCyto CTP-KO cells; n=35 cells for all other conditions). g, Labeling from [3-2H]glucose in citrate (left) or 2-HG (right) in H460-derived cells expressing mutant IDH2 and containing or lacking wild type IDH1 and IDH2 (n=3 cultures, *p<0.05, comparing to M-Vector, #p<0.05, comparing to S-Vector). M, monolayer; S, spheroid. h, Monolayer and spheroid growth of H460 cells containing or lacking IDH1 or IDH2. (n=6 monolayer cultures for each cell line; n=59 Vector spheroids; n=70 IDH1-KO spheroids; n=65 IDH2-KO spheroids). i, Spheroid size after 8 days of 321 treatment, with or without NAC or the mitochondrial ROS scavenger MitoTEMPO. (n=75 990 only spheroids; n=77 321 only spheroids; n=81 321+NAC spheroids; n=77 321+MitoTEMPO spheroids, #p<0.05 comparing to treatment with 321 only). *,#p<0.05, ANOVA (b, c, g, h and i), or Welch's unequal variances t-test (a, e and f). Experiment in f were repeated twice, and all other experiments were repeated 3 times or more.
To examine reducing equivalent metabolism, H460 cells were cultured with [3-2H]glucose, which labels cytosolic NADPH via the PPP, but does not transfer 2H to TCA cycle metabolites in monolayer culture16. We generated parental, IDH1- and IDH2-knockout H460 cells expressing a mutant IDH2 that produces 2-hydroxyglutarate (2HG) in an NADPH-dependent mitochondrial reaction. Thus, 2H labeling of 2HG reflects mitochondrial NADPH labeling16. As expected, citrate was not labeled from [3-2H]glucose in monolayer cells. However, spheroids contained substantial citrate labeling that required IDH1 but not IDH2 (Fig.4g) and was suppressed by DHEA (Extended Data Fig.9c). Similarly, 2HG was essentially unlabeled in monolayer cells, but labeling was evident in spheroids; here, labeling required both IDH1 and IDH2 (Fig.4g). All these data are consistent with the pathway in Fig.4d.
Finally, CTP-, IDH1- and IDH2-deficient cells were challenged to grow as spheroids. CTP deletion suppressed growth in both monolayer and spheroids, reflecting the transporter’s dual roles in lipogenesis and ROS mitigation (Extended Data Fig.9d). By contrast, IDH1 and IDH2 were dispensable in monolayers, but loss of either enzyme suppressed average spheroid size by half (Fig.4h) and growth could be partially rescued with the mitochondrial ROS scavenger MitoTEMPO (Extended Data Fig.9e). Treatment with 321 also reduced spheroid size, and this was completely rescued by MitoTEMPO or N-acetylcysteine (NAC) (Fig.4i).
Protection against oxidative stress is thought to be one aspect of metabolic reprogramming that supports cancer cell fitness17,18. Anchorage independence induces additional oxidative stress resulting in death unless NADPH-producing pathways are engaged2. The finding that IDH1 is required to regulate mitochondrial ROS was surprising. IDH1 and IDH2 participate in a cycle transmitting NADPH from mitochondria to cytosol19. Our data suggest that this pathway also operates in reverse to transfer reducing equivalents from the PPP into the mitochondria. This pathway enables an alternative form of redox regulation and suggests a possible metabolic intervention to suppress anchorage independence. The importance of this pathway for redox homeostasis is remarkable considering that the net direction of citrate trafficking in spheroids is from the mitochondria to the cytosol to supply fatty acid synthesis. The isocitrate/citrate fluxes responsible for ROS mitigation may arise from metabolite compartmentation involving mechanisms yet to be characterized. The data imply that limiting mitochondrial rather than cytosolic oxidative stress is crucial for anchorage independence, because IDH1 loss enhanced the former while reducing the latter, culminating in reduced spheroid size.
Methods
Reagents
MitoSOX™ Red mitochondrial superoxide indicator was from Life Technologies. MitoTEMPO, N-Acetylcysteine (NAC), Nocodazole, DHEA and DCA were from Sigma. The IDH1 inhibitor 321 and control compound 990 were from GlaxoSmithKline12.
Cell lines and culture
Cell lines were identified using DNA fingerprinting. H460 and A549 cells were cultured in RPMI supplemented with penicillin/streptomycin, 5% fetal bovine serum (FBS), L-glutamine (4 mM) and 1mM HEPES. HT-29 and MCF7 were cultured in DMEM supplemented with penicillin/streptomycin, 10% fetal bovine serum (FBS), L-glutamine (4 mM) and 1mM HEPES. HBEC30 and HCC4017 cells were cultured in defined medium5. Dishes with an Ultra-Low Attachment surface were used for suspension and spheroid culture. Identical culture medium was used for monolayer and spheroid culture. For spheroids, 2×10⁵ H460 cells were plated in a 10cm Ultra-Low Attachment dish. The medium was changed on days 4, 6 and 7 of culture, by centrifuging at 50×g for 3 minutes, then gently resuspending in fresh medium. For labeling assays, the spheroids were resuspended in medium containing 13C-labeled nutrients, and the time of resuspension was considered time 0 of the labeling period.
CRISPR/Cas9-mediated recombination
IDH1, IDH2, IDH3 and SLC25A1-deficient H460 cell lines were generated using the CRISPR/Cas9 system20. Wild type clones were selected from both the control vector (Vector) and targeting vector transfections (WT). In order to control for variations among individual clones, 4 to 5 clones were pooled together, and different pools for each targeted gene were used for further experiments.
Cell growth assays
Cell proliferation was measured by counting cells after trypsinization. DNA content was also used to monitor monolayer cell growth, as previously described21. Spheroid size was determined by measuring the maximum cross-sectional area of individual spheroids using ImageJ software.
Metabolic assays and stable isotope tracing in intact cells
Glucose, lactate, glutamine and glutamate were measured in culture medium using an automated electrochemical analyzer (BioProfile Basic-4 analyzer, NOVA). Ammonia was measured using an enzymatic assay (Megazyme). Nutrients labeled with 13C, 2H or 15N were purchased from Cambridge Isotope Laboratories. Stable isotope tracing experiments to determine isotopologue distributions in soluble metabolites and fatty acids were performed as described previously21,22. For deuterium tracing, H460 clones were engineered to express the IDH2-R172K mutant (mtIDH2) under control of doxycycline16. Clones lacking wild-type IDH1 or IDH2, or containing both, were generated. Spheroids were cultivated for 7 days, then doxycycline (0.2µg/ml) was added for 24h to induce mtIDH2. On day 8, spheroids were cultured in RPMI containing 10mM [3-2H]glucose and unlabeled glutamine for 6h.
Mitochondria isolation and isotope tracing
Mitochondria were prepared with the Qproteome Mitochondria Isolation Kit (Qiagen). Isotope tracing was modified from a previously described procedure21. Mitochondrial pellets were reconstituted in assay buffer (125mM KCl, 10mM Tris/MOPS, 0.1mM EGTA/Tris, 1mM Pi, pH7.4) supplied with indicated nutrients and tracer. For glutamine tracing, 40 µM [U-13C]glutamine and 40 µM unlabeled pyruvate were added to the assay buffer. For citrate tracing, 40 µM [U-13C]citrate with or without 40µM unlabeled glutamine and 40µM unlabeled pyruvate were added to the assay buffer. Mitochondria were incubated in the tracing buffer for 10 min, at 30°C with 500rpm agitation in a heat block.
Metabolic flux analysis (MFA)
Steady state metabolic fluxes were calculated by combining extracellular flux rates (glucose/glutamine utilization, lactate/alanine/glutamate secretion) and 13C mass isotopologue distributions (MIDs) for citrate, glutamate, fumarate, malate, aspartate and palmitate, using the INCA software package23, which applies an elementary metabolite unit framework to efficiently simulate MIDs24,25. We developed reaction networks describing the stoichiometry and carbon transitions of central carbon metabolism (Supplementary Table 2), with assumptions as previously described4 and summarized below. Parallel labeling data from cultures fed [1-13C]glutamine, [5-13C]glutamine, [U-13C]glutamine or [U-13C]glucose were used to simultaneously fit the same network model to estimate intracellular fluxes. Data used in metabolic flux analysis for monolayer and spheroid cultures are reported in Supplementary Table 3. To ensure that a global minimum of fluxes was identified, flux estimations were initiated from random values and repeated a minimum of 50 times. A chi-square test was applied to test goodness-of-fit, and accurate 95% confidence intervals were calculated by assessing the sensitivity of the sum of squared residuals to flux parameter variations. Extended Data Table 1 contains the degrees of freedom and sum-of-squared residuals (SSR) for the best fit model and the lower and upper bounds of 95% confidence intervals for all fluxes.
MFA procedures and assumptions:
During the experiments, cells are at metabolic steady state.
13CO2 produced during oxidation reactions is not reincorporated via carboxylation reactions.
Cells are given 24 hours to metabolize 13C substrates. After 24 hours, it is assumed that the isotopic labeling has reached steady state.
The metabolites succinate and fumarate are symmetrical and their metabolism through the TCA cycle does not produce a particular orientation.
The metabolites pyruvate, acetyl-CoA, citrate, α-ketoglutarate, malate, fumarate and oxaloacetate are metabolically active in both the cytosol and mitochondria. Malate and α-ketoglutarate are allowed to freely mix between the compartments.
During the extraction process, intracellular pools of metabolites are homogenized. Therefore GC-MS analysis of the isotopic enrichment of these metabolites reflects the mixture of distinct metabolic pools. By employing the INCA platform to perform metabolic flux analysis, it is possible to extract meaningful information from these mixed pools. To do this, the model employs parameters to account for the mixing of mitochondrial and cytosolic metabolites.
For flux calculations in spheroids, it is not possible to reconcile the palmitate and citrate labeling from the glutamine tracers by mixing the citrate pool in cytosol. To achieve adequate fits, isocitrate/citrate generated from cytosolic reductive carboxylation is first allowed to mix with mitochondrial citrate. This mixed pool could then be used for oxidation in the TCA cycle and fatty acid synthesis.
Western blotting
Whole cells/spheroids or mitochondrial lysates were prepared in RIPA buffer and quantified using the BCA Protein Assay (Thermo Scientific). Proteins were separated on 4–20% SDS-PAGE gels, transferred to PVDF membranes, and probed with antibodies against IDH1 (ab94571), IDH2 (ab55271), IDH3 (ab58641) from Abcam, PDHα (#459400, Theromo), PDHα-pSer293 (AP1062), GAPDH (AB2302) from Millipore, PDK1 (#3820), Hif1α(#3716) from Cell Signaling, CTP (sc-86392), AIF (sc-13116) from Santa Cruz Biotechnology and Actin (A3853, Sigma).
EF5 staining
Day 7 H460 spheroids were cultured under normoxia (21% oxygen) or hypoxia (1% oxygen) for 16 hours. The spheroids were then treated with 100µM EF5 compound for 3 hours, fixed in 4% paraformaldehyde, and embedded in OCT for frozen sectioning. 10µm spheroid sections were stained with EF5 antibody as previous described26.
Subcellular ROS detection
Cytosolic and mitochondrial ROS levels were measured with the organelle-specific HyPer system as previously described15,27. Briefly, trypsinized H460 cells were transfected with HyPer-cyto or HyPer-mito vectors. Half of the transfected cells were allowed to attach as a monolayer, and the other half were cultured in suspension using Ultra-Low Attachment dishes. Images were acquired 48 hours after transfection, and ROS levels were calculated as the ratio of fluorescence at 488nm and 405nm.
Oxygen consumption rates (OCR)
For monolayer respiration assays, H460 cells were plated in growth media at 3×10⁴ cells per well in XF24 microplates (Seahorse Bioscience; Billerica, MA) 24h prior to the assay following manufacturer’s recommendations for cell seeding. Growth media was changed to XF assay media and the plates were incubated at 37°C in a non-CO2 incubator for 45 min prior to starting the assay. To normalize the data, the cells were trypsinized and counted by hemocytomer or ViCELL automated cell counter (Beckman Coulter). To measure respiration in spheroids, H460 Spheroids were grown for 3 days in 96-well Ultra-Low Attachment round bottom plates (Sigma; Cat# CLS7007) starting with 2×10³ cells per well, resulting in an average spheroid diameter of 401 ± 13 µm. For the respiration assay, spheroids were transferred to a Poly-D-lysine-treated XFe96 Spheroid Microplate (Seahorse Bioscience cat# 102959-100) containing 37°C XF assay media at pH 7.4. Following each assay, the spheroid diameter was measured using images acquired on a Cytation 3 Cell Imaging Reader (BioTek; Winooski, VT). Volume was then calculated using the equation . To normalize the data, the cell number of each spheroid was calculated by dividing the spheroid volume by the single-cell volume (average diameter of H460 cells = 14 µm). This method of calculating spheroid cell number was independently validated in parallel cultures by digesting spheroids with trypsin and manually counting the cells with a hemocytomer.
Determination of wild type IDH1 and IDH2 inhibition
IDH1 was generated as previously described28. IDH2 was expressed in Sf9 cells by baculovirus infection. Cells were lysed in lysis buffer (50mM Tris, pH7.5, 300mM NaCl, 10% glycerol, 1% Triton) by Avestin emulsiflex C50. The supernatants were mixed with anti-Flag resin at 4°C overnight and then eluted with addition of 100 µg/ml Flag peptide in lysis buffer (without Triton). The eluate was concentrated and loaded onto a Superdex 200 size exclusion column and eluted with sizing buffer (25 mM Tris, 100mM NaCl, 1mM DTT, pH 7.5). Fractions containing dimer were pooled and concentrated for use in kinetics. IDH activity was assessed by measuring the evolution of NADPH abundance using a coupled diaphorase/resazurin fluorescence assay29. Reactions were conducted at room temperature in 384-well Greiner black microtiter plates in a total volume of 10 µL of assay buffer. Final compound concentrations were typically varied from 5 to 100,000 nM; the isocitrate concentration was fixed at 10 µM, the NADP+ concentration was fixed at 5 µM, and IDH was fixed at 0.1 nM. Reactions were conducted in quadruplicate and run kinetically. After each addition, plates were centrifuged for 60 s to ensure complete mixing of reagents.
Data were fit to the following equation to determine the where y is the % of normalized enzyme activity, x is the concentration of inhibitor, and s is the Hill slope factor.
Statistics
Experiments in Figures 2a, 2b, 4f, and Extended Data Figures 5d, 7d and 8e were performed twice, and all other experiments were performed 3 times or more. Variation is always indicated using standard deviation. To assess the significance of differences among cultures and conditions, a two-tailed Welch's unequal variances t-test was used to assess the significance between two groups. For three or more groups, a one-way ANOVA followed by Dunnett’s multiple comparisons test was performed. Before applying ANOVA, we first tested whether there was homogeneity of variation among the groups (as required for ANOVA) using the Brown–Forsythe test. Where the assumption of equal variance was violated, a log2 transformation was applied to the data prior to analysis. In a few cases, when significant differences in variation among groups persisted after transformation, we used Welch's unequal variances t-test followed by multiple-comparison correction.
Extended Data
Extended Data Figure 1. Alternative pathways of isocitrate/citrate metabolism.
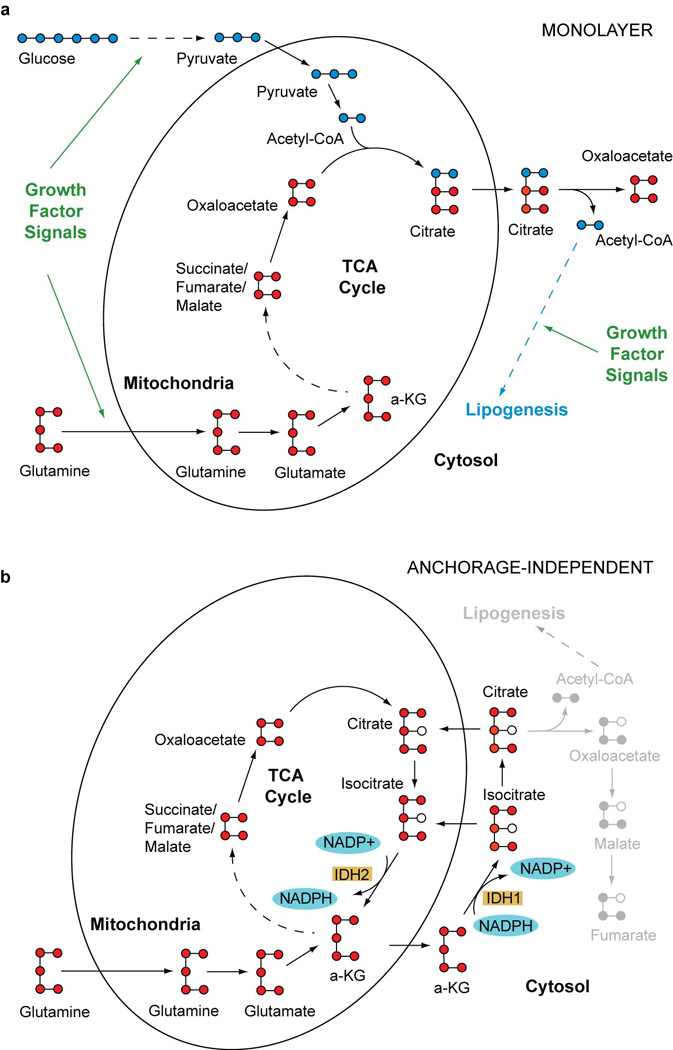
a, Predominant path of citrate formation in monolayer culture. b, Proposed pathway in anchorage-independent culture, emphasizing an alternative route of isocitrate/citrate metabolism and reducing equivalent flow.
Extended Data Figure 2. Nutrient metabolism in H460 spheroid culture.
a, Cell proliferation and doubling times of H460 cells cultured under monolayer and spheroid conditions (n=4 cultures days 1–4; n=3 cultures days 5–6). b, Effect of glucose or glutamine deprivation on cell counts in monolayer and spheroid culture (n=4 cultures from a representative experiment). c, Rates of glucose consumption and lactate excretion in monolayer and spheroid culture (n=4 cultures from two experiments). d, Rates of glutamine consumption; glutamate and ammonia excretion; ratio of ammonia excretion to glutamine consumption; and rate of excretion of 15NH4+ originating from [γ-15N]glutamine in monolayer and spheroid culture (n=3 cultures from a representative experiment). e, Citrate mass isotoplogue analysis in H460 cells in monolayer culture, aggregated into spheroids (P1), or disaggregated from spheroids then permitted to re-aggregate (P2) (n=2 cultures from a representative experiment). f, Right, protein levels of phosphorylated PDHα (pPDH, Ser293), total PDHα (tPDH) and PDK1 in monolayer and spheroid culture with or without 2mM dichloroacetate (DCA). Left, citrate mass isotopologue analysis in H460 spheroids cultured with [U-13C]glucose or [U-13C]glutamine, and treated with 2mM DCA (n=3 cultures from a representative experiment). *p<0.05, Welch's unequal variances t-test (a, c, d and f), or Welch's unequal variances t-test, followed by multiple-comparison correction (b). All experiments were repeated 3 times or more.
Extended Data Figure 3. Reductive citrate metabolism in anchorage-independent spheroid culture.
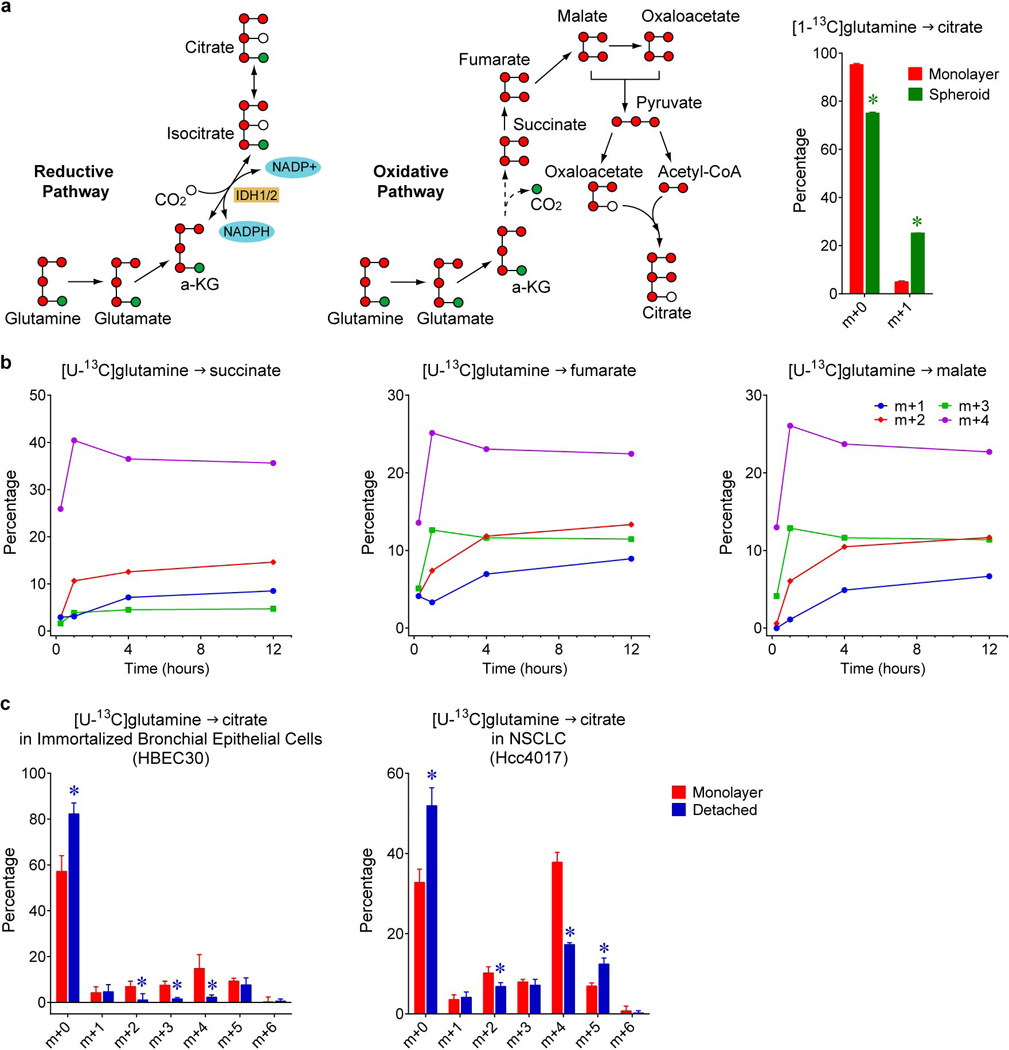
a, Citrate m+5 may be generated in several ways from [U-13C]glutamine, including through reductive (left) or oxidative (middle) pathways. To test whether citrate m+5 arises from oxidative or reductive metabolism, spheroids were cultured with [1-13C]glutamine. Glutamine-C1 (green circle) is released as CO2 by α-ketoglutarate dehydrogenase in the oxidative TCA cycle, but is transferred to citrate via reductive metabolism. Citrate mass isotopologues in H460 cells cultured with [1-13C]glutamine (right). The m+1 fraction in this experiment is comparable to the m+5 fraction from [U-13C]glutamine (~20%), indicating that reductive labeling was enhanced in spheroids (n=3 cultures from a representative experiment). b, Time-dependent evolution of succinate, fumarate and malate mass isotopologues in spheroids cultured with [U-13C]glutamine (n=2 cultures for each time point). c, Citrate labeling from [U-13C]glutamine in immortalized, non-transformed bronchial epithelial cells (HBEC30) and lung cancer cells (HCC4017) from the same patient (n=3 cultures from two experiments). *p<0.05, Welch's unequal variances t-test. All experiments were repeated 3 times or more.
Extended Data Figure 4. Effect of oxygen availability, nutrient availability and anchorage on reductive carboxylation.
a, Mass isotopologues of citrate in spheroids cultured with [U-13C]glutamine under 20% and 60% oxygen (n=4 cultures from two experiments). b, Effects of reducing extracellular glucose and glutamine concentrations on citrate mass isotopologues in monolayer cells cultured with [U-13C]glutamine (n=2 cultures from a representative experiment). c, Day 7 spheroids were allowed to attach to a conventional tissue culture dish for 24h, and mass isotopologues of citrate were analyzed with [U-13C]glutamine tracing (n=4 cultures from two experiments). Insets are photomicrographs of cells in each of the culture conditions. Scale bars, 200 µm. *p<0.05 comparing to monolayer, #p<0.05 comparing to spheroid, Welch's unequal variances t-test followed by multiple-comparison correction. All experiments were repeated 3 times or more.
Extended Data Figure 5. Hypoxia and anchorage independence elicit different effects on citrate metabolism.
a, Mass isotopologues of citrate and malate in H460 cells cultured with [U-13C]glutamine, in monolayer or spheroid conditions, under 21% or 1% oxygen (n=4 cultures from two experiments). Contribution of glutamine (b), glucose (c) and acetate (d) to the lipogenic acetyl-CoA pool used for palmitate synthesis, during 24h of culture with each tracer (n=3 cultures in panels b and c; n=2 cultures in panel d from a representative experiment). *p<0.05, Welch's unequal variances t-test followed by multiple-comparison correction (a), or ANOVA (b), or Welch's unequal variances t-test (c). The experiment in d was repeated twice, and all other experiments were repeated 3 times or more.
Extended Data Figure 6. Graphical view of metabolic flux analysis (MFA).
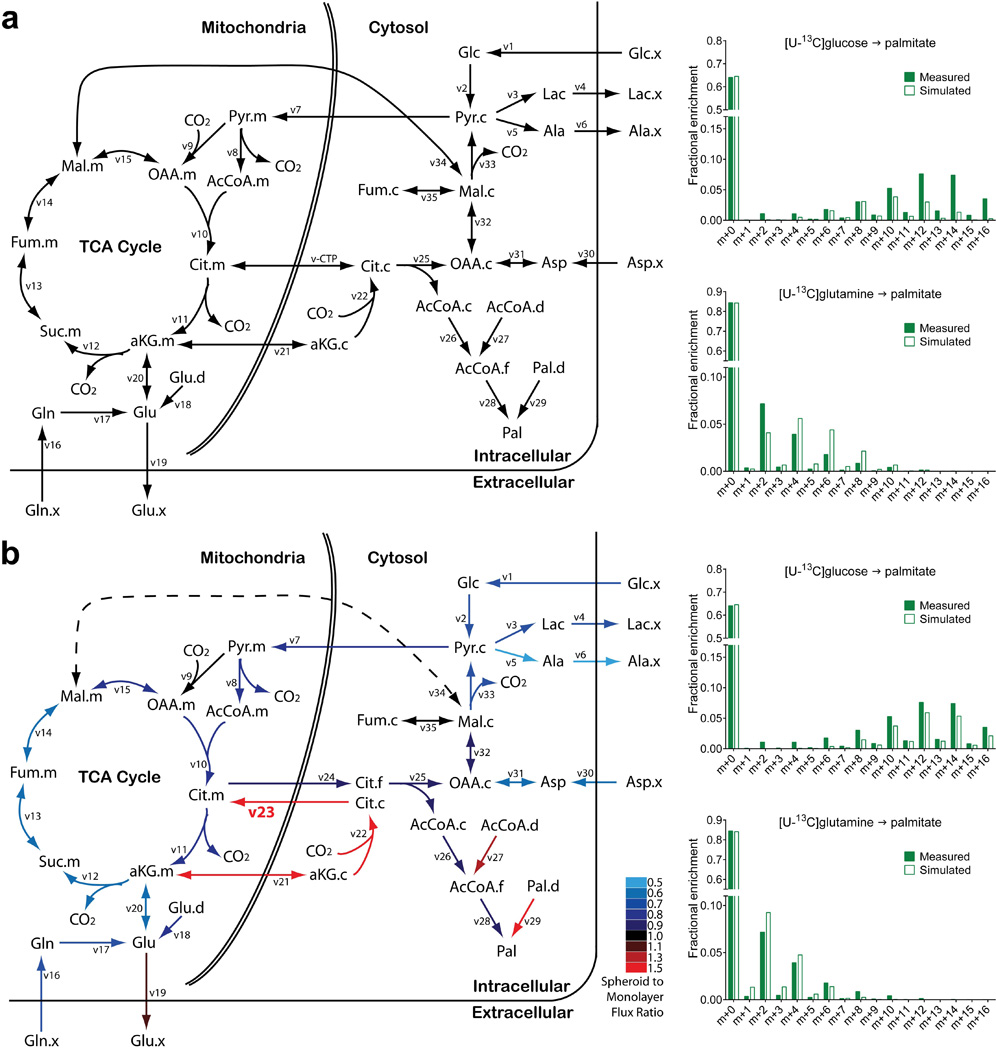
a, A conventional set of metabolic reactions and compartmentation produced an inadequate fit with the experimental data, with an unacceptable sum-of-squared residuals (SSR=336). Poorly fit palmitate isotopologues from [U-13C]glucose and [U-13C]glutamine are shown on the right. v-CTP, bidirectional isocitrate/citrate trafficking flux. b, In the modified metabolic network, isocitrate/citrate produced from cytosolic reductive carboxylation enters the mitochondria and mixes with the isocitrate/citrate pool there. Adding this new reaction to the model (indicated in bold as v23) substantially improved the overall fit (SSR=179) and the fit with palmitate isotopologues (right). Color coding in b reflects flux changes in spheroids, expressed as the ratio of spheroid flux/monolayer flux. The dashed line indicates that the overall direction of malate transport was predicted to reverse from mitochondrial efflux in monolayer cells to mitochondrial import in spheroids. Flux terms are defined in Supplementary Table 2, and abbreviations and quantitative flux rates are in Extended Data Table 1.
Extended Data Figure 7. IDH1 inhibition suppresses reductive carboxylation in spheroids.
a, Abundance of citrate in vector control, wild-type, and IDH1, IDH2 or IDH3-deficient spheroids (n=2 cultures from a representative experiment). b, Structure of IDH1 inhibitor compound GSK321 and structurally similar control compound GSK990. Compound GSK321 was initially identified as a potent inhibitor against an oncogenic allele of IDH1 containing the R132H mutation. Subsequent analysis revealed that at higher doses, the compound also inhibits wild-type IDH1. c, In vitro activity assay revealing effects of compound 321 on enzymatic activity of recombinant wild-type IDH1 and IDH2 (n=4 repeats from a representative experiment). d, Time-dependent evolution of citrate mass isotopologues in 990- or 321-treated spheroids cultured with [U-13C]glutamine (n=1 culture for each time point). e, Mass isotopologues of citrate in vector control and IDH1KO spheroids cultured with [U-13C]glutamine and treated with 5µM IDH1 inhibitor (321) or control compound (990) (n=4 cultures from two experiments). *p<0.05, ANOVA. Experiments in d were repeated twice, and experiments in c and e were repeated 3 times or more.
Extended Data Figure 8. Mitochondria take up and metabolize citrate.
a, Protein expression of mitochondrial and cytosolic markers in subcellular fractions of monolayer and spheroid culture. b, Protein expression of CTP in control and CTP-deficient H460 cells. c, Mass isotopologues of malate and succinate in isolated mitochondria cultured with [U-13C]citrate (n=4 cultures from two experiments). d, Mass isotopologues of malate and succinate in isolated mitochondria cultured with [U-13C]citrate, unlabeled pyruvate and glutamine (n=4 cultures from two experiments). e, Mass isotopologues of fumarate, malate and succinate in isolated mitochondria cultured with [U-13C]glutamine and unlabeled pyruvate (n=2 cultures from a representative experiment). *p<0.05, Welch's unequal variances t-test. Experiments in e were repeated twice, and all other experiments were repeated 3 times or more.
Extended Data Figure 9. Reductive glutamine metabolism mitigates mitochondrial ROS and promotes spheroid growth.
Mitochondrial (a) and cytosolic (b) ROS detected by a genetic hydrogen peroxide sensor in H460 spheroids containing or lacking IDH1 or IDH2. (n=29 Vector spheroids; n=26 IDH1-KO and IDH2-KO spheroids in panel a; n=23 Vector spheroids; n=22 IDH1-KO spheroids in panel b). c, Deuterium labeling of citrate in H460 spheroids without and with the pentose phosphate pathway inhibitor DHEA (n=3 cultures from a representative experiment). d, Growth of H460 cells containing or lacking CTP in monolayer conditions (left) and as spheroids (right) (n=6 monolayer cultures; n=31 CTP-WT spheroids; n=42 CTP-KO spheroids). e, Size of H460 spheroids containing or lacking IDH1 or IDH2, and treated with or without the mitochondrial ROS scavenger MitoTEMPO. (n=40 Vector “−” spheroids; n=52 Vector “+” spheroids; n=46 IDH1KO “−“ and “+” spheroids; n=48 IDH2KO “−” spheroids; n=52 IDH2KO “+” spheroids). *p<0.05, ANOVA (a), or Welch's unequal variances t-test (b–e). All experiments were repeated 3 times or more.
Extended Data Table 1. Simulated metabolic fluxes in monolayer and spheroid culture.
Fluxes were determined using the network illustrated in Extended Data Fig. 6b. Negative flux values indicate that the net direction is reverse to the direction indicated in Supplementary Table 2. The sum of squared residuals was 168.8 for monolayer and 179 for spheroid, both within the acceptable range (117.1 – 184.7). Degrees of freedom = 149. Units for all fluxes are nmol/hour/mg protein.
| Net Flux | Monolayer | Spheroid | |||
|---|---|---|---|---|---|
| Reaction | Value | 95% C.I. | Value | 95% C.I. | |
| v1 | Glc Uptake | 1.0583 | [1.0408,1.0759] | 0.7453 | [0.7281,.07626] |
| v2 | Glycolysis | 1.0583 | [1.0408,1.0759] | 0.7453 | [0.7281,.07626] |
| v3 | LDH | 1.8558 | [1.8366,1.8749] | 1.2458 | [1.2268,1.2649] |
| v4 | Lac Secretion | 1.8558 | [1.8366,1.8749] | 1.2458 | [1.2268,1.2649] |
| v5 | GPT | 0.0896 | [0.0857,0.0935] | 0.0475 | [0.0436.0.0514] |
| v6 | Ala Secretion | 0.0896 | [0.0857,0.0935] | 0.0475 | [0.0436.0.0514] |
| v7 | MPC | 0.5763 | [0.5361,0.6176] | 0.4731 | [0.4336,0.5130] |
| v8 | PDH | 0.5236 | [0.4844,0.5639] | 0.4200 | [0.3813,0.4587] |
| v9 | PC | 0.0527 | [0.0452,0.0603] | 0.0532 | [0.0473,0.0592] |
| v10 | CS | 0.5236 | [0.4844,0.5639] | 0.4200 | [0.3813,0.4587] |
| v11 | IDH.m | 0.2510 | [0.2371,0.2655] | 0.2004 | [0.1879,0.2146] |
| v12 | OGDH | 0.4824 | [0.4611,0.5041] | 0.2977 | [0.2826,0.3118] |
| v13 | SDH | 0.4824 | [0.4611,0.5041] | 0.2977 | [0.2826,0.3118] |
| v14 | FH.m | 0.4824 | [0.4611,0.5041] | 0.2977 | [0.2826,0.3118] |
| v15 | MDH.m | 0.4709 | [0.4312,0.5115] | 0.3668 | [0.3280,0.4052] |
| v16 | Gln Uptake | 0.2615 | [0.2537,0.2692] | 0.1731 | [0.1692,0.1770] |
| v17 | GLS | 0.2615 | [0.2537,0.2692] | 0.1731 | [0.1692,0,1770] |
| v18 | Glu Dilution | 0.0722 | [0.0632,0.0814] | 0.0592 | [0.0540,0.0644] |
| v19 | Glu Secretion | 0.0393 | [0.0354,0.0432] | 0.0423 | [0.0384,0.0462] |
| v20 | GDH | 0.2943 | [0.2808,0.3081] | 0.1900 | [0.1819,0.1982] |
| v21 | aKG Transporter | 0.0629 | [0.0547,0.0715] | 0.0926 | [0.0848,0.1068] |
| v22 | IDH.c | 0.0629 | [0.0547,0.0715] | 0.0926 | [0.0848,0.1068] |
| v23 | CTP Influx | 0.0629 | [0.0547,0.0715] | 0.0926 | [0.0848,0.1068] |
| v24 | CTP Efflux | 0.3355 | [0.2929,0.3790] | 0.3122 | [0.2699,0.3546] |
| v25 | ACLY | 0.3355 | [0.2929,0.3790] | 0.3122 | [0.2699,0.3546] |
| v26 | AcCoA Tracer | 0.3355 | [0.2929,0.3790] | 0.3122 | [0.2699,0.3546] |
| v27 | AcCoA Dilution | 0.0121 | [0.0021,0.0234] | 0.0159 | [0.0000,0.0371] |
| v28 | FASN | 0.0434 | [0.0377,0.0493] | 0.0410 | [0.0348,0.0475] |
| v29 | Pal Dilution | 0.0638 | [0.0542,0.0746] | 0.1161 | [0.0968,0.1396] |
| v30 | Asp Uptake | 0.0581 | [0.0469,0.0706] | 0.0326 | [0.0265,0.0415] |
| v31 | AST.c | 0.0581 | [0.0469,0.0706] | 0.0326 | [0.0265,0.0415] |
| v32 | MDH.c | 0.3936 | [0.3501,0.4385] | 0.3448 | [0.3012,0.3993] |
| v33 | ME.c | 0.4051 | [0.3882,0.4226] | 0.2758 | [0.2644,0.2883] |
| v34 | Mal Transporter | −0.0115 | [−0.0538,0.0322] | 0.0690 | [0.0271,0.1109] |
| v35 | FH.c | 0.0000 | [0.0000,0.0000] | 0.0000 | [0.0000,0.0000] |
| Exchanging | Monolayer | Spheroid | |||
| Reaction | Value | 95% C.I. | Value | 95% C.I. | |
| v13.e | SDH | 17.7187 | [0.0000,inf] | 4.4558 | [0.0000,inf] |
| v14.e | FH.m | 15841 | [0.0000,inf] | 15020 | [1.2075,inf] |
| v15.e | MDH.m | 0.8754 | [0.1993,6.9294] | 76030 | [1.2040,inf] |
| v20.e | GDH | 1.6515 | [1.2667,2.2882] | 1.3421 | [1.0074,inf] |
| v21.e | aKG Transporter | 5.0559 | [0.0000,inf] | 12.8126 | [0.0000,inf] |
| v31.e | AST.c | 0.5063 | [0.2754,1.7111] | 0.1392 | [0.1009,0.2211] |
| v32.e | MDH.c | 0.9824 | [0.1811,inf] | 0.0000 | [0.0000,inf] |
| v34.e | Mal Transporter | 0.7175 | [0.3974,1.3969] | 0.0000 | [0.0000,0.0621] |
| v35.e | FH.c | 28139 | [0.9790,inf] | 102230 | [3.4108,inf] |
| Mixing | Monolayer | Spheroid | |||
| Reaction | Value | 95% C.I. | Value | 95% C.I. | |
| v36 | Cit.cyto | 0.0000 | [0.0000,0.0080] | 0.4688 | [0.4355,0.4981] |
| v37 | Cit.mito | 1.0000 | [0.9920,1.0000] | 0.5312 | [0.5019,0.5645] |
| v38 | Cit.mix | 1.0000 | [1.0000,1.0000] | 1.0000 | [1.0000,1.0000] |
| v39 | Mal.cyto | 1.0000 | [0.7622,1.0000] | 1.0000 | [0.8410,1.0000] |
| v40 | Mal.mito | 0.0000 | [0.0000,0.2378] | 0.0000 | [0.0000,0.1590] |
| v41 | Mal.mix | 1.0000 | [1.0000,1.0000] | 1.0000 | [1.0000,1.0000] |
| v42 | Fum.cyto | 0.9902 | [0.6662,1.0000] | 0.9918 | [0.8278,1.0000] |
| v43 | Fum.mito | 0.0098 | [0.0000,0.3338] | 0.0082 | [0.0000,0.1722] |
| v44 | Fum.mix | 1.0000 | [1.0000,1.0000] | 1.0000 | [1.0000,1.0000] |
Abbreviations:
Metabolites: AcCoA, acetyl-CoA; aKG, a-ketoglutarate; Ala, alanine; Asp, aspartate; Cit, citrate; Fum, fumarate; Glc, glucose; Gln, glutamine; Glu, glutamate; Lac, lactate; Mal, malate; Pal, palmitate. c, cytosolic; m, mitochondrial. C.I., Confidence Interval.
Enzymes and transporters: LDH, lactate dehydrogenase; GPT, glutamate pyruvate transaminase; MPC, mitochondrial pyruvate carrier; PDH, pyruvate dehydrogenase; PC, pyruvate carboxylase; CS, citrate synthase; IDH, isocitrate dehydrogenase; OGDH, a-ketoglutarate dehydrogenase; SDH, succinate dehydrogenase; FH, fumarase; MDH, malate dehydrogenase; GLS, glutaminase; GDH, glutamate dehydrogenase; CTP, citrate transporter protein; ACLY, ATP citrate lyase; FASN, fatty acid synthase; AST, aspartate aminotransferase; ME, malic enzyme.
Supplementary Material
Acknowledgments
We thank Matthew Mitsche for help with analysis of lipogenic acetyl-CoA enrichment, Alexandra Grassian for advice about IDH1, Joseph Garcia for hypoxia/hyperoxia experiments and Christian Frezza for discussion of mitochondrial isolation. Julia Kozlitina assisted with statistical analysis and Robert Egnatchik provided advice about metabolic flux analysis. R.J.D. is supported by grants from the N.I.H (R01CA157996), Cancer Prevention and Research Institute of Texas (RP130272) and Robert A. Welch Foundation (I1733). C.M.M. is supported by N.I.H. grant R01CA188652.
R.J.D. is on the advisory boards of Peloton Therapeutics and Agios Pharmaceuticals.
Footnotes
Supplementary Information is linked to the online version of the paper at www.nature.com/nature.
Author Contributions. L.J. and R.J.D. designed the study. L.J., Q.A.W. and C.Y. performed molecular and cell biology experiments. P.S. and B.P.D. performed Seahorse experiments. L.S.T., S.J.P. and C.M.M. provided reagents and expertise for ROS. and 2H tracing experiments. L.J. and A.A.S. performed metabolic flux analysis. N.D.A., M.T.M., B.P., S.S. and B.S. provided the IDH1 inhibitor. L.J. and R.J.D. wrote the paper.
References
- 1.Bhowmick NA, Neilson EG, Moses HL. Stromal fibroblasts in cancer initiation and progression. Nature. 2004;432:332–337. doi: 10.1038/nature03096. [DOI] [PMC free article] [PubMed] [Google Scholar]
- 2.Schafer ZT, et al. Antioxidant and oncogene rescue of metabolic defects caused by loss of matrix attachment. Nature. 2009;461:109–113. doi: 10.1038/nature08268. [DOI] [PMC free article] [PubMed] [Google Scholar]
- 3.Grassian AR, Metallo CM, Coloff JL, Stephanopoulos G, Brugge JS. Erk regulation of pyruvate dehydrogenase flux through PDK4 modulates cell proliferation. Genes & development. 2011;25:1716–1733. doi: 10.1101/gad.16771811. [DOI] [PMC free article] [PubMed] [Google Scholar]
- 4.Rajagopalan KN, et al. Metabolic plasticity maintains proliferation in pyruvate dehydrogenase deficient cells. Cancer & metabolism. 2015;3:7. doi: 10.1186/s40170-015-0134-4. [DOI] [PMC free article] [PubMed] [Google Scholar]
- 5.Kim HS, et al. Systematic identification of molecular subtype-selective vulnerabilities in non-small-cell lung cancer. Cell. 2013;155:552–566. doi: 10.1016/j.cell.2013.09.041. [DOI] [PMC free article] [PubMed] [Google Scholar]
- 6.Metallo CM, et al. Reductive glutamine metabolism by IDH1 mediates lipogenesis under hypoxia. Nature. 2012;481:380–384. doi: 10.1038/nature10602. [DOI] [PMC free article] [PubMed] [Google Scholar]
- 7.Friedrich J, Seidel C, Ebner R, Kunz-Schughart LA. Spheroid-based drug screen: considerations and practical approach. Nature protocols. 2009;4:309–324. doi: 10.1038/nprot.2008.226. [DOI] [PubMed] [Google Scholar]
- 8.Hunnewell MG, Forbes NS. Active and inactive metabolic pathways in tumor spheroids: determination by GC-MS. Biotechnology progress. 2010;26:789–796. doi: 10.1002/btpr.360. [DOI] [PMC free article] [PubMed] [Google Scholar]
- 9.Schug ZT, et al. Acetyl-CoA synthetase 2 promotes acetate utilization and maintains cancer cell growth under metabolic stress. Cancer cell. 2015;27:57–71. doi: 10.1016/j.ccell.2014.12.002. [DOI] [PMC free article] [PubMed] [Google Scholar]
- 10.Mullen AR, et al. Reductive carboxylation supports growth in tumour cells with defective mitochondria. Nature. 2012;481:385–388. doi: 10.1038/nature10642. [DOI] [PMC free article] [PubMed] [Google Scholar]
- 11.Garrett RH, Grisham CM. Biochemistry. Belmont: Brooks Cole; 2004. p. 618. [Google Scholar]
- 12.Okoye-Okafor UC, et al. New IDH1 mutant inhibitors for treatment of acute myeloid leukemia. Nature chemical biology. 2015;11:878–886. doi: 10.1038/nchembio.1930. [DOI] [PMC free article] [PubMed] [Google Scholar]
- 13.Gnoni GV, Priore P, Geelen MJ, Siculella L. The mitochondrial citrate carrier: metabolic role and regulation of its activity and expression. IUBMB life. 2009;61:987–994. doi: 10.1002/iub.249. [DOI] [PubMed] [Google Scholar]
- 14.Kaplan RS, Morris HP, Coleman PS. Kinetic characteristics of citrate influx and efflux with mitochondria from Morris hepatomas 3924A and 16. Cancer research. 1982;42:4399–4407. [PubMed] [Google Scholar]
- 15.Belousov VV, et al. Genetically encoded fluorescent indicator for intracellular hydrogen peroxide. Nature methods. 2006;3:281–286. doi: 10.1038/nmeth866. [DOI] [PubMed] [Google Scholar]
- 16.Lewis CA, et al. Tracing compartmentalized NADPH metabolism in the cytosol and mitochondria of mammalian cells. Molecular cell. 2014;55:253–263. doi: 10.1016/j.molcel.2014.05.008. [DOI] [PMC free article] [PubMed] [Google Scholar]
- 17.Anastasiou D, et al. Inhibition of pyruvate kinase M2 by reactive oxygen species contributes to cellular antioxidant responses. Science. 2011;334:1278–1283. doi: 10.1126/science.1211485. [DOI] [PMC free article] [PubMed] [Google Scholar]
- 18.Piskounova E, et al. Oxidative stress inhibits distant metastasis by human melanoma cells. Nature. 2015;527:186–191. doi: 10.1038/nature15726. [DOI] [PMC free article] [PubMed] [Google Scholar]
- 19.Sazanov LA, Jackson JB. Proton-translocating transhydrogenase and NAD- and NADP-linked isocitrate dehydrogenases operate in a substrate cycle which contributes to fine regulation of the tricarboxylic acid cycle activity in mitochondria. FEBS letters. 1994;344:109–116. doi: 10.1016/0014-5793(94)00370-x. [DOI] [PubMed] [Google Scholar]
References
- 20.Ran FA, et al. Genome engineering using the CRISPR-Cas9 system. Nature protocols. 2013;8:2281–2308. doi: 10.1038/nprot.2013.143. [DOI] [PMC free article] [PubMed] [Google Scholar]
- 21.Yang C, et al. Glutamine oxidation maintains the TCA cycle and cell survival during impaired mitochondrial pyruvate transport. Molecular cell. 2014;56:414–424. doi: 10.1016/j.molcel.2014.09.025. [DOI] [PMC free article] [PubMed] [Google Scholar]
- 22.Cheng T, et al. Pyruvate carboxylase is required for glutamine-independent growth of tumor cells. Proceedings of the National Academy of Sciences of the United States of America. 2011;108:8674–8679. doi: 10.1073/pnas.1016627108. [DOI] [PMC free article] [PubMed] [Google Scholar]
- 23.Young JD. INCA: a computational platform for isotopically non-stationary metabolic flux analysis. Bioinformatics. 2014;30:1333–1335. doi: 10.1093/bioinformatics/btu015. [DOI] [PMC free article] [PubMed] [Google Scholar]
- 24.Antoniewicz MR, Kelleher JK, Stephanopoulos G. Elementary metabolite units (EMU): a novel framework for modeling isotopic distributions. Metabolic engineering. 2007;9:68–86. doi: 10.1016/j.ymben.2006.09.001. [DOI] [PMC free article] [PubMed] [Google Scholar]
- 25.Young JD, Walther JL, Antoniewicz MR, Yoo H, Stephanopoulos G. An elementary metabolite unit (EMU) based method of isotopically nonstationary flux analysis. Biotechnology and bioengineering. 2008;99:686–699. doi: 10.1002/bit.21632. [DOI] [PubMed] [Google Scholar]
- 26.Waleh NS, et al. Mapping of the vascular endothelial growth factor-producing hypoxic cells in multicellular tumor spheroids using a hypoxia-specific marker. Cancer research. 1995;55:6222–6226. [PubMed] [Google Scholar]
- 27.Wu RF, Ma Z, Liu Z, Terada LS. Nox4-derived H2O2 mediates endoplasmic reticulum signaling through local Ras activation. Molecular and cellular biology. 2010;30:3553–3568. doi: 10.1128/MCB.01445-09. [DOI] [PMC free article] [PubMed] [Google Scholar]
- 28.Pietrak B, et al. A tale of two subunits: how the neomorphic R132H IDH1 mutation enhances production of alphaHG. Biochemistry. 2011;50:4804–4812. doi: 10.1021/bi200499m. [DOI] [PubMed] [Google Scholar]
- 29.Rendina AR, et al. Mutant IDH1 enhances the production of 2-hydroxyglutarate due to its kinetic mechanism. Biochemistry. 2013;52:4563–4577. doi: 10.1021/bi400514k. [DOI] [PubMed] [Google Scholar]
Associated Data
This section collects any data citations, data availability statements, or supplementary materials included in this article.


