Abstract
Background
There is a strong relationship between circadian rhythms and ethanol responses. Ethanol consumption has been shown to disrupt physiological and behavioral circadian rhythms in mammals (Spanagel et al., 2005b). The Drosophila central circadian pacemaker is composed of proteins encoded by the per, tim, cyc, and Clk genes. Using Drosophila mutant analysis we asked whether these central components of the circadian clock make the equivalent contribution towards ethanol tolerance and whether rhythmicity itself is necessary for tolerance.
Methods
We tested flies carrying mutations in core clock genes for the capacity to acquire ethanol tolerance. Tolerance was assayed by comparing the sedation curves of populations during their first and second sedation. Animals that had acquired tolerance sedated more slowly. Movement was also monitored as the flies breathe the ethanol vapor to determine if other facets of the ethanol response were affected by the mutations. Gas chromatography was used to measure internal ethanol concentration. Constant light was used to non-genetically destabilize the PER and TIM proteins.
Results
A group of circadian mutations, all of which eliminate circadian rhythms, do not disrupt tolerance identically. Mutations in per, tim, and cyc completely block tolerance. However, a mutation in Clk does not interfere with tolerance. Constant light also disrupts the capacity to acquire tolerance. These lines did not differ in ethanol absorption.
Conclusions
Mutations affecting different parts of the intracellular circadian clock can block the capacity to acquire rapid ethanol tolerance. However, the role of circadian genes in ethanol tolerance is independent of their role in producing circadian rhythmicity. The interference in the capacity to acquire ethanol tolerance by some circadian mutations is not merely a downstream effect of a nonfunctional circadian clock, instead these circadian genes play an independent role in ethanol tolerance.
Keywords: Alcohol tolerance, circadian rhythm, mutation, Drosophila
Introduction
Alcoholism is a devastating disease worldwide. While environmental and societal factors play a role in succumbing to this disease, a large body of evidence indicates that alcoholism has a heritable component (Prescott and Kendler, 1999). While this disease is too complex to model completely in animal systems, the endophenotypes of alcoholism can be defined and studied. One such endophenotype is tolerance: a decrease in the effect of a drug caused by previous drug exposure. Tolerance is an important endophenotype because the reduced response can trigger increased alcohol consumption in order to reach the desired effect, thereby speeding the user down the path to addiction.
The fruit fly Drosophila melanogaster has proven to be a useful tool for identifying the genetic components underlying ethanol tolerance (Atkinson, 2009). Diverse genes have been shown to affect tolerance in the fly, including genes involved in neurotransmitter synthesis (Scholz et al., 2000), synaptic structure (Urizar et al., 2007), and ion channel activity (Cowmeadow et al., 2005). Many of these genes have been shown to have similar effects in mammals, demonstrating that the genes involved in this process are conserved from the fly to higher organisms.
The circadian clock, present in most animals (van Oort et al., 2005), allows the organism to anticipate circadian changes in the environment and maintain a circadian rhythm even in the absence of environmental cues. Circumstantial evidence indicates that the circadian clock also has a role in generating some endophenotypes of alcoholism. Sensitivity to ethanol in humans is affected by the time of day that ethanol is ingested (reviewed in Danel and Touitou, 2004) and similar time-of-day effects have been seen in rodents and flies (Perreau-Lenz et al., 2009a; van der Linde and Lyons, 2011). Furthermore, ethanol has been shown to affect the circadian clock in rat behavioral assays where chronic alcohol intake can disrupt the circadian period (Rosenwasser et al., 2005; Seggio et al., 2009) and in slices of the mouse central pacemaker where a single dose of ethanol changes the firing pattern of the circadian pacemaker (Prosser et al., 2008; McElroy et al., 2009). It is well known that ethanol has a disruptive effect on the circadian sleep/wake cycle in humans (Brower, 2001) and estimates of the number of alcoholics who are also insomniacs range from 36–72% (Brower, 2001). In addition, it has recently been shown that raising Drosophila on high-ethanol food shortens the period of circadian rhythms in the adult (Seggio et al., 2012). Nevertheless, it is still not clear whether alcohol responses are dependent on a running clock or on some other activity of a circadian regulatory protein.
In Drosophila, the genes that regulate the clock are well characterized, and most have homologous mammalian counterparts. The central component of the intracellular circadian clock is comprised of the PER, TIM, CYC, and CLK proteins. A dimer of CYC and CLK regulates transcription of PER and TIM. In turn, PER and TIM form a dimer that regulates the stability of the CYC and CLK dimer. This interaction results in a diurnal cycle of about 24 hours in levels of these proteins (reviewed in detail in Allada and Chung, 2010; and Hardin, 2005), thereby establishing the periodicity of the circadian clock in the fly. By regulating the expression of other genes, the transcription factors of the central clock can produce widespread circadian fluctuations in physiology and behavior (Taghert and Shafer, 2006).
In this paper, we ask whether mutations in core circadian genes disrupt the capacity to acquire ethanol tolerance, and if so, whether the disruption is a consequence of the mere absence of a cycling circadian clock. Specifically, we tested the per01, tim01, and cyc01 and ClkJRK mutants. We find that despite the fact that all of the mutations ablate circadian rhythmicity, only some of them affect ethanol tolerance. These results indicate that these circadian genes have a role in producing tolerance that is independent of their role in producing circadian rhythmicity.
Results
Circadian mutants do not alter ethanol sensitivity
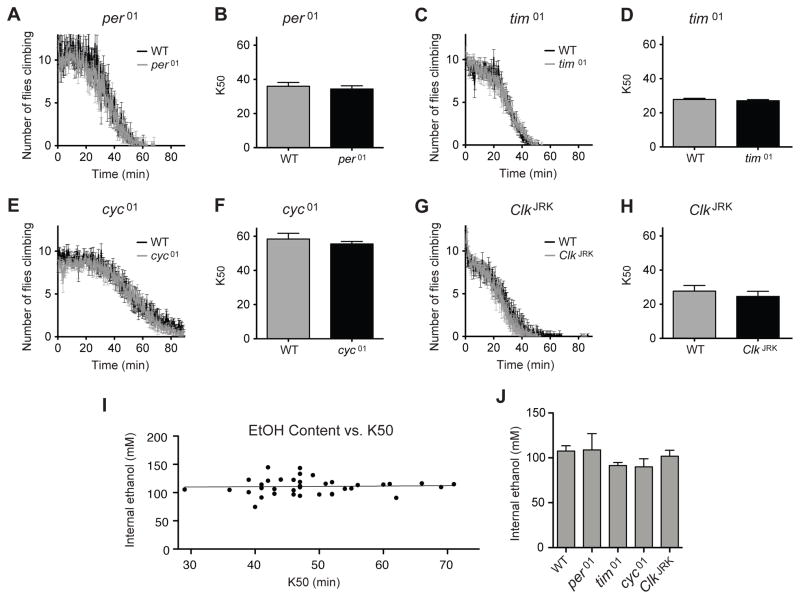
The mutant alleles, per01, tim01 and cyc01, and ClkJRK produce circadian arrhythmicity by disrupting the cycling of the intracellular circadian clock (Hardin, 2005). Before determining if these genes alter ethanol endophenotypes we back-crossed them to the wild-type strain for six generations to eliminate differences due to genetic background. The ethanol sensitivity of each of these mutants was compared to the wild type by monitoring the time to ethanol sedation in response to the vapor from a 35% ethanol solution. Groups of mutant and wild-type flies were placed in plastic vials sealed with a plug containing a 35% ethanol solution. Because flies normally climb the walls of a vial, we can easily measure sedation by counting the number of flies that fall from the walls of the vial. We used a computer camera system to monitor the sedation profile of the flies in response to ethanol vapor. For each vial, we determined the time required for sedation of 50% of the population (K50). The plots in Figures 1A–1H show overlapping sedation (sensitivity) curves for the circadian mutants and the wild type (Figure 1A–1H).
Figure 1. Circadian mutants do not affect sensitivity to ethanol.
Knockdown curves are used to compare the ethanol sensitivity of the wild type and the various backcrossed circadian mutant alleles. In each plot, the sensitivity of the wild-type Canton S line is compared with a circadian mutant that has been backcrossed into the wild-type background. Shown are A) per01, C) tim01, E) cyc01, and G) ClkJRK. Bar graphs compare the time required for 50% to be knocked down (K50) by the ethanol vapor from a 35% ethanol solution for B) per01, D) tim01, F) cyc01, and H) ClkJRK. None of the comparisons were significantly different. Statistical significance was determined using Student's t test with a cutoff of p<0.05. n=4 vials for per01 test, n=6 vials for all others. Each vial contains 10 animals. I) The K50 occurs at a specific internal ethanol concentration. Thirty-nine ethanol sedations (10 flies per sedation) were performed on different days or with different ethanol concentrations (35% or 40% ethanol was used). This produced wide variation in the K50 value (29 minutes to 71 minutes). When half of the flies were sedated (K50) the flies were sacrificed and the internal ethanol concentration measured (111 mM +/−2.3, N=39). The slope of the best fit line does not differ significantly from zero (r2<0.002, P>0.8). J) The CS (wild type) and mutant per01, tim01, cyc01, and ClkJRK stocks do not differ from one another in their internal ethanol hemolymph concentration after vapor treatment. Internal ethanol content was determined by gas chromatography after 30 minutes of exposure to the vapor from a 35% ethanol solution. Ethanol treatment is identical to panes A–H except that all stocks were treated at the same time. The lack of statistical significance was determined using one way Anova with the Dunnett's Multiple Comparison Test. Error bars are standard error of the mean, n= 6 vials. Each vial contains 10 animals.
When collecting the rate of sedation data for the mutants and the wild type it became clear that there was substantial day-to-day variation in the absolute rate of sedation. Each experiment in Figure 1 was performed on a different day. Notice that the sedation curves for the wild-type Canton S strain vary from day to day. This means either that the animals respond to ethanol differently each day or that there are small day-to-day changes in the rate of ethanol volatilization. To evaluate the cause of the variation we asked whether the K50 of sedation occurred at a specific internal ethanol concentration. If so, then this would indicate that the animals did not have different ethanol sensitivity on different days but that the rate of ethanol delivery (volatilization) must vary due to factors that we could not control. To determine whether the K50 reflects a true biological endpoint we sedated wild type flies on different days. When the half of the flies in a vial were sedated (K50) we collected the animals and measured their ethanol content. We observed that at K50, the internal concentration was 111 mM +/−2.3 even though the K50 ranged from 29 to 71 minutes (n=39; Figure 1K). This concentration of ethanol is not a ceiling effect because longer exposure to 35% ethanol producing 100% knockdown can produce 171 mM internal ethanol, and previously using 100% ethanol (and a bubbler) we achieved 235–280 mM without lethality (Cowmeadow et al., 2005). Thus, the K50 reflects a biological endpoint that occurred when the internal ethanol concentration reached a specific value and furthermore that the K50 could be used as an easy way to evaluate the sensitivity and tolerance of a line. In addition, we demonstrated that the wild type and mutant lines do not differ in internal ethanol concentration after a 30 minute treatment with vapor from a 35% ethanol solution (Figure 1J) or a 75% ethanol solution (not shown). To avoid confusion arising from day-to-day variability, throughout this paper data that is plotted in the same panel has been collected from experiments conducted at the same time.
Tolerance to ethanol sedation is eliminated in only some circadian mutants
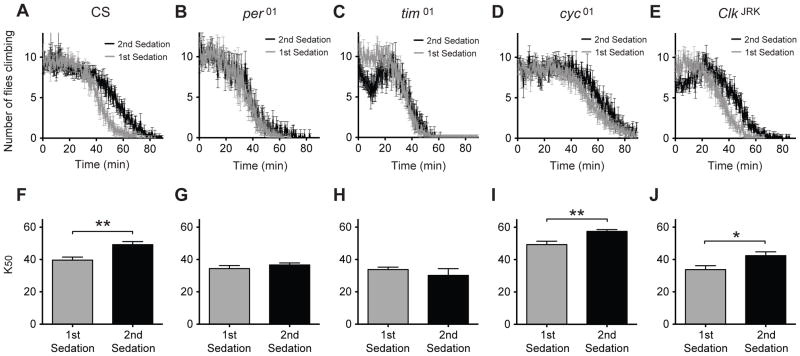
Each strain was then tested for the capacity to acquire ethanol tolerance using a similar method to that described above. Two groups of age- and sex-matched flies from the same strain were used. One group was exposed to the vapor from a 75% ethanol solution for one hour while the other group was mock treated (day 1 treatment). Twenty-four hours later, both groups were exposed to the vapor from a 35% ethanol solution until sedated (day 2 treatment). During the day 2 treatment, the rate of sedation was recorded and the 50% knock-down time (K50) was determined. A population was said to be tolerant if the K50 of the group receiving a second sedation was significantly higher than that of the group receiving a first sedation. Again, all data plotted in the same panel has been collected at the same time, and all quantitative comparisons are only made between data collected at the same time. We did not compare the magnitudes of any of our measures between stocks. We only ask whether a mutation prevented the acquisition of functional ethanol tolerance with respect to the K50 of sedation. Figure 2A shows that wild-type CS flies developed tolerance to this dose of ethanol. However, per01 (Figure 2B, 2G) and tim01 (Figure 2C, 2H) mutants failed to acquire tolerance. The cyc01 circadian mutant appears to weakly acquire tolerance (Figure 2D, 2I) but this is later demonstrated to be due to another attribute of this mutant (below). However, the ClkJRK (Figure 2E, 2J) mutant unambiguously acquires tolerance. The relationships between mutant allele and the ethanol tolerance response were experimentally repeatable. Another non-wild type behavior that we observed was that during the second ethanol treatment, a significant portion of the ClkJRK mutants began the experiment on the bottom of the vial and were not counted. However, soon after as the ethanol vapor entered the vial they moved to the wall of the vial and were counted. The tim01 mutant also showed a related phenotype in that at about 10 minutes into the ethanol exposure a significant portion of the second sedation flies moved/fell to the bottom of the vial. However, these were not sedated because shortly after this time point they reappeared on the vial walls and were counted as non-sedated animals.
Figure 2. Some circadian mutants disrupt tolerance to ethanol.
Shown are knockdown curves that compare flies receiving their first sedation to flies receiving their second sedation for A) CS, B) per01, C) tim01, D) cyc01, and E) ClkJRK. The corresponding bar graph for K50 is shown for F) CS, G) per01, H) tim01, I) cyc01, and J) ClkJRK. Statistical significance was determined using Student's t test (* p<0.05, **p<0.01; n=4 vials for per01 test, n=6 vials for all others; each vial contains 10 animals).
Effect of circadian mutations on specific components of tolerance
When initially exposed to a sedating dose of ethanol vapor, net activity measurements have shown that flies display a hyperactive phase before they enter the sedation phase (Moore et al., 1998). Because the analysis of tolerance described above measures only the number of flies climbing on the wall of the vial, it does not distinguish whether a mutation disrupts the production of tolerance by altering the hyperactive phase, the sedation phase, or both. To address this question, we used the same tolerance-inducing paradigm, but measured the locomotor activity of the flies throughout the ethanol exposure. The activity curve provides a way to classify how mutations change the ethanol response. This approach has been used by others to characterize the effect of mutations on different phases of tolerance (Kong et al., 2010). Because the method used to sedate the flies involves passive evaporation of ethanol from a fiber plug the ethanol vapor concentration gradually climbs so that the animals experience a gradual increase in the ethanol dose. The rationale behind this delivery method was that animals were exposed to a range of ethanol concentrations which provides added opportunity to see differences between mutant and wild type behavior.
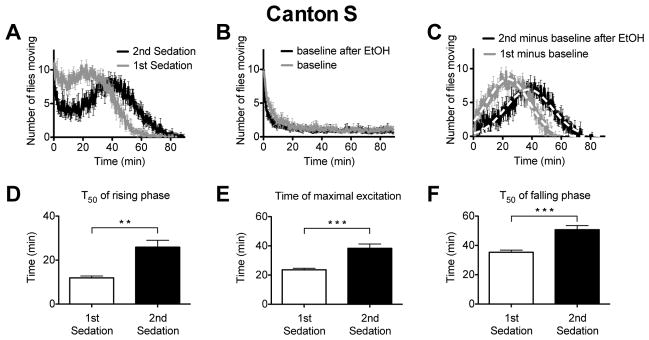
The same data plotted in Figure 2 was reanalyzed to capture the net activity of the flies. The movement curves typically had a side-ways S-shape. There was a peak of activity at t=0 min, followed by a decline, and a second activity peak (Figure 3A). The zero time point peak was thought to be analogous to the startle peak which, as described by Wolf et al. (2002), occurs when flies perceive the odor of ethanol–a new stimulus. In our system, flies have also just been moved into a new chamber and therefore the startle peak might be in response to the act of being moved to the new chamber and/or to the odor of ethanol. To determine the origin of the first peak, the baseline activity profile was measured in flies placed into a chamber that did not contain ethanol. As shown in Figure 3B, wild type flies placed in a new chamber show an initial burst of activity that corresponds to the first peak during ethanol treatment, and which rapidly declines to a low level of movement. The movement curves do not decline to zero because the flies are not being sedated and occasionally a fly moves to a new position throughout the assay. The wild type baseline curves were highly reproducible and not even sedating flies with ethanol 24 h before measuring the baseline noticeably altered baseline activity (Figure 3B).
Figure 3. A movement assay shows distinct attributes of tolerance.
A) An activity plot of wild-type Canton S flies that compares the number of flies moving after receiving their first or second dose of ethanol. B) A baseline movement activity plot of the wild type flies placed in the test chamber without ethanol vapor. The baseline flies were mock-sedated 24 h before being placed in the test chamber. The baseline after ETOH flies were sedated with ethanol 24 h before being placed in a test chamber without ethanol. C) The ethanol component of the response curve was isolated by subtracting the baseline data (panel B) from the raw ethanol response data (panel A). The 1st minus baseline curve is produced by subtracting the baseline curve (panel B) from the 1st sedation curve (panel A). The 2nd minus baseline after ethanol curve was produced by subtracting the baseline after ETOH (panel B) from the 2nd sedation data (panel A). Error bars are standard error of the mean (n=6). The dotted white line is a nonlinear best-fit of single Gaussian curve to the data. Bar graphs were derived from the data in panel C and depict D) the T50 of the rising phase, which is the time at which the rises to 50% maximum amplitude, E) the time of maximal movement activity (Tmax), and F) the T50 of the falling phase, which is the time at which the curve decays to 50% maximum amplitude. The wild type shows evidence that it has acquired ethanol tolerance in all three of these parameters. Statistical significance was determined using a two-tailed Student's t test (**p=0.0016; ***p<0.001; n=6 vials; each vial contains 10 animals).
To isolate the activity changes produced by ethanol vapor we subtracted the baseline activity data from the corresponding raw activity data of the flies in the ethanol exposure vials for each individual trial (conceptually, for the wild type, this is a subtraction of Figure 3B from Figure 3A). The resulting values were averaged to produce the isolated ethanol response component, which takes the form of a Gaussian distribution (Figure 3C). Prior ethanol sedation produces ethanol tolerance and obviously shifted the ethanol activity curve to the right. To evaluate the statistical significance of this shift we collected critical values that characterize the activity response curves. A Guassian distribution was fit to the isolated ethanol response component (Figure 3C) and curve-fitting equations were used to capture three parameters from the curves: 1) the T50 of the rising phase (time of 50% activation), the Tmax (Time of maximal excitation), and the T50 of the falling phase (time of 50% decay). The falling phase of the activity curve directly correspond to the animal sedation (c.f. Figure 2A and Figure 3C). Ethanol tolerance can be detected using any of these parameters–the time of 50% activation, maximal activity, and 50% decay from maximal activity are all larger in animals receiving their second sedation than in wild type animals receiving their first sedation. For the wild type, these parameters are shown in Figure 3D–F.
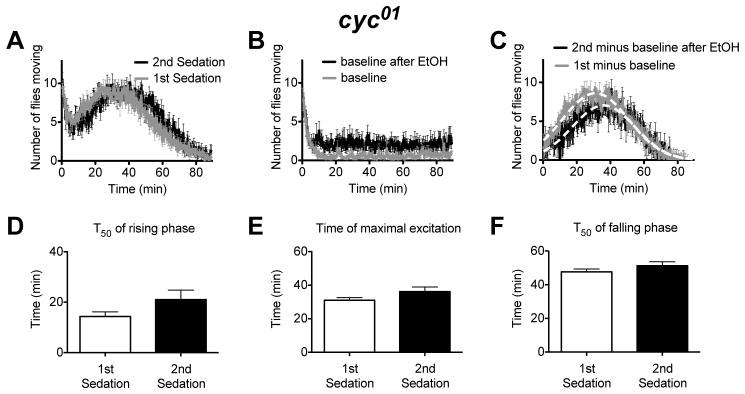
The no-ethanol baseline activity values for the circadian mutants was not statistically different from the wild type (2-way ANOVA with Bonferonni posttest, P=0.061 for the entire curves, but P=0.3 after the initial acclimation period-plateau from 30 to 80 min). Furthermore, with the exception of the cyc01 mutation, ethanol sedation 24 h prior also did not affect baseline activity. Prior ethanol sedation caused a slight increase in the baseline activity of the cyc01 line (Fig.6B).
Figure 6. A movement assay shows that the cyc01 mutation disrupts some but not all aspects of the tolerance response.
A) An activity plot that compares the number of flies moving for cyc01 flies receiving their first or second dose of ethanol. B) A baseline movement activity plot of cyc01 flies was generated as described in figure 2. C) The ethanol component of the response curve was isolated as described in figure 2. The cyc01 mutants do not show evidence of rapid ethanol tolerance in the the T50 of the rising phase of the activity curve (D), the Tmax of the activity curve (E), or in the T50 of the falling phase of the activity curve (F). Statistical significance was determined using a two-tailed Student's t test (n=6 vials; each vial contains 10 animals).
When analyzing the circadian mutants for the capacity to acquire ethanol tolerance (below), we only asked whether the stock could acquire tolerance. We never compared the magnitude of the parameters between stocks. In all cases, profiles for the first ethanol response and second ethanol response were determined at the same time such that the capacity to acquire tolerance was always evaluated using animals that were tested in parallel.
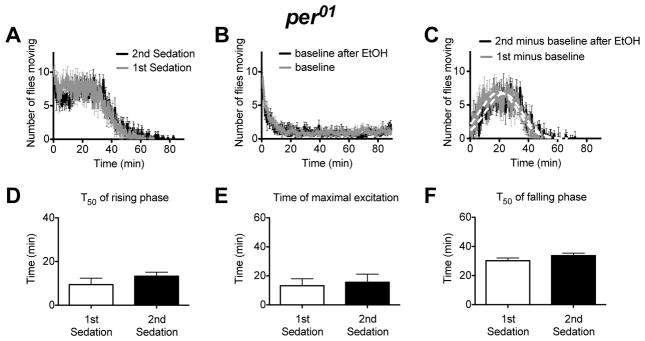
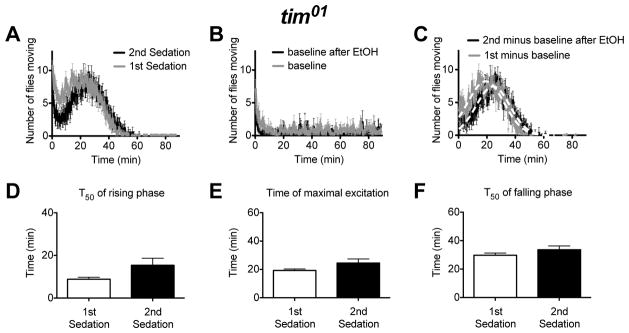
Analysis of the isolated ethanol response curves showed that the per01, tim01 and cyc01 mutant animals did not show tolerance in any of the three quantitative parameters derived from the activity curves (Tmax, and the T50 of the rising and falling phases of the curve; see Figures 4, 5, and 6). These three mutations appear to interfere with all aspects of functional tolerance.
Figure 4. A movement assay shows that flies carrying the per01 mutation do not acquire any attributes of rapid tolerance.
A) An activity plot that compares the number of flies moving for per01 flies that are receiving their first or second dose of ethanol. B) A baseline movement activity plot of per01 flies was generated as described in figure 2. C) The ethanol component of the response curve was isolated as described in figure 2. The per01 mutants do not show evidence of rapid ethanol tolerance in the the T50 of the rising phase of the activity curve (D), the Tmax of the activity curve (E), or in the T50 of the falling phase of the activity curve (F). Statistical significance was determined using a two-tailed Student's t test (n=4 vials; each vial contains 10 animals).
Figure 5. A movement assay shows that flies carrying the tim01 mutation do not acquire any attributes of rapid tolerance.
A) An activity plot that compares the number of flies moving for tim01 flies receiving their first or second dose of ethanol. B) A baseline movement activity plot of tim01 flies was generated as described in figure 2. C) The ethanol component of the response curve was isolated as described in figure 2. The tim01 mutants do not show evidence of rapid ethanol tolerance in the the T50 of the rising phase of the activity curve (D), the Tmax of the activity curve (E), or in the T50 of the falling phase of the activity curve (F). Statistical significance was determined using a two-tailed Student's t test (n=6 vials; each vial contains 10 animals).
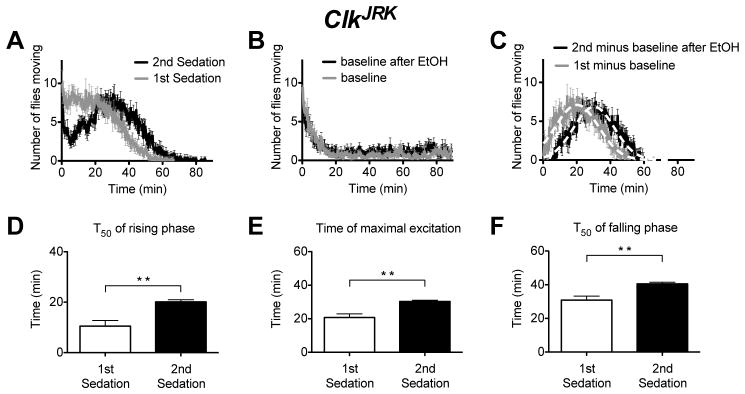
However, the ClkJRK mutant displays a wild type ethanol tolerance phenotype (Figure 7). Like wild type, the ClkJRK mutants receiving their second ethanol sedation had a right shifted ethanol response curve and an increase in T50 of the rising phase (time of 50% activation), time of maximal excitation (Tmax) and the T50 of the falling phase (time of 50% decay). These results strongly indicate that the Clk gene is not important in the production of ethanol tolerance.
Figure 7. A movement assay shows that the ClkJRK mutation does not disrupt tolerance.
A) An activity plot that compares the number of flies moving for ClkJRK flies receiving their first or second dose of ethanol. B) A baseline movement activity plot of ClkJRK flies was generated as described in figure 2. C) The ethanol component of the response curve was isolated as described in figure 2. The ClkJRK mutants show evidence that they have acquired rapid ethanol tolerance in the T50 of the rising phase of the activity curve (D), the Tmax of the activity curve (E), or in the T50 of the falling phase of the activity curve (F). Statistical significance was determined using a two-tailed Student's t test (**p<0.005; n=6 vials; each vial contains 10 animals).
A non-genetic method of disrupting the molecular circadian clock blocks the acquisition of ethanol tolerance
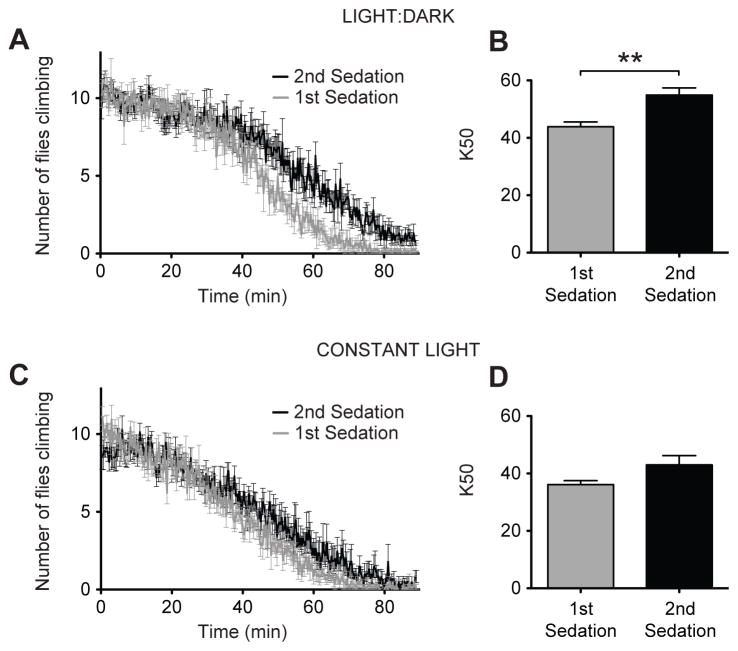
We sought a non-genetic method of disrupting the circadian clock as a way to validate the role of the circadian proteins in producing functional ethanol tolerance. In Drosophila, constant light exposure molecularly disrupts the cycling of the circadian clock and eliminates circadian behavioral rhythmicity (Konopka et al., 1989; Myers et al., 1996; Lin et al., 2001). One- to two-day old flies were collected and placed in a constant-light environment for five days causing them to lose circadian rhythmicity. These arrhythmic animals were tested for the capacity to acquire ethanol tolerance (Figure 8). These flies were divided into two groups. One group was sedated using ethanol vapor and the other group was mock sedated. Twenty-four hours later, both groups were sedated with the vapor from a 35% ethanol solution, and the rate of sedation was recorded. A tolerance assay was also performed on flies that were incubated under a 12:12 light-dark cycle in parallel. As shown in Figure 8, exposure to constant light blocked the acquisition of tolerance.
Figure 8. Constant light eliminates ethanol tolerance in wild-type flies.
Knockdown curves are shown comparing flies receiving their first sedation to flies receiving their second sedation for A) flies maintained in a 12:12 light:dark cycle and C) flies maintained in constant light. Corresponding bar graphs depicting K50 comparing flies receiving their first and second treatment are shown for B) Light:Dark flies and D) Constant light flies. Under 12:12 light dark conditions the rhythm index measured over three days was 0.139+/− 0.011 (n=24) while under constant light conditions the rhythm index dropped to 0.041 +/− 0.0009 (n=23). Statistical significance was determined using Student's t test (**p<0.01; n=6 vials; each vial contains 10 animals).
Discussion
In this paper, we show not only that circadian genes are involved in the generation of tolerance to ethanol in the fruit fly but that this involvement is independent of the regulation of circadian rhythmicity. This is in concordance with an observation by van der Linde and Lyons (2011) that the magnitude of ethanol tolerance does not cycle in a circadian fashion. The mutations that we examined all eliminate circadian rhythmicity but not all of them eliminate the capacity to acquire ethanol tolerance. Mutations in per or tim block tolerance to the sedative effects of ethanol, as measured in a simple sedation assay. In the sedation curve, a mutation in cyc does not appear to completely eliminate tolerance however the basal activity curve suggests that the apparent difference in the rate of sedation can be attributed to the increase in basal activity produced by prior ethanol sedation. Only the cyc01 mutant showed this lasting effect of ethanol on baseline activity. Finally a mutation in the Clk gene does not appear to have any affect on the capacity to acquire tolerance even though it, like all of the other circadian mutations tested, eliminates circadian rhythms. This indicates that role of the circadian genes in producing ethanol tolerance is independent of their role in producing circadian rhythmicity. Furthermore, subjecting wild-type flies to constant light—which produces behavioral arrhythmicity (Konopka et al., 1989)—disrupted the capacity to acquire ethanol tolerance. This reduction in the capacity to acquire tolerance can be interpreted in molecular terms because constant light molecularly destabilizes the PER and TIM transcription factors in flies (Lee et al., 1996; Naidoo et al., 1999). Thus, constant light is a non-genetic method for disrupting the circadian clock that provides supportive evidence for the interpretation that the PER and TIM proteins are essential for the acquisition of functional tolerance. Taken together, these results indicate that some, but not all, of the circadian genes are necessary for ethanol tolerance in the fly. With respect to the nervous system, the circadian clock might be considered to be a homeostatic regulator of neural excitability, at times increasing or decreasing excitably by shifting the homeostatic set point. Perhaps, some of the circadian proteins have a role in regulating neural homeostasis above and beyond their role in producing circadian rhythms. It may be that exogenously produced changes in excitability are sensed by this mechanism and that they attempt to restore normal excitability. These changes could be the initial steps in the adaptation to ethanol that we call functional tolerance.
The first study to show that circadian genes play a role in a drug response was conducted in Drosophila. Andretic et al. (1999) found that flies carrying a loss-of-function mutation in per, cyc, or Clk failed to show normal sensitization in response to multiple applications of cocaine. This observation translated well to mammals. A link between cocaine responsivity and circadian genes was subsequently shown to exist in mammals. In mice, mper1 mutants do not show normal sensitization to cocaine, whereas mper2 mice are hypersensitive to cocaine (Abarca et al., 2002). Our description of the interaction between the circadian genes and ethanol exhibits parallels to the relationship between circadian genes and cocaine sensitization in Drosophila in that only some mutations that cause circadian arrhythmicity disrupt cocaine sensitization. For cocaine sensitization mutations in per, cyc, and Clk but not tim block the response (Andretic et al., 1999). With regard to ethanol tolerance, we observed that mutations in per, tim, and cyc affect ethanol tolerance but a mutation in Clk does not. A second commonality is that halting the ticking of the circadian clock is not the event that disrupts the drug response. The differential requirement for Clk and tim for producing cocaine sensitization and ethanol tolerance is interesting but not surprising. Cocaine and ethanol are very different drugs that produce very different acute adaptations with repetitive use (sensitization vs. tolerance). We do not know why one gene should be important for a cocaine response but not an ethanol response while the other gene should be important for an ethanol response but not a cocaine response. However, for both drugs it is clear that the role played by circadian genes in the drug response is not causally linked to the cycling of the circadian clock.
Others have also identified a link between circadian genes and ethanol. Consumption of ethanol is increased in mper2Brdm1 mutant mice (Spanagel et al., 2005a), and chronic ethanol exposure causes dysregulation of mper levels in a variety of brain regions (Chen et al., 2004). A mutation in mouse mper2 but not mper1 was shown to block the diurnal cycling in the sensitivity to ethanol intoxication (Perreau-Lenz et al., 2009b). In Drosophila, it has also been reported that circadian modulation of ethanol sensitivity is dependent on a functional per gene (van der Linde and Lyons, 2011). Furthermore, the mper2Brdm1 mutation has been shown to prevent the ethanol-induced modulation of B-endorphin release from mediobasal hypothalamic cells both during acute and chronic ethanol exposure in mice (Agapito et al., 2010). These data provide strong evidence that the PER protein is important for alcohol responses. However, mammals have three per homologs, and because of this functional redundancy, a mutation in the per2 gene does not completely eliminate circadian rhythms (Bae et al., 2001). As a result of the added complexity in mammals, it has not been possible to ascertain whether it is the normal running of the circadian clock itself that is required for an ethanol response or whether the circadian gene has a role in producing the ethanol response outside of role in producing a cycling circadian clock. The work described herein shows that circadian genes can act in a manner independent of circadian rhythmicity to promote drug responses.
Materials and Methods
Stocks, Media, and Fly Handling
All flies were raised in 12:12 light conditions on standard cornmeal/agar/yeast medium. The wild-type strain used in this study is Canton S (CS). The non-backcrossed mutants per01, tim01, cyc01, and ClkJRK, were kind gifts from Dr. Paul Hardin. All flies used in the experiments were isolated without anesthesia in the following manner. Briefly, a finger from a glove was placed over a fly food vial. A hole in the tip of the finger was made through which was inserted a flypette. Flies were captured by aspiration.
We tested mutations in the core circadian genes. Each of these mutations—per01, tim01, cyc01, and ClkJRK—renders flies behaviorally arrhythmic. These mutant alleles have distinct origins, therefore we suspected that they were in distinct genetic backgrounds. Preliminary examination of the stocks showed that the first three mutations perturbed the ability to acquire ethanol tolerance. To eliminate differences due to genetic background, all four mutations were back-crossed into our wild-type Canton S (CS) strain for six generations. For the per01, tim01, and cyc01 alleles, the abnormal tolerance phenotype segregated with the mutation in the circadian gene. The tight genetic linkage of the ethanol tolerance phenotype to the mutation provides strong evidence that it is these gene mutations that disrupt alcohol tolerance. The identity of each mutant was molecularly verified and the mutant allele tracked by genomic PCR.
Backcrossing
All mutants were backcrossed into the CS background for six generations. PCR was performed after each cross to confirm the presence of the mutation. In the final cross, siblings that carried the mutation were mated to produce homozygous stocks. The primers used for the detection of mutants were:_ perwt-18U (for detection of the wild-type per allele), 5'-CATACCGCTTCCTCATCC-3'; per01-18U (for detection of the per01 allele), 5'-CATACCGCTTCCTCATCT-3'; perL1 (common per lower primer), 5'-GGTCCTGGAAGGTGAAATGA-3'; timWT-20U (for detection of the wild-type tim allele), 5'-GTCCGATCTGAGGTGCCTTT-3'; tim01-20U (for detection of the tim01 allele), 5'-TGCAGATTAGCGAAATCAGT-3'; timL1 (common tim lower primer), 5'-CAGCGTGGCAAACCTGTAAT-3'; cycwt-18U (for detection of the wild-type cyc allele), 5'-TCGACGTCCTGCATCCGA-3'; cyc01-18 (for detection of the cyc01 allele), 5'-TCGACGTCCTGCATCCGT-3'; cycL1 (common cyc lower primer), 5'-CTCTGTGGAACGTCGGTCTT-3'; Clkwt-18U (for detection of the wild-type Clk allele), 5'-ATCTGCACACGCAGCACC-3'; ClkJRK-18U (for detection of the ClkJRK allele), 5'-ATCTGCACACGCAGCACT-3'; and ClkL1 (common Clk lower primer), 5'-CATCGATATCCTCACGCAGT-3'.
Tolerance and Sensitivity Assays
All sensitivity and tolerance assays were conducted between the hours of ZT5 to ZT9 to minimize differences that might be attributed to circadian rhythms. Flies used in these assays had not been previously sedated by any other means (see fly handling above).
For sensitivity assays, four-to six-day-old females are loaded into vials with 10 flies per vial. One mL of 35% ethanol is pipetted onto one-third of a Flug (Genesee Scientific, San Diego, CA) and placed into the bottom of the vial. A platform with an air-permeable Kimwipe prevents the flies from being able to reach the Flug. With time, the ethanol vapor concentration in the vial rises and eventually sedates the flies. Vials of wild type and mutants are interdigitated so that each alternating vial contains flies from a different group. The sedation profile of the flies is captured with a camera that takes pictures every 20 seconds.
The measurement of tolerance is performed in a related way using a two-day protocol and two groups of 4–6 day old female flies. On day 1, one group (experimental group) is exposed for 1 hour to vapor from 1 ml of a 75% ethanol solution that was pipetted onto a Flug in the bottom of the vial. A second group (control group) is mock exposed at the same time (day 1) using a Flug containing 1 mL of water (0% ethanol control). The purpose of the day 1 treatment is to induce tolerance in the experimental group. Both groups are returned to fresh fly food for twenty-four hours. On day 2, both the experimental and control groups are exposed to vapor from a Flug that contains 1 ml of 35% ethanol. A camera takes pictures every 20 seconds during the day 2 sedation. The experimental group are said to have acquired tolerance if the K50 of the sedation curve of experimental group is significantly greater than that of the sedation curve of the control group. For day 2, we used 35% ethanol because it provided a slower knock down that revealed more detail in the sedation curves and movement curves. On the day the sedation curves are recorded (day 2), both groups receive the same dose of ethanol and therefore the difference in their response can reveal the acquisition of tolerance.
The number of flies climbing on the vial and the number of flies moving during each 20 second frame were counted using an automated particle counter program written in MATLAB (The Mathworks, Natick, MA). The time when 50% of the flies are knocked down (K50) was determined by fitting an inverse cumulative normal function to the sedation curves. In this assay, flies were considered sedated when they were no longer climbing the walls of the vial and remained at its base out of view of the camera.
The activity/movement curves quantify the rate of movement of the flies. As ethanol evaporates from the plug in the base of the vial, fly movement is stimulated and the rate climbs. Eventually, the amount of ethanol is sufficient to cause sedation which appears as a reduction in net movement in part because there are fewer flies on the walls of the vial. The first peak of activity was shown to correspond to be a startle peak that occurs when flies are moved to a new environment. We measured this peak independently in the absence of alcohol and subtracted it from the ethanol activity curves. The resulting data was fit with a Gaussian curve and the Tmax determined in Prism (GraphPad Software, Inc, La Jolla, CA). The T50 of the rising phase and falling phases of the curve were determined using the equation T50= Tmax ± SD*sqrt(ln2).
Gas Chromatography to determine ethanol content
Four day old females are loaded into vials with 10 flies per vial. One mL of 35% ethanol is pipetted onto one-third of a Flug (Genesee Scientific, San Diego, CA) and placed into the bottom of the vial. A platform with an air-permeable Kimwipe prevents the flies from being able to reach the Flug. Vials of wild type and mutants are interdigitated so that each alternating vial contains flies from a different group. Each group of 10 flies were transferred to a microfuge tube containing 700 uL of toluene and crushed using a plastic disposable pestle. Three-hundred microliters of the centrifuged supernatant was transferred to a gas chromatography vial. An auto sampler injected 3 μL of the supernatant into an SRI-310C Gas Chromatograph (SRI Instruments, Torrance, CA). The temperature protocol was: 50°C for 1 minute, 10 minute ramp to 150°C, and hold for 10 minutes. The ethanol peak elutes at approximately 2.4 minutes and the toluene peak elutes at approximately 10 minutes. All data were analyzed using PeakSimple (SRI Instruments, Torrance, CA). The area of the ethanol peak was determined using the integration tool. Determination of the ethanol content of the fly was determined by comparison to a known standard curve of ethanol. Water content of the females from each stock was 0.86 uL (Pohl et al., 2012).
The relationship between K50 and internal ethanol concentration was demonstrated by sedating groups of 10 flies with 35% ethanol (N=19) or with 40% ethanol (N=20). When 5 flies in each vial were sedated, all of the flies were removed and assayed for ethanol content by gas chromatography as described above.
Acknowledgments
This work was supported by the National Institute of Health grant R01 AA018037 to NSA and T32AA007471 awarded to JBP.
References
- Abarca C, Albrecht U, Spanagel R. Cocaine sensitization and reward are under the influence of circadian genes and rhythm. Proc Natl Acad Sci U S A. 2002;99:9026–9030. doi: 10.1073/pnas.142039099. [DOI] [PMC free article] [PubMed] [Google Scholar]
- Agapito M, Mian N, Boyadjieva NI, Sarkar DK. Period 2 gene deletion abolishes beta-endorphin neuronal response to ethanol. Alcohol Clin Exp Res. 2010;34:1613–1618. doi: 10.1111/j.1530-0277.2010.01246.x. [DOI] [PMC free article] [PubMed] [Google Scholar]
- Allada R, Chung BY. Circadian organization of behavior and physiology in Drosophila. Annu Rev Physiol. 2010;72:605–624. doi: 10.1146/annurev-physiol-021909-135815. [DOI] [PMC free article] [PubMed] [Google Scholar]
- Andretic R, Chaney S, Hirsh J. Requirement of circadian genes for cocaine sensitization in Drosophila. Science. 1999;285:1066–1068. doi: 10.1126/science.285.5430.1066. [DOI] [PubMed] [Google Scholar]
- Atkinson NS. Tolerance in Drosophila. J Neurogenet. 2009;23:1–10. doi: 10.1080/01677060802572937. [DOI] [PMC free article] [PubMed] [Google Scholar]
- Bae K, Jin X, Maywood ES, Hastings MH, Reppert SM, Weaver DR. Differential functions of mPer1, mPer2, and mPer3 in the SCN circadian clock. Neuron. 2001;30:525–536. doi: 10.1016/s0896-6273(01)00302-6. [DOI] [PubMed] [Google Scholar]
- Brower KJ. Alcohol’s effects on sleep in alcoholics. Alcohol Res Health. 2001;25:110–125. [PMC free article] [PubMed] [Google Scholar]
- Chen CP, Kuhn P, Advis JP, Sarkar DK. Chronic ethanol consumption impairs the circadian rhythm of pro-opiomelanocortin and period genes mRNA expression in the hypothalamus of the male rat. J Neurochem. 2004;88:1547–1554. doi: 10.1046/j.1471-4159.2003.02300.x. [DOI] [PubMed] [Google Scholar]
- Cowmeadow RB, Krishnan HR, Atkinson NS. The slowpoke gene underlies rapid ethanol tolerance in Drosophila. Alcoholism: Clinical and Experimental Research. 2005;29:1777–1786. doi: 10.1097/01.alc.0000183232.56788.62. [DOI] [PubMed] [Google Scholar]
- Danel T, Touitou Y. Chronobiology of alcohol: from chronokinetics to alcohol-related alterations of the circadian system. Chronobiol Int. 2004;21:923–935. doi: 10.1081/cbi-200036886. [DOI] [PubMed] [Google Scholar]
- Hardin PE. The circadian timekeeping system of Drosophila. Curr Biol. 2005;15:R714–22. doi: 10.1016/j.cub.2005.08.019. [DOI] [PubMed] [Google Scholar]
- Kong EC, Allouche L, Chapot PA, Vranizan K, Moore MS, Heberlein U, Wolf FW. Ethanol-regulated genes that contribute to ethanol sensitivity and rapid tolerance in Drosophila. Alcohol Clin Exp Res. 2010;34:302–316. doi: 10.1111/j.1530-0277.2009.01093.x. [DOI] [PMC free article] [PubMed] [Google Scholar]
- Konopka RJ, Pittendrigh C, Orr D. Reciprocal behaviour associated with altered homeostasis and photosensitivity of Drosophila clock mutants. J Neurogenet. 1989;6:1–10. doi: 10.3109/01677068909107096. [DOI] [PubMed] [Google Scholar]
- Lee C, Parikh V, Itsukaichi T, Bae K, Edery I. Resetting the Drosophila clock by photic regulation of PER and a PER-TIM complex. Science. 1996;271:1740–1744. doi: 10.1126/science.271.5256.1740. [DOI] [PubMed] [Google Scholar]
- Lin FJ, Song W, Meyer-Bernstein E, Naidoo N, Sehgal A. Photic signaling by cryptochrome in the Drosophila circadian system. Mol Cell Biol. 2001;21:7287–7294. doi: 10.1128/MCB.21.21.7287-7294.2001. [DOI] [PMC free article] [PubMed] [Google Scholar]
- McElroy B, Zakaria A, Glass JD, Prosser RA. Ethanol modulates mammalian circadian clock phase resetting through extrasynaptic GABA receptor activation. Neuroscience. 2009;164:842–848. doi: 10.1016/j.neuroscience.2009.08.020. [DOI] [PMC free article] [PubMed] [Google Scholar]
- Moore MS, DeZazzo J, Luk AY, Tully T, Singh CM, Heberlein U. Ethanol intoxication in Drosophila: Genetic and pharmacological evidence for regulation by the cAMP signaling pathway. Cell. 1998;93:997–1007. doi: 10.1016/s0092-8674(00)81205-2. [DOI] [PubMed] [Google Scholar]
- Myers MP, Wager-Smith K, Rothenfluh-Hilfiker A, Young MW. Light-induced degradation of TIMELESS and entrainment of the Drosophila circadian clock. Science. 1996;271:1736–1740. doi: 10.1126/science.271.5256.1736. [DOI] [PubMed] [Google Scholar]
- Naidoo N, Song W, Hunter-Ensor M, Sehgal A. A role for the proteasome in the light response of the timeless clock protein. Science. 1999;285:1737–1741. doi: 10.1126/science.285.5434.1737. [DOI] [PubMed] [Google Scholar]
- Perreau-Lenz S, Zghoul T, de Fonseca FR, Spanagel R, Bilbao A. Circadian regulation of central ethanol sensitivity by the mPer2 gene. Addict Biol. 2009a;14:253–259. doi: 10.1111/j.1369-1600.2009.00165.x. [DOI] [PubMed] [Google Scholar]
- Perreau-Lenz S, Zghoul T, de Fonseca FR, Spanagel R, Bilbao A. Circadian regulation of central ethanol sensitivity by the mPer2 gene. Addict Biol. 2009b;14:253–259. doi: 10.1111/j.1369-1600.2009.00165.x. [DOI] [PubMed] [Google Scholar]
- Pohl JB, Baldwin BA, Dinh BL, Rahman P, Smerek D, Prado F, Jr, Sherazee N, Atkinson NS. Ethanol Preference in Drosophila melanogaster is Driven by Its Caloric Value. Alcohol Clin Exp Res. 2012 doi: 10.1111/j.1530-0277.2012.01817.x. [DOI] [PMC free article] [PubMed] [Google Scholar]
- Prescott CA, Kendler KS. Genetic and environmental contributions to alcohol abuse and dependence in a population-based sample of male twins. Am J Psychiatry. 1999;156:34–40. doi: 10.1176/ajp.156.1.34. [DOI] [PubMed] [Google Scholar]
- Prosser RA, Mangrum CA, Glass JD. Acute ethanol modulates glutamatergic and serotonergic phase shifts of the mouse circadian clock in vitro. Neuroscience. 2008;152:837–848. doi: 10.1016/j.neuroscience.2007.12.049. [DOI] [PMC free article] [PubMed] [Google Scholar]
- Rosenwasser AM, Fecteau ME, Logan RW, Reed JD, Cotter SJ, Seggio JA. Circadian activity rhythms in selectively bred ethanol-preferring and nonpreferring rats. Alcohol. 2005;36:69–81. doi: 10.1016/j.alcohol.2005.07.001. [DOI] [PubMed] [Google Scholar]
- Scholz H, Ramond J, Singh CM, Heberlein U. Functional ethanol tolerance in Drosophila. Neuron. 2000;28:261–271. doi: 10.1016/s0896-6273(00)00101-x. [DOI] [PubMed] [Google Scholar]
- Seggio JA, Fixaris MC, Reed JD, Logan RW, Rosenwasser AM. Chronic ethanol intake alters circadian phase shifting and free-running period in mice. J Biol Rhythms. 2009;24:304–312. doi: 10.1177/0748730409338449. [DOI] [PMC free article] [PubMed] [Google Scholar]
- Seggio JA, Possidente B, Ahmad ST. Larval ethanol exposure alters adult circadian free-running locomotor activity rhythm in Drosophila melanogaster. Chronobiol Int. 2012;29:75–81. doi: 10.3109/07420528.2011.635236. [DOI] [PubMed] [Google Scholar]
- Spanagel R, Pendyala G, Abarca C, Zghoul T, Sanchis-Segura C, Magnone MC, Lascorz J, Depner M, Holzberg D, Soyka M, Schreiber S, Matsuda F, Lathrop M, Schumann G, Albrecht U. The clock gene Per2 influences the glutamatergic system and modulates alcohol consumption. Nat Med. 2005a;11:35–42. doi: 10.1038/nm1163. [DOI] [PubMed] [Google Scholar]
- Spanagel R, Rosenwasser AM, Schumann G, Sarkar DK. Alcohol consumption and the body’s biological clock. Alcohol Clin Exp Res. 2005b;29:1550–1557. doi: 10.1097/01.alc.0000175074.70807.fd. [DOI] [PubMed] [Google Scholar]
- Taghert PH, Shafer OT. Mechanisms of clock output in the Drosophila circadian pacemaker system. J Biol Rhythms. 2006;21:445–457. doi: 10.1177/0748730406293910. [DOI] [PubMed] [Google Scholar]
- Urizar NL, Yang Z, Edenberg HJ, Davis RL. Drosophila homer is required in a small set of neurons including the ellipsoid body for normal ethanol sensitivity and tolerance. J Neurosci. 2007;27:4541–4551. doi: 10.1523/JNEUROSCI.0305-07.2007. [DOI] [PMC free article] [PubMed] [Google Scholar]
- van der Linde K, Lyons LC. Circadian modulation of acute alcohol sensitivity but not acute tolerance in Drosophila. Chronobiol Int. 2011;28:397–406. doi: 10.3109/07420528.2011.577921. [DOI] [PubMed] [Google Scholar]
- van Oort BE, Tyler NJ, Gerkema MP, Folkow L, Blix AS, Stokkan KA. Circadian organization in reindeer. Nature. 2005;438:1095–1096. doi: 10.1038/4381095a. [DOI] [PubMed] [Google Scholar]
- Wolf FW, Rodan AR, Tsai LT, Heberlein U. High-resolution analysis of ethanol-induced locomotor stimulation in Drosophila. J Neurosci. 2002;22:11035–11044. doi: 10.1523/JNEUROSCI.22-24-11035.2002. [DOI] [PMC free article] [PubMed] [Google Scholar]


