Abstract
Objectives
Proteinase-activated receptor 2 (PAR2) is a G protein-coupled receptor activated by serine proteinases with proinflammatory activity. A study was undertaken to investigate the presence and functional significance of PAR2 expression on rheumatoid arthritis (RA)-derived leucocyte subsets.
Methods
Venous blood was obtained from patients with RA and osteoarthritis (OA) as well as healthy control subjects. Surface expression of PAR2 on peripheral blood mononuclear cells (PBMCs) was analysed by flow cytometry and interleukin 6 (IL-6) generation by ELISA.
Results
Patients with RA had elevated but variable surface expression of PAR2 on CD14+ monocytes compared with control subjects (median (1st to 3rd quartiles) 1.76% (0.86–4.10%) vs 0.06% (0.03–0.81%), p<0.0001). CD3+ T cells showed a similar pattern with significantly higher PAR2 expression in patients with RA compared with controls (3.05% (0.36–11.82%) vs 0.08% (0.02–0.28%), p<0.0001). For both subsets, PAR2 expression was significantly higher (p<0.00001) in patients with high levels of disease activity: PAR2 expression for both CD14+ and CD3+ cells correlated to C reactive protein and erythrocyte sedimentation rate. Furthermore, in a cohort of patients with newly diagnosed RA, elevated PAR2 expression in both CD14+ and CD3+ cells was significantly reduced 3 months after methotrexate or sulfasalazine treatment and this reduction correlated significantly with the reduction in the 28-joint Disease Activity Scale score (p<0.05). PAR2 expression on cells from patients with OA was low, similar to levels seen in control subjects. Generation of IL-6 by monocytes in response to a selective PAR2 agonist was significantly greater in patients with RA than in patients with OA and control subjects (p<0.05).
Conclusions
These findings are consistent with a pathogenic role for PAR2 in RA.
INTRODUCTION
Proteinase-activated receptors are a novel family of seven-transmembrane G protein-coupled receptors uniquely activated by proteinase cleavage of the receptor N terminus, revealing an activating ligand that binds to extracellular loop-2 of the receptor.1,2 Proteinase-activated receptor 2 (PAR2) is a member of this family with putative proinflammatory roles which remain poorly defined in human diseases. PAR2 is upregulated in Freund’s adjuvant-induced arthritis in rodents and chronic inflammation is substantially reduced in PAR2-deficient mice.3 Selective activation of PAR2 promotes joint swelling and synovial hyperaemia in mice3 and has been shown to promote cytokine release from human cell lines in vitro.4 More recently we have shown that PAR2 is upregulated in synovium from patients with rheumatoid arthritis (RA) and a selective PAR2 antagonist substantially inhibited generation of tumour necrosis factor (TNF) α from RA synovial membrane digests.5 We also observed that CD68+ cells in the synovium expressed PAR2, confirming the findings of a previous study6 which also showed that synovial T cells (CD3) could express PAR2. This raises the important question as to whether PAR2 expression is a consequence of the articular environment or, instead, a property of circulating leucocyte subsets a priori. The latter, if confirmed, would place PAR2-mediated activation as an early phase event upon entry to the synovial compartment. Previous studies in healthy subjects found low7 or no8 PAR2 surface expression in CD14+ cells from freshly drawn blood, although there appeared to be intracellular stores of PAR2.7 CD3+ T cells and CD34+ stem cells also did not show significant cell surface PAR2 expression.7 There is some evidence for PAR2 activation leading to development of antigen presenting cells from peripheral blood.9 These various studies suggest that, normally, relatively little PAR2 is expressed on peripheral blood mononuclear cells (PBMCs). However, a role for this receptor in RA has not yet been investigated, so we tested the hypothesis that PAR2 expression is increased in PBMCs derived from patients with RA.
METHODS
Patients
This was a cross-sectional study in which venous blood samples were obtained from patients with RA attending the outpatient clinic (n=75) as well as a subgroup admitted with an increase in disease activity during a flare (n=19).10 The group contained 14 men and 80 women of median age 61 years (range 38–84). C reactive protein (CRP) and erythrocyte sedimentation rate (ESR) were measured in serum and plasma, respectively, drawn simultaneously with the PBMCs under evaluation. A control group of healthy individuals (n=15) was also investigated, consisting of five men and 10 women of median age 44 years (range 23–66). A subset of patients with early RA, defined as not previously having been diagnosed with RA and disease-modifying antirheumatic drug (DMARD)-naïve, was also examined (n=18; age range 25–81 years). A cohort of patients with radiological evidence of osteoarthritis (OA) was also included (n=6; median age 60.5 years, range 48–68).
Preparation of PBMCs
Peripheral blood, either from healthy donors or from patients with RA and OA, was collected in heparin bottles and PBMCs were isolated by density gradient centrifugation using Histopaque-1077 (Sigma, Dorset, UK) as indicated in the manufacturer’s instructions. Briefly, blood was diluted 1:1 with sterile phosphate buffered saline (PBS) prior to layering over Histopaque followed by centrifugation at 250g for 20 min at room temperature. After centrifugation, the top plasma layer was collected and retained for use in fluorescence activated cell sorting (FACS) buffer. The mononuclear cell layer was then removed to a fresh tube and the cells washed three times in sterile PBS (150g for 10 min at 4°C). Cells were counted and the concentration adjusted to 2×10⁶/ml and used for FACS analysis or cell culture studies as outlined below.
Cell culture reagents
All reagents including sterile PBS, RPMI, fetal bovine serum (FBS), glutamine and penicillin/streptomycin were supplied by Invitrogen (Paisley, UK) and β-mercaptoethanol was supplied by Sigma. The PAR2 activating peptide SLIGKV-NH2 and the reverse peptide VKGILS-NH2 were purchased from TOCRIS Bioscience, Bristol, UK.
Isolation of CD14+ monocytes
In a subset of samples, CD14+ cells were purified from the PBMCs and PAR2 expression confirmed using confocal microscopy. Briefly, CD14+ cells were isolated using the human CD14 selection kit from Stemcell Technologies (Grenoble, France). The cell concentration was adjusted to 6×10⁵/ml and cytospins were prepared using a Cellspin I Tharmac. The cells were then stained for PAR2 as described below.
Functional studies
PBMCs were prepared at 2×10⁶/ml in complete medium (RPMI/glutamine/penicillin/streptomycin/50 μM β mercaptoethanol/ 10% FBS) and cultured in the presence or absence of the selective PAR2-activating peptide SLIGKV-NH2 or the reverse sequence peptide VKGILS-NH2 (both 100 μM) in a final volume of 200 μl. Incubations with lipopolysaccharide (Sigma, 100 ng/ml) were included as controls. Cells were cultured for 24 h at 37°C/5% CO2 and supernatants collected thereafter. As PBMCs from healthy subjects generate interleukin 6 (IL-6) in response to PAR2 activation,7 the concentration of this cytokine in the culture supernatant was determined by ELISA (Invitrogen, UK) according to the manufacturer’s instructions.
Flow cytometry
For surface staining, mononuclear cells were washed in FACS buffer (PBS/2% FBS/1% human plasma) and the cells were incubated in FcR blocking reagent (polyclonal human IgG-Sigma, I-4506) for 10 min at 4°C to prevent non-specific binding of antibodies to cells via Fc regions. The mononuclear cells were then incubated with PE-conjugated antihuman CD14 (eBioscience, Hatfield, UK), APC-conjugated antihuman CD3 (BD Pharmingen, Oxford, UK), PerCP-conjugated antihuman CD16 (eBioscience) and fluorescein isothiocyanate (FITC)-conjugated anti-PAR2 (SAM11, sc-13504 FITC, Santa Cruz, California, USA) for 30 min at 4°C. The cells were washed in FACS buffer and filtered through Nitex mesh before resuspension in FACS flow (BD PharMingen). The cells were analysed using a FACSCalibur (BD) and FlowJo software (Tree Star Inc, Oregon, USA). Following subtraction of the control isotype antibody (IgG2a) value, these data are expressed as the percentage of cells showing surface expression of PAR2 which correlated with mean fluorescence intensity for both CD14+ (r=0.67, p<0.0001) and CD3+ cells (r=0.86, p<0.0001).
Derivitisation of FITC-labelled SAM11
Azide-free SAM-11 (concentration range 1–4 mg/ml) was prepared and FITC covalently conjugated via primary amines, the conjugation efficiency being >95%. The absorbance of the conjugated sample was read at 280 nm and 494 nm and the fluorochrome to antibody ratio was estimated at 4–7:1.
Antibody specificity
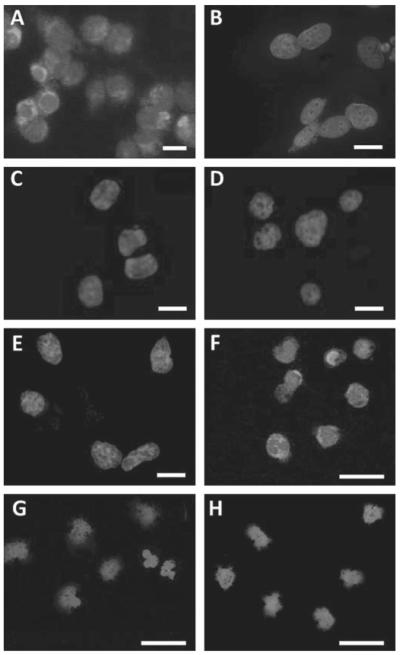
The specificity and selectivity of FITC-labelled SAM11 was assessed on clone G cells (NCTC2544 human keratinocytes transfected with hPAR2).11 These cells clearly expressed cytoplasmic PAR2 (figure 1A) whereas non-transfected NCTC2544 cells were negative (figure 1B). Furthermore, SAM11 preabsorbed with its immunising peptide SLIGKVDGTSHVTG (200-fold excess overnight at 4°C) did not detect PAR2 in clone G cells (figure 1C), which were also negative when incubated with isotype control antibody (FITC-labelled IgG2a; figure 1D). In addition, NCTC2544 cells which express PAR4 (11) were negative when incubated with FITC-labelled SAM11 (figure 1E). Cytoplasmic PAR2 was also observed in peripheral blood monocytes from a patient with RA using FITC-labelled SAM11 (figure 1F), but not in cells from a healthy control subject (figure 1G) nor in a patient with OA (figure 1H . In all experiments the cells were mounted using Vectashield mounting medium with 4′,6-diamidino-2-phenylindole (H-1200, Vector Laboratories, Peterborough, UK) allowing identification of nuclei.
Figure 1.
(A) NCTC2544 cells stably expressing proteinase-activated receptor 2 (PAR2) (clone G) incubated with FITC-labelled SAM11 showed cytoplasmic staining whereas native NCTC2544 cells did not. (B) Clone G cells showed no staining if SAM11 was preabsorbed with its immunising peptide (C) or if incubated with FITC-labelled IgG2a isotype control antibody (D). PAR4-expressing NCTC2544 cells also did not stain when incubated with FITC-labelled SAM11 (E). CD14+ cells from a patient with rheumatoid arthritis (RA) during a fl are (55% surface PAR2 expression) incubated with FITC-labelled SAM11 showed cytoplasmic staining (F) whereas these cells from a healthy control (G) and a patient with osteoarthritis (OA) (H) did not. Nuclei stained blue with 4′,6-diamidino-2-phenylindole. Scale bar=20 μm.
Statistical analysis
For non-normally distributed data the median was used as a measure of central tendency with variability expressed as the 1st and 3rd quartiles, these values being placed in parentheses in the text. Comparisons were undertaken by the Mann–Whitney rank sum test. Parametric data were expressed as mean ±SE of the mean with comparisons by ANOVA using SigmaStat (SPSS Inc, California, USA). Owing to substantial variation in CRP and ESR values between patients, these were dichotomised and compared with PAR2 surface expression calculated as the biserial correlation coefficient (rb). The cut-off points were based on standard normal values of <10 mg/l for CRP and <10 and <15 mm/h for ESR in men and women, respectively. Similarly, for the group with early RA the change in 28-joint Disease Activity Scale (DAS28) scores following treatment were dichotomised (cut-off value >1.2) and compared with PAR2 surface expression by biserial correlation coefficient.
RESULTS
PAR2 expression on CD14+ cells
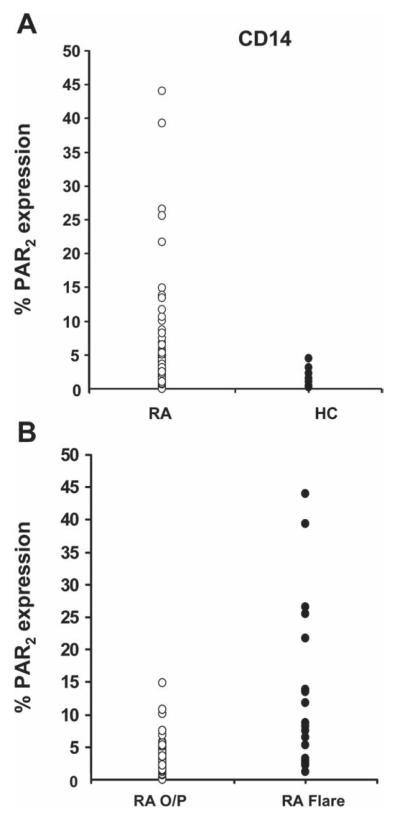
Consistent with previous investigations,7,8 the surface expression of PAR2 was low in healthy controls both in the median percentage of cells showing expression (0.06%; 0.03–0.81%) and the mean fluorescence intensity (0.00; −0.05–0.5). PAR2 expression in the patients with RA taken together (n=94) varied substantially with a median of 1.76% (0.86–4.10%), but differed significantly (p<0.0001) from the control group (figure 2A), as did mean fluorescence intensity values (0.40; 0.22–0.70; p<0.01). Analysis of the RA group revealed that patients admitted in a flare showed significantly (p<0.0001) higher surface expression of PAR2 (7.9%; 2.6–19.0%) than those seen at the routine outpatient clinic (1.41%; 0.65– 2.34%), as shown in figure 2B.
Figure 2.
(A) Dot plots comparing surface expression of proteinase-activated receptor 2 (PAR2) in CD14+ cells in patients with rheumatoid arthritis (RA, n=94) and healthy control subjects (HC, n=15). Mann–Whitney rank sum test showed a significant difference (p<0.0001) between the two groups. (B) Surface expression of PAR2 in CD14 cells in patients with RA attending outpatients (RA O/P, n=75) compared with those admitted to the ward during a flare (RA Flare, n=19). Rank sum test showed a highly significant difference (p<0.0001) between these two groups. Median values and IQR given in text.
PAR2 expression on CD3+ cells
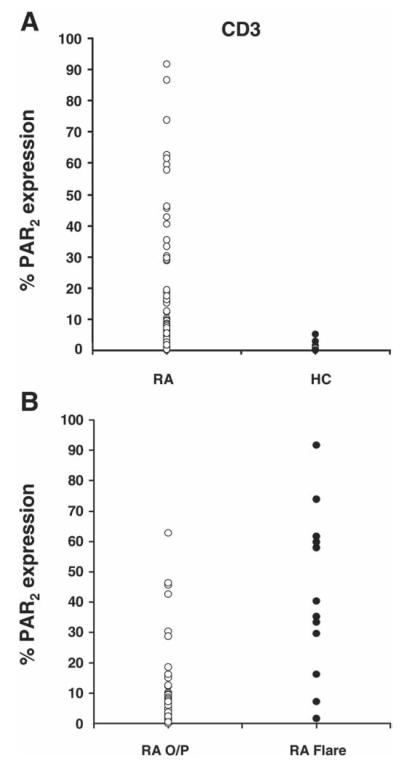
CD3+ cells expressed minimal surface PAR2 in control subjects (0.08%; 0.02–0.28%) whereas patients with RA showed varied expression (3.05%; 0.36–11.82%) that differed significantly from the control group (p<0.0001; figure 3A). Patients with RA flare again showed higher surface PAR2 expression (29.7%; 16.3–59.2%) than the outpatient group (2.0%; 0.32–6.60%), the difference being significant (p<0.0001; figure 3B). Comparisons between these groups using mean fluorescence intensity values similarly yielded significant differences.
Figure 3.
(A) Dot plots comparing surface expression of proteinase-activated receptor 2 (PAR2) in CD3+ cells in patients with rheumatoid arthritis (RA, n=94) and healthy control subjects (HC, n=15). Rank sum test showed a significant difference (p<0.01) between the two groups. (B) Dot plots comparing surface expression of PAR2 in CD3 cells in patients with RA attending outpatients (RA O/P) compared with those admitted to the ward during a flare (RA Flare). Rank sum test showed a highly significant difference (p<0.00001) between these two groups. Median values and IQR given in text.
PAR2 surface expression on CD3+ and CD14+ cells in patients with RA was significantly correlated (r=0.5, p<0.0001). Moreover, PAR2 surface expression levels and intensity was similar in CD3+ and CD14+ cells (p=0.72). The increase in cell surface PAR2 expression on PBMCs of patients with RA admitted during a clinical flare suggested a relationship with RA disease activity. To formally test this, correlations between PAR2 expression and ESR and CRP were explored. In CD14+ cells, PAR2 expression correlated significantly with CRP (rb=0.4, p<0.005) and ESR (rb=0.4, p<0.005). For CD3+ cells, PAR2 expression also correlated with CRP (rb=0.35, p=0.01) and ESR (rb=0.44, p=0.001).
PAR2 surface expression in the cohort of six patients with OA was compared with a subset of six gender-matched healthy individuals (median age 53.5 years, range 42–62). No significant difference in surface PAR2 expression was observed for CD14+ cells (2.61%; 1.36–5.73% and 1.17%; 1.02–1.47%, respectively) or CD3+ cells (0.46%; 0.24–3.78% and 0.22%; 0.10–0.76%, respectively). However, PAR2 expression was significantly lower in patients with OA than in those with RA (p<0.02).
Early RA cohort
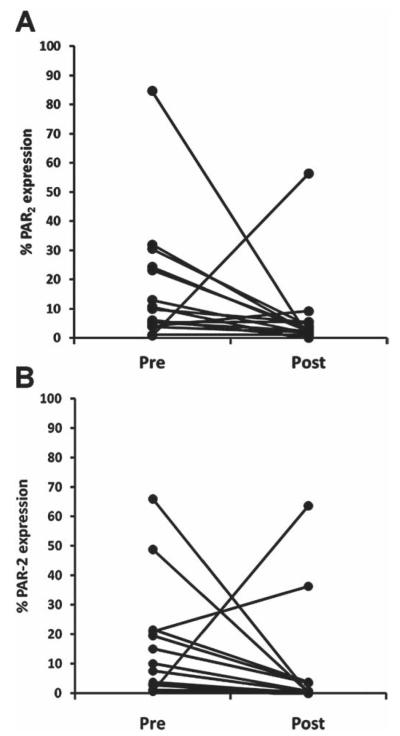
To further characterise the temporal pattern of PAR2 expression, blood samples were taken from a group of patients newly diagnosed with RA but before initiation of DMARD treatment and then 3 months subsequently. The DMARDs used were either methotrexate (14 patients) or sulfasalazine (4 patients). In addition to PAR2 surface expression, CD16 was also determined at both time points. While PAR2 expression for both CD14+ and CD3+ cells was also significantly elevated in this cohort (p<0.0001 for both), the levels were highly variable between patients. Accordingly, to test the hypothesis that initiation of treatment in DMARD-naïve patients would reduce upregulated PAR2 expression, analysis was restricted to patients with initial PAR2 levels above the mean of healthy controls. PAR2 expression on CD14+ cells declined significantly with treatment (figure 4A) from 9.9% (4.7–23.7%) to 2.2% (1.4–4.9%) (p=0.011, Mann–Whitney test, n=15). Similarly, PAR2 expression on CD3+ cells decreased significantly from 8.8% (2.9– 20.6%) to 0.6% (0.2–3.5%) following treatment (p=0.008, n=14; figure 4B). The decline in PAR2 expression correlated significantly with the reduction in DAS28 scores for both CD14+ (rb=0.72, p=0.029) and CD3+ cells (rb=0.75, p=0.027). Although a subpopulation of CD14+ cells expressed CD16 on initial presentation (21.1%; 13.8–38.5%, n=18), this was not significantly reduced following DMARD treatment (24.9%; 9.2–35.9%; p=0.98). Contrary to the general trend for PAR2 expression to decrease with treatment, in two patients it increased in both CD14+ and CD3+ cells. Of these two patients, one was a non-responder while the other did show improvement in DAS28.
Figure 4.
Change in proteinase-activated receptor 2 (PAR2) surface expression on peripheral blood mononuclear cells in patients with early rheumatoid arthritis (RA) but prior to treatment (pre) and 3 months after treatment with disease-modifying antirheumatic drugs (post). For both CD14 (A) and CD3 (B) cells, PAR2 expression decreased significantly (p=0.01, Mann–Whitney, n=15 and 14, respectively) following treatment.
Functional response to PAR2 activation
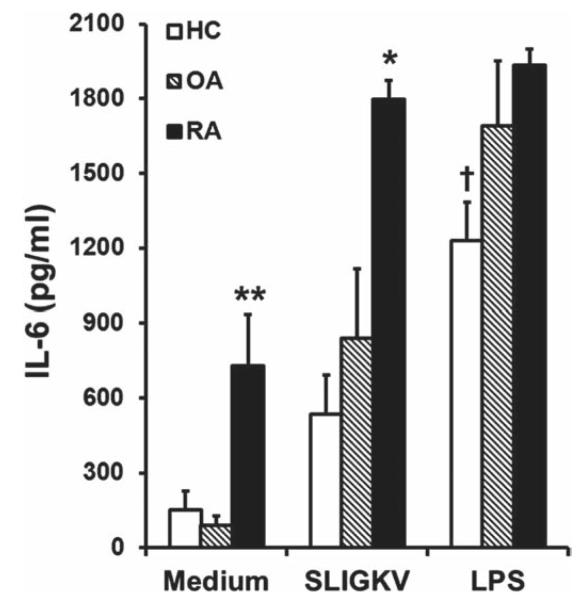
PAR2 activation of PBMCs with SLIGKV-NH2 stimulated release of IL-6 in RA, OA and control groups (figure 5). Basal levels of IL-6 in supernatants were notably higher in the RA group than in the OA and HC groups (p<0.002), and they also generated significantly more IL-6 on activation of PAR2 than the other groups (p<0.05). Interestingly, in patients with RA, this stimulus generated maximal IL-6 generation relative to lipopolysaccharide (positive control) but not in the OA or control groups. The enhanced IL-6 generated by SLIGKV-NH2 was specific as the response across the subjects to reverse peptide did not differ significantly from medium alone (p=0.71). In both the OA and control groups, PAR2 expression did not correlate significantly with either basal or SLIGKV-NH2-induced IL-6 concentration. However, in the RA group, CD14+ cell PAR2 expression correlated with the basal IL-6 concentration (r=0.73, p=0.039) whereas expression in CD3+ cells correlated with the SLIGKV-NH2-induced IL-6 concentration (r=0.9, p=0.0025).
Figure 5.
Interleukin 6 (IL-6) concentration in supernatants of peripheral blood mononuclear cell cultures 24 h after incubation with medium, the proteinase-activated receptor 2 (PAR2) activating peptide SLIGKV-NH2 (100 μM) or lipopolysaccharide (LPS, 100 nM) in rheumatoid arthritis (RA, n=8), osteoarthritis (OA, n=6) or control (HC, n=6) groups. The basal concentration of IL-6 was substantially higher in the RA group compared with both the OA and HC groups (**p<0.002, one-way ANOVA). Patients with RA also generated significantly more IL-6 in response to SLIGKV-NH2 compared with both OA and HC groups (*p<0.05). Control subjects had a smaller response to LPS than the RA and OA groups (†p<0.05).
DISCUSSION
This study shows for the first time that circulating leucocyte subsets from patients with RA have significantly higher PAR2 expression than those detected in patients with OA or healthy controls. There was considerable variation in the values observed within patients with RA, but the factors responsible for this are unclear. We therefore sought a relationship with disease activity as in general we found higher levels in inpatient than in outpatient samples, and PAR2 expression correlated significantly with CRP and ESR. This suggests that PAR2 is associated with general pathological disease activity mechanisms, which is further supported by the observation of a decline in its expression on both CD3+ and CD14+ cells following treatment in the early RA cohort and correlation with a reduction in the DAS28 score. Previous work has shown that neutrophils from patients in septic shock have increased PAR2 cell surface expression compared with healthy controls.13 Similarly, RA is increasingly recognised to comprise a systemic syndrome associated with elevated levels of circulating cytokines (eg, TNF, IL-6). Microarray experiments suggest that circulating RA monocytes are not ‘normal’.14 Our data suggest that membrane PAR2 is upregulated as part of this systemic response. This has important implications for the likely kinetics whereby PAR2-mediated monocyte activation can influence cell differentiation and the subsequent contribution to inflammation. There is some evidence that the predominant TNF expression in synovial macrophages occurs in cells that retain CD14 expression15 and therefore represent recently recruited monocyte/macrophages. We speculate that PAR2 expression preexists on monocytes destined for recruitment, thereby allowing the monocyte rapidly to sense the proteinase-rich environment (eg, tryptase, chymotryptase) of the articular compartment and respond accordingly. Future studies will be important to define the chemokine receptor and integrin adhesion molecule decoration of the PAR2+ subpopulation of circulating monocytes to confirm this hypothesis. Similar arguments apply to the observation that T cells can upregulate PAR2 in response to stimulation with PMA/ionomycin (unpublished observations). Ongoing studies will identify the subsets of T cells that are induced to express surface PAR2. Moreover, the functional significance of such expression for T cell activation and phenotypic differentiation remains unclear at this time.
The observation that leucocytes have substantial intracellular stores of PAR2 7 suggests that this system is ‘primed’ so that there are intracellular pools of PAR2 protein available to be recruited to the membrane once triggered. Factors which regulate the movement of PAR2 to the cell surface are still not well understood. Rab11a has been shown to promote trafficking of PAR2 from intracellular stores in the Golgi apparatus to the cell surface,16 although how this is achieved remains poorly understood. Better understood are the mechanisms underlying PAR2 internalisation and degradation.17,18 Although not all the links in the chain responsible for PAR2 upregulation on the cell surface are known, it has been shown that PAR2 is upregulated in human umbilical vein endothelial cells by various cytokines including TNFα19 and that interferon γ can increase its expression in neutrophils from healthy donors.12 Under these conditions, it is not unreasonable to speculate that elevated levels of plasma TNF in patients with RA20 could be responsible for the increased PAR2 expression on the surface of CD3+ and CD14+ cells observed in our study. This is consistent with levels of systemic inflammatory markers in patients with OA being within the normal range and our observation that the cohort we examined showed low PAR2 expression not significantly different from controls. From our data we cannot determine whether PAR2-expressing PBMCs migrate to or from the synovium. Emigration seems less likely as monocytes obtained from patients with OA showed little by way of surface PAR2 expression despite the recognition that OA can include synovitis,21 which correlates strongly with synovial PAR expression.22 This, coupled with our observation that PAR2 expression correlates with serum inflammatory markers in patients with RA, suggests that PAR2 may be indicative of systemic inflammation. However, PAR2 may also be elevated by other diseases as its expression on monocytes is more abundant in patients with primary antiphospholipid syndrome.23 This could explain why one patient in our early RA cohort showed increased PAR2 expression following treatment despite experiencing an improvement in DAS28—that is, there may have been an unrelated concomitant disease driving increased PAR2 expression.
Basal IL-6 levels in patients with RA were significantly higher than in the other cohorts, consistent with the known role of IL-6 in the pathogenesis of RA,24 its importance being reflected in the fact that IL-6 receptor is now a recognised therapeutic target.25 PAR2 activation has functional consequences manifest in IL-6 generation from PBMCs. Notably, SLIGKV-NH2 enhanced IL-6 secretion in patients with RA compared with patients with OA or healthy controls, suggesting an amplified response. This could be related to increased PAR2 expression, and is supported by the finding that this only correlates with IL-6 in RA PBMCs.
In summary, our data provide further compelling evidence for dysregulation of the PAR2 pathway in RA, providing a rational mechanism that integrates tissue matrix regulation, proteinase release and leucocyte activation status.
Acknowledgements
The authors thank Professor R Plevin for native NCTC2544, clone G and PAR4 expressing NCTC2544 cells and Ms R Steven for processing some of the samples.
Funding This work was supported by the Cunningham Trust, the Carnegie Trust and Arthritis Research UK (18306).
Footnotes
Competing interests None.
Ethics approval Informed consent was obtained from all subjects and the protocol was approved by the North Glasgow National Health Service Trust ethics committee.
Provenance and peer review Not commissioned; externally peer reviewed.
REFERENCES
- 1.Macfarlane SR, Seatter MJ, Kanke T, et al. Proteinase-activated receptors. Pharmacol Rev. 2001;53:245–82. [PubMed] [Google Scholar]
- 2.Shpacovitch V, Feld M, Hollenberg MD, et al. Role of protease-activated receptors in inflammatory responses, innate and adaptive immunity. J Leukoc Biol. 2008;83:1309–22. doi: 10.1189/jlb.0108001. [DOI] [PubMed] [Google Scholar]
- 3.Ferrell WR, Lockhart JC, Kelso EB, et al. Essential role for proteinase-activated receptor-2 in arthritis. J. Clin Invest. 2003;111:35–41. doi: 10.1172/JCI16913. [DOI] [PMC free article] [PubMed] [Google Scholar]
- 4.Shpacovitch VM, Brzoska T, Buddenkotte J, et al. Agonists of proteinase-activated receptor 2 induce cytokine release and activation of nuclear transcription factor kappaB in human dermal microvascular endothelial cells. J Invest Dermatol. 2002;118:380–5. doi: 10.1046/j.0022-202x.2001.01658.x. [DOI] [PubMed] [Google Scholar]
- 5.Kelso EB, Ferrell WR, Lockhart JC, et al. Expression and proinflammatory role of proteinase-activated receptor 2 in rheumatoid synovium: ex vivo studies using a novel proteinase-activated receptor 2 antagonist. Arthritis Rheum. 2007;56:765–71. doi: 10.1002/art.22423. [DOI] [PubMed] [Google Scholar]
- 6.Busso N, Frasnelli M, Feifel R, et al. Evaluation of protease-activated receptor 2 in murine models of arthritis. Arthritis Rheum. 2007;56:101–7. doi: 10.1002/art.22312. [DOI] [PubMed] [Google Scholar]
- 7.Johansson U, Lawson C, Dabare M, et al. Human peripheral blood monocytes express protease receptor-2 and respond to receptor activation by production of IL-6, IL-8, and IL-1{beta} J Leukoc Biol. 2005;78:967–75. doi: 10.1189/jlb.0704422. [DOI] [PubMed] [Google Scholar]
- 8.Colognato R, Slupsky JR, Jendrach M, et al. Differential expression and regulation of protease-activated receptors in human peripheral monocytes and monocyte-derived antigen-presenting cells. Blood. 2003;102:2645–52. doi: 10.1182/blood-2002-08-2497. [DOI] [PubMed] [Google Scholar]
- 9.Fields RC, Schoenecker JG, Hart JP, et al. Protease-activated receptor-2 signaling triggers dendritic cell development. Am J Pathol. 2003;162:1817–22. doi: 10.1016/S0002-9440(10)64316-7. [DOI] [PMC free article] [PubMed] [Google Scholar]
- 10.Bingham CO, 3rd, Pohl C, Woodworth TG, et al. Developing a standardized definition for disease “fl are” in rheumatoid arthritis (OMERACT 9 Special Interest Group) J Rheumatol. 2009;36:2335–41. doi: 10.3899/jrheum.090369. [DOI] [PubMed] [Google Scholar]
- 11.Kanke T, Macfarlane SR, Seatter MJ, et al. Proteinase-activated receptor-2-mediated activation of stress-activated protein kinases and inhibitory kappa B kinases in NCTC 2544 keratinocytes. J Biol Chem. 2001;276:31657–66. doi: 10.1074/jbc.M100377200. [DOI] [PubMed] [Google Scholar]
- 12.Goh FG, Ng PY, Nilsson M, et al. Dual effect of the novel peptide antagonist K-14585 on proteinase-activated receptor-2-mediated signalling. Br J Pharmacol. 2009;158:1695–704. doi: 10.1111/j.1476-5381.2009.00415.x. [DOI] [PMC free article] [PubMed] [Google Scholar]
- 13.Shpacovitch VM, Seeliger S, Huber-Lang M, et al. Agonists of proteinase-activated receptor-2 affect transendothelial migration and apoptosis of human neutrophils. Exp Dermatol. 2007;16:799–806. doi: 10.1111/j.1600-0625.2007.00605.x. [DOI] [PubMed] [Google Scholar]
- 14.Häupl T, Østensen M, Grützkau A, et al. Interaction between rheumatoid arthritis and pregnancy: correlation of molecular data with clinical disease activity measures. Rheumatology. 2008;47(Suppl 3):iii19–22. doi: 10.1093/rheumatology/ken157. [DOI] [PubMed] [Google Scholar]
- 15.Chu CQ, Field M, Feldmann M, et al. Localization of tumor necrosis factor alpha in synovial tissues and at the cartilage-pannus junction in patients with rheumatoid arthritis. Arthritis Rheum. 1991;34:1125–32. doi: 10.1002/art.1780340908. [DOI] [PubMed] [Google Scholar]
- 16.Roosterman D, Schmidlin F, Bunnett NW. Rab5a and rab11a mediate agonist-induced trafficking of protease-activated receptor 2. Am J Physiol Cell Physiol. 2003;284:C1319–29. doi: 10.1152/ajpcell.00540.2002. [DOI] [PubMed] [Google Scholar]
- 17.Déry O, Thoma MS, Wong H, et al. Trafficking of proteinase-activated receptor-2 and beta-arrestin-1 tagged with green fluorescent protein. beta-Arrestin-dependent endocytosis of a proteinase receptor. J Biol Chem. 1999;274:18524–35. doi: 10.1074/jbc.274.26.18524. [DOI] [PubMed] [Google Scholar]
- 18.Hasdemir B, Murphy JE, Cottrell GS, et al. Endosomal deubiquitinating enzymes control ubiquitination and down-regulation of protease-activated receptor 2. J Biol Chem. 2009;284:28453–66. doi: 10.1074/jbc.M109.025692. [DOI] [PMC free article] [PubMed] [Google Scholar]
- 19.Ritchie E, Saka M, Mackenzie C, et al. Cytokine upregulation of proteinase-activated-receptors 2 and 4 expression mediated by p38 MAP kinase and inhibitory kappa B kinase beta in human endothelial cells. Br J Pharmacol. 2007;150:1044–54. doi: 10.1038/sj.bjp.0707150. [DOI] [PMC free article] [PubMed] [Google Scholar]
- 20.Espersen GT, Vestergaard M, Ernst E, et al. Tumour necrosis factor alpha and interleukin-2 in plasma from rheumatoid arthritis patients in relation to disease activity. Clin Rheumatol. 1991;10:374–6. doi: 10.1007/BF02206655. [DOI] [PubMed] [Google Scholar]
- 21.Pelletier JP, Martel-Pelletier J, Abramson SB. Osteoarthritis, an inflammatory disease: potential implication for the selection of new therapeutic targets. Arthritis Rheum. 2001;44:1237–47. doi: 10.1002/1529-0131(200106)44:6<1237::AID-ART214>3.0.CO;2-F. [DOI] [PubMed] [Google Scholar]
- 22.Tindell AG, Kelso EB, Ferrell WR, et al. Correlation of protease-activated receptor-2 expression and synovitis in rheumatoid and osteoarthritis. Rheumatol Int. 2011 Sep 13; doi: 10.1007/s00296-011-2102-9. [Epub ahead of print] [DOI] [PubMed] [Google Scholar]
- 23.López-Pedrera C, Aguirre MA, Buendía P, et al. Differential expression of protease-activated receptors in monocytes from patients with primary antiphospholipid syndrome. Arthritis Rheum. 2010;62:869–77. doi: 10.1002/art.27299. [DOI] [PubMed] [Google Scholar]
- 24.Fonseca JE, Santos MJ, Canhão H, et al. Interleukin-6 as a key player in systemic inflammation and joint destruction. Autoimmun Rev. 2009;8:538–42. doi: 10.1016/j.autrev.2009.01.012. [DOI] [PubMed] [Google Scholar]
- 25.Emery P, Keystone E, Tony HP, et al. IL-6 receptor inhibition with tocilizumab improves treatment outcomes in patients with rheumatoid arthritis refractory to anti-tumour necrosis factor biologicals: results from a 24-week multicentre randomised placebo-controlled trial. Ann Rheum Dis. 2008;67:1516–23. doi: 10.1136/ard.2008.092932. [DOI] [PMC free article] [PubMed] [Google Scholar]


