Abstract
The specific autophagic elimination of mitochondria (mitophagy) plays the role of quality control for this organelle. Deregulation of mitophagy leads to an increased number of damaged mitochondria and triggers cell death. The deterioration of mitophagy has been hypothesized to underlie the pathogenesis of several neurodegenerative diseases, most notably Parkinson disease. Although some of the biochemical and molecular mechanisms of mitochondrial quality control are described in detail, physiological or pathological triggers of mitophagy are still not fully characterized. Here we show that the induction of mitophagy by the mitochondrial uncoupler FCCP is independent of the effect of mitochondrial membrane potential but dependent on acidification of the cytosol by FCCP. The ionophore nigericin also reduces cytosolic pH and induces PINK1/PARKIN-dependent and -independent mitophagy. The increase of intracellular pH with monensin suppresses the effects of FCCP and nigericin on mitochondrial degradation. Thus, a change in intracellular pH is a regulator of mitochondrial quality control.
Keywords: autophagy, lysosome, mitochondria, mitophagy, neurodegeneration, intracellular pH
Introduction
Continuous ATP production is essential for cell survival. Mitochondria are the major ATP producers in the cell; these are distributed throughout different tissues in varying amounts depending on energy demand. The number of mitochondria within cells is regulated by the balance between mitochondrial biogenesis (1) and the removal of damaged mitochondria. Furthermore, mitochondria also regulate cell death, which is triggered by release of intramitochondrial proteins (2). Considering this, the removal of dysfunctional mitochondria is an important process for ensuring cell survival.
Damaged mitochondria, as well as other impaired organelles and proteins in cells are degraded by specific autophagy. Mitochondrial autophagy (mitophagy)2 plays a role in the quality control of this organelle, whereas dysfunction in mitophagy can lead to an increase in the number of damaged mitochondria that can trigger the activation of cell death pathways (3, 4). Over the last several years, a number of studies have provided substantial evidence showing the PINK1-Parkin pathway (familial forms of Parkinson disease caused by mutations in the genes encoding the PTEN (phosphatase and tensin homolog)-induced putative kinase-1 (PINK1) and Parkin E3 ubiquitin ligase) promotes mitophagy. PINK1 accumulates at the outer mitochondrial membrane of depolarized mitochondria, which recruits cytoplasmic Parkin to the damaged organelle. This results in the ubiquitination of mitofusins (Mfns) by Parkin, the engulfment of the dysfunctional mitochondria by autophagosomes, and subsequent mitophagy (5–8). In recent years, abnormal autophagy and mitophagy has been shown for toxin-injured dopaminergic neurons as well as in all the major genetic models of Parkinson disease (PD), including α-synuclein, leucine-rich repeat kinase 2 (LRRK2), parkin, PTEN-induced kinase 1 (PINK1), and DJ-1 (9, 10). Historically, mitophagy research focuses on the biochemical and molecular mechanisms of PD; however, very little is known of the physiological triggers of mitophagy. Currently, the methods used to activate mitophagy involve the treatment of cells with a high (10 μm) concentration of the protonophore CCCP or FCCP (8, 11), which uncouples oxidative phosphorylation from ATP production. This observation forms the basis for mitochondrial depolarization as a hypothesis for mitophagy initiation. Here we report that low FCCP concentration (1 μm) induces a complete loss of mitochondrial membrane potential; however, it is unable to trigger mitophagy. This led us to investigate the effects of high (10 μm) FCCP concentration. Here we show that FCCP changes intracellular pH, which induces mitophagy. Importantly, other physiological processes that induce mitophagy, such as hypoxia and starvation, also induce mild acidification of the cytosol (12–16). Changes in intracellular pH activates autophagy (17, 18).
To investigate the effect of the cytosolic changes on mitophagy we investigated the effect of FCCP and nigericin on pHcyt and how these changes promote the mitochondrial translocation to lysosomes. We found that acidification of cytosol caused by nigericin can trigger autophagy and mitophagy.
Experimental Procedures
Cell Culture
Stably overexpressing FLAG-Parkin SH-SY5Y neuroblastoma cells (kind gift from H. Ardley, Leeds Institute of Molecular Medicine, Ref. 19) were cultured in Dulbecco's modified Eagle's medium (DMEM) containing 25 mm glucose and supplemented with 10% heat-inactivated fetal bovine serum (FBS) in a humidified chamber at 37 °C with 5% CO2. For immunocytochemistry experiments, cells were plated onto glass coverslips. Cells were treated with the specified compound before harvesting the protein used for SDS-PAGE and Western blotting or immunocytochemistry.
Measurements of pHcyt
Cells were loaded for 30 min at room temperature with either 5 μm 5-(and-6)-carboxyl SNARF-1 AM or BCECF AM (Molecular Probes) and 0.005% pluronic acid in a Hank's Balanced Salt Solution (HBSS) composed of (mm): 156 NaCl, 3 KCl, 1 MgSO4, 1.25 KH2PO4, 2 CaCl2, 10 glucose, and 10 HEPES; pH adjusted to 7.35 with NaOH.
Measurement of Mitochondrial Membrane Potential (ΔΨm)
Cells were loaded with rhodamine123 (Rh123; 1 μg/ml; Molecular Probes) for 15 min. After loading, cells were washed five times prior to the experiment. Under these loading conditions, Rh123 is non-toxic and gives a reliable and reproducible measure of ΔΨm through the dequenching of mitochondrial fluorescence. Rh123 was used in the dequench mode to measure ΔΨm, and thus an increase in the Rh123 signal reflects mitochondrial depolarization.
For identification of mitochondrial and lysosomal localization, cells were loaded with 200 nm MitoTracker Green FM and 50 nm LysoTracker Red in HBSS for 30 min before experiment (including the treatment of cells with FCCP or nigericin).
Immunoblotting and Immunocytochemistry
Where indicated, cell lysates were fractionated to generate mitochondrial-enriched fractions by centrifugation (see below) and prepared for SDS-PAGE and Western blotting (20). Alternatively, cells were fixed for immunocytochemistry in a 4% PFA PBS solution for 10 min at room temperature (16). Antibodies used were: anti-Pink1 (Novus Biologicals BC100–494 1:1000), mouse anti-FLAG (Sigma F3165, 1:2,000), rabbit anti-FLAG (Sigma F7425, 1:5,000), anti-complex Vβ subunit (Abcam ab14730, 1:500), anti-Mfn1 (Abcam ab57602, 1:1,000 for WB), anti-Complex Vα (1:5,000, Abcam ab14730), HtrA2 (Cell Signaling, 1:4000) anti-LC3 (Novus NB100–2220). The appropriate HRP-conjugated (A0545 Sigma Anti-Rabbit IgG, A9044 Sigma Anti-Mouse IgG), and fluorescent (AlexaFluor 488 and 568 secondary antibodies from Invitrogen, 1:2000) secondary antibodies were used for detection of primary antibodies.
Confocal images were taken using a Zeiss 710 vis CLSM equipped with a META detection system and a 63× oil immersion objective, and analyzed using Volocity image analysis software (PerkinElmer).
Mitochondrial-enriched Fractions by Centrifugation
Post-culture cell treatment, growth medium was removed, and the cells were washed with ice-cold PBS. Fractionation buffer (10 mm Tris HCl, pH 7.4, 1 mm sodium EDTA, 250 mm sucrose) was added to the cells, then frozen at −80 °C overnight. The following morning, cell lysates were thawed on ice and scraped into 1.7 ml Eppendorf tubes, triturated ×10 using a standard pipette until the sample was homogeneous, then frozen for a 2nd time at −80 °C for 1 h. After thawing on ice, the samples were centrifuged at 1500 × g for 20 min to remove cell debris and unbroken cells. The supernatant was then centrifuged at 12,500 × g for 20 min to collect the mitochondrial-enriched pellet. The cytoplasmic fraction is retained while the mitochondrial-enriched pellet is then washed two times in fractionation buffer (12,500 × g, 10 min centrifugation steps) to remove cytoplasmic contaminants. The mitochondrial-enriched pellet is then reduced using LDS sample buffer (10 mm DTT), sonicated, and heated to 70 °C for 10 min prior to SDS-PAGE and Western blotting.
Whole Cell Lysate Preparation
Post treatments, a lysis buffer containing 50 mm Tris, 0.1 mm EGTA, 1 mm EDTA, 0.27 m sucrose, 1% Triton-X with protease and phosphatase inhibitors was used to generate protein lysates.
Fluorescence Measurements
Fluorescence measurements were obtained with an epifluorescence inverted microscope equipped with a 20× fluorite objective. BCECF was monitored in single cells using excitation light provided by a Xenon arc lamp, the beam passing through a monochromator centered sequentially at 440 and 490 nm (Cairn Research, Kent, UK). Emitted fluorescence light was reflected through a 515 nm long-pass filter to a cooled CCD camera (Retiga, QImaging, Canada). All imaging data were collected and analyzed using software from Andor (Belfast, UK). When [pH]c was measured with SNARF-1, a Leica TCS SP5 confocal system was used. SNARF fluorescence was excited at 514 nm with argon laser light. Fluorescence was collected at 550–600 and 650–700 nm for ratiometric [pH]c measurement every 10 s in the experiment. The SNARF-1 signal was calibrated according to the manufacturer's instructions.
Confocal images were obtained using Zeiss 710 or Leica TCS SP5 confocal microscopes both equipped with 40× oil immersion objectives. The 488-nm argon laser line was used to excite MitoTracker Green fluorescence, which was measured between 505 and 530 nm. Illumination intensity was kept to a minimum (about 1% of laser output) to avoid phototoxicity and the pinhole set to give an optical slice of ∼2 μm. For LysoTracker Ted, the 543-nm Ne/He laser line was used with measurements above 650 nm. All data presented were obtained from at least 5 coverslips and 2–3 different cell preparations.
Statistical Analysis
Statistical analysis and exponential curve fitting were performed using Origin 8 (Microcal Software Inc., Northampton, MA) software. Results are expressed as means ± S.E. PRIZM was used for the Western blot data, and these results are expressed as means ± S.E., and the error bars are STD.
Results
High Concentrations of FCCP and Nigericin Reduce pHcyt
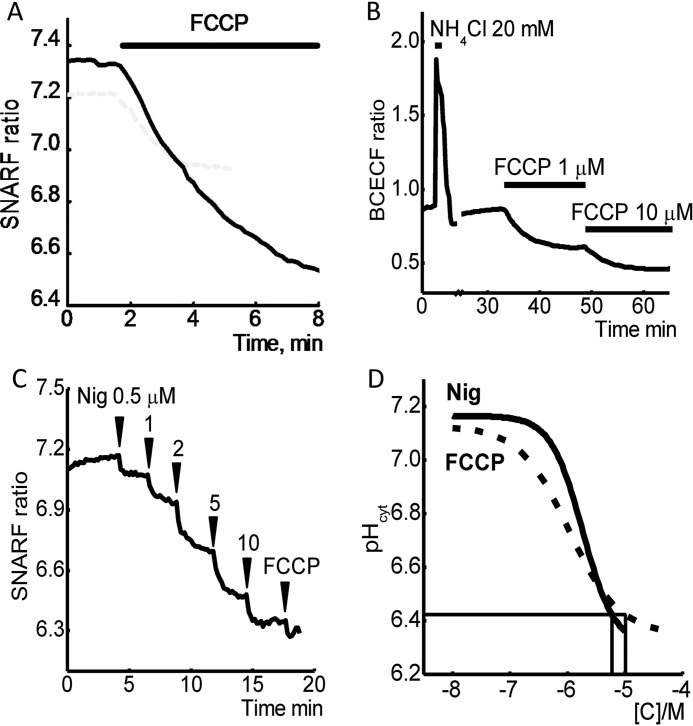
High dose CCCP or FCCP (10 μm) treatment of cells is the most common method for the activation of mitophagy. These treatments induce dissipation of mitochondrial membrane potential (ΔΨm), and this effect is believed to be important for the initiation of PINK1 accumulation and the recruitment of Parkin for triggering mitophagy. Mitochondrial depolarization leads to disruption of energy metabolism that also could stimulate mitophagy (5). Conversely, much smaller concentrations of uncoupler (0.5–1 μm) can induce complete loss of ΔΨm in the cells, and yet are unable to trigger mitophagy. The treatment of cells with protonophores CCCP and FCCP can also change intracellular pH because of their effect on H+ transport across the membrane, Ca2+ transport, and ATP hydrolysis. Using SNARF-1 or BCECF as a fluorescent pH indicators, we found that the application of 10 μm FCCP induced profound acidification of the cytosol of SH-SY5Y cells (Fig. 1, A and B).
FIGURE 1.
Effect of FCCP and nigericin on [pH]c. FCCP induces a dose-dependent reduction in pH of SHSY5Y neuroblastoma cells (A and B). 10 μm FCCP induce a profound decrease of intracellular pH compared with 1 μm of this protonophore. C, changes in [pH]c of SH-SY5Y neuroblastoma cells in response to subsequent application of the different concentrations of nigericin and FCCP. D, dose-dependent curves of the effects of nigericin and FCCP on intracellular pH of SH-SY5Y neuroblastoma cells.
Importantly, smaller concentration of FCCP (1 μm) also had an effect on [pH]c (FCCP compared with NH4Cl for calibration of [pH]c, Fig. 1B). Calibration of the indicator shows that the treatment of cells with 1 μm FCCP reduced the intracellular pH by 0.24 ± 0.01; n = 3 experiments, which is significantly smaller than the effect of 10 μm FCCP (intracellular pH reduced by 0.86 ± 0.027; n = 4 experiments; Fig. 1, A and B).
We then sought to determine whether this drop in pH, induced by FCCP, was responsible for the activation of mitophagy. To study the effect of pH on mitophagy, we used the K+/H+ exchanger ionophore nigericin to reduce [pH]c and compared this to 10 μm FCCP (Fig. 1C). This compound is widely used for the calibration of intracellular pH changes, and here we compared effects of the nigericin and FCCP.
First, we studied the nigericin dose-dependent [pH]c changes and found that 3–10 μm nigericin significantly reduced cytosolic pH in SH-SY5Y cells. Importantly, a subsequent application of FCCP (10 μm) did not further change the [pH]c (Fig. 1C). The dose-dependent curve effect of these two compounds shows that 6 μm nigericin can induce comparable changes in [pH]c as 10 μm FCCP (Fig. 1D). We found long exposures of cells to 6 μm nigericin can be toxic to cells; therefore, we used 3 or 6 μm nigericin at various time points to study whether changes in [pH]c modulate mitophagy.
Nigericin Does Not Induce Profound Mitochondrial Depolarization
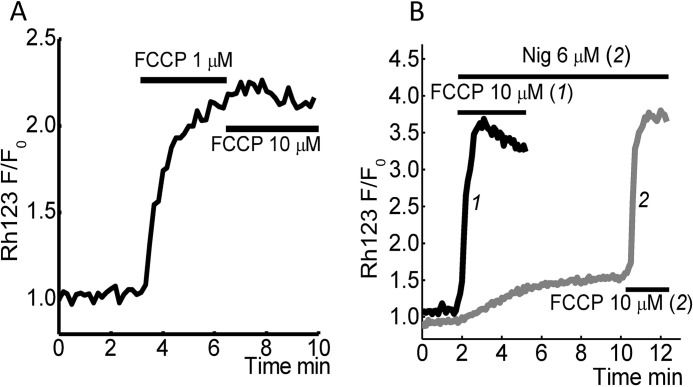
1 μm FCCP is enough to produce a complete loss of ΔΨm in neuroblastoma cell lines (n = 5 experiments; Fig. 2A). Subsequent application of 10 μm FCCP does not change the Rh123 fluorescence, suggesting the increase in FCCP concentration does not lead to a further decrease of ΔΨm.
FIGURE 2.
Effect of nigericin and different concentrations of FCCP on mitochondrial membrane potential. Changes in ΔΨm were measured using Rh123 in dequench mode; the loss of potential is seen as an increase in fluorescence. A, representing the maximal increase in Rh123 fluorescence in response to complete mitochondrial depolarization by 1 μm FCCP followed by application of 10 μm FCCP, which has no effect on Rh123 fluorescence. B, effect of 6 μm nigericin on ΔΨm SH-SY5Y cells (gray line) followed by complete mitochondrial depolarization by 10 μm FCCP.
Application of 6 μm nigericin induced small changes (∼15%, n = 5 experiments) of mitochondrial membrane potential, whereas application of 10 μm FCCP at the end of the experiment demonstrates complete depolarization (Fig. 2B). Thus, there is no significant difference in the effect of 1 μm compared with 10 μm FCCP on ΔΨm. Although 6 μm nigericin induces a similar response as 10 μm FCCP, with regard to pH changes, the effect of this ionophore on mitochondrial membrane potential was not significant.
The Sources of FCCP and Nigericin-induced pH Changes in Cytosol
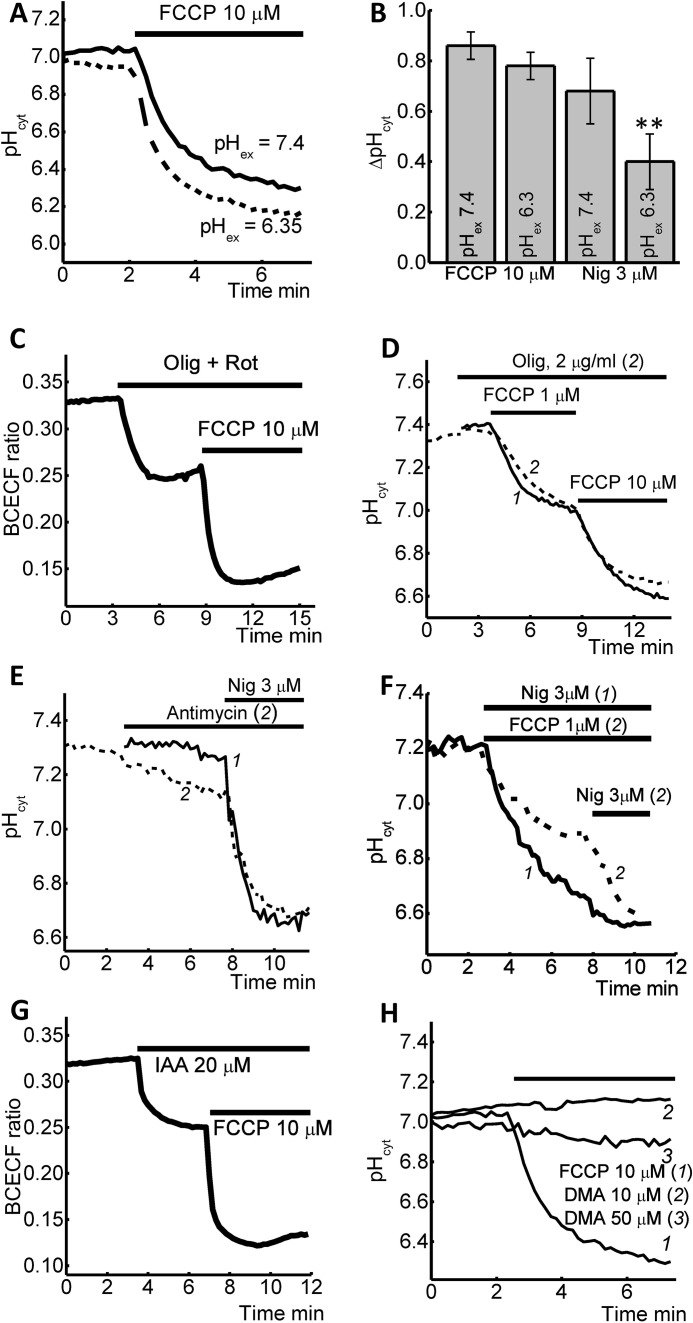
FCCP or CCCP are redistributing H+ between membranes that reduce [pH]c. Therefore, the effect of the FCCP on mitophagy may be due to acidification of the cytosol or by the changing of pH by redistribution of protons (and pH) in the intracellular organelles. To identify the source of protons for pH changes under application of FCCP, we changed pH in the recording solution (HBSS) from 7.4 to 6.35 (Fig. 3A). Interestingly, the change in extracellular pH did not significantly affect the FCCP-induced reduction of [pH]c (n = 5 experiments; Fig. 3, A and B) suggesting the source of cytosolic acidification may be from an intracellular source. In contrast to FCCP, the incubation of cells with 3 μm nigericin in the presence of reduced pH (6.35) in the medium induced a significant decrease in [pH]c (the effect reduced from 0.68 ± 0.13 to 0.4 ± 0.11 pH, n = 8 experiments; Fig. 3B) suggesting extracellular protons is the source of H+ ion during nigericin-induced acidification of cytosol.
FIGURE 3.
Sources of FCCP- and nigericin-induced acidification of cytosolic pH of SH-SY5Y cells. Reduction of extracellular pH (HBSS) from 7.4 to 6.35 did not change the effect of 10 μm FCCP (A) but reduces the effect of nigericin (B). Depolarization of mitochondrial membrane with 0.2 μg/ml oligomycine + 5 μm rotenone (C) but not oligomycine alone (D) had an effect on pH changes induced by 10 μm FCCP. 5 μm antimycin A (E) or 1 μm FCCP (F) decrease intracellular pH and reduce the effect of 3 μm nigericine. G, effect of 20 μm iodoacetic acid on action of 10 μm FCCP on [pH]c. H, inhibitor of Na+/H+ exchanger DMA had no effect on cytosolic pH in concentrations of 10 and 50 μm.
Depolarization of mitochondria with FCCP can also affect the [pH]c. Co-application of inhibitor of complex I rotenone (5 μm) and F1-F0-ATP synthase-oligomycin (2 μg/ml) induced profound depolarization of the mitochondrial membrane and acidification of the cytosol, which is less than the effect of 1 μm FCCP (Fig. 3C). However, subsequent application of 10 μm FCCP induced a further decrease in [pH]c suggesting that mitochondria had minor impact in FCCP-induced acidification in cytosol.
In mitochondria with a damaged electron transport chain or in the presence of uncoupler, F1-F0-ATP synthase is working in reverse mode (21) that also can have effect on pH. Incubation of the cells with inhibitor of F1-F0-ATP synthase-oligomycin (2 μg/ml) did not change the effects of 1 or 10 μm FCCP on cytosolic pH (n = 95, Fig. 3D).
Inhibition of mitochondrial respiration with antimycin A (5 μm, n = 46) reduced the pH in cytosol and decreased the effect of 3 μm nigericin (Fig. 3E). Complete depolarization of mitochondria with 1 μm FCCP reduced the effect of 3 μm nigericin on pHcyt in SH-SY5Y cells (Fig. 3F), suggesting that mitochondria contribute to nigericin-induced acidification of cytosol.
Uncoupling of oxidative phosphorylation with FCCP can trigger activation of glycolysis, which can also contribute to a change of [pH]c (22, 23). We found that the inhibition of glycolysis with 50 μm iodoacetic acid (IAA) decreases pHcyt but did not change the effect of 10 μm FCCP on intracellular pH (n = 5; Fig. 3G), suggesting that glycolysis is not a trigger of alkalization of cytosolic pH under application of 10 μm FCCP. Inhibitor of Na+/H+ exchanger dimethyl amylorid (DMA) had no effect on cytosolic pH in two concentrations: 10 and 50 μm (Fig. 3H).
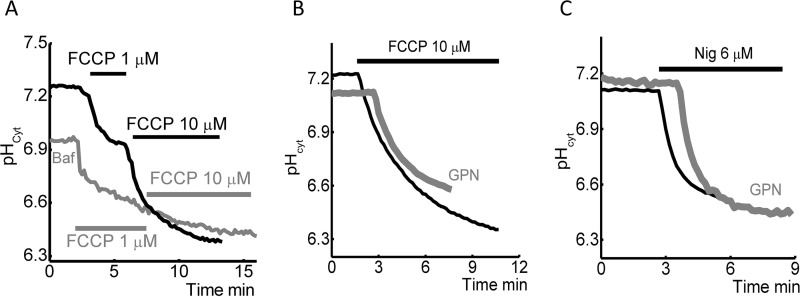
Within the cell lysosomes are a potential source of H+ (24); therefore, we assessed the possible contribution these organelles have on FCCP and nigericin-induced changes in [pH]c. To do this, SH-SY5Y cells were pretreated with 200 μm bafilomycin A (inhibitor of vacuolar type H+-ATPase) for 1 h, prior to the addition of FCCP or nigericin. Bafilomycin A significantly reduced the effect of FCCP (10 μm; Fig. 4A) on [pH]c; however, there was no effect on nigericin (6 μm, data not shown). In agreement with this, application of the glycyl-l-phenylalanine 2-naphthylamide (GPN), a cathepsin-C substrate (induces extensive rupture of lysosomes, Ref. 25), also significantly inhibits the ability of 10 μm FCCP (but not nigericin) to reduce [pH]c (Fig. 4, B and C). These data suggest the redistribution of the H+ between mitochondria, lysosomes, and cytosol is responsible for the 10 μm FCCP reduction of pHcyt, whereas the mechanism of nigericin reduction of pHcyt is predominantly dependent on the pH of extracellular medium.
FIGURE 4.
The role of lysosomes in FCCP and nigericin-induced acidification of cytosol in SH-SY5Y cells. A, pre-incubation of the cells with bafilomycin significantly reduce the effect of 10 μm FCCP. Note that application of 1 μm FCCP induces similar effects with control. Effect of GNP on FCCP (10 μm; B) or nigericin (3 μm; C)-induced pH changes in the cytosol of SH-SY5Y cells.
The pH-induced Mitophagy Is PINK1/PARKIN-independent after a 2-h Application
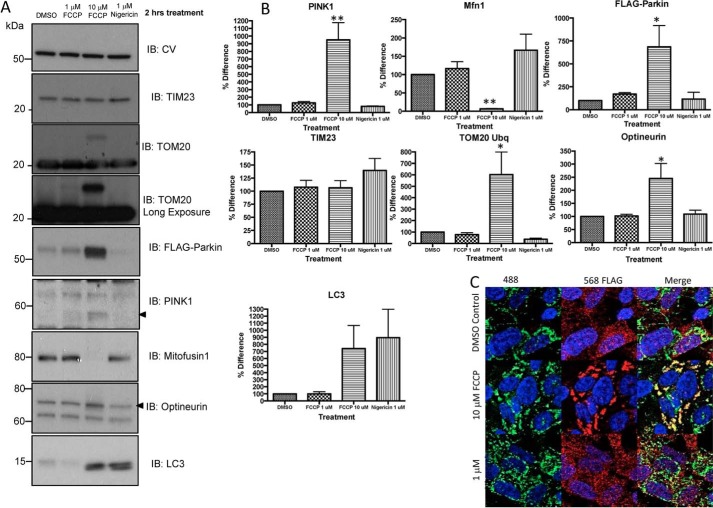
For estimation of the effect of acidification of cytosol on PINK1/PARKIN-dependent mitophagy, we treated FLAG-Parkin SH-SY5Y neuroblastoma cells with either 1 μm nigericin, 1 μm FCCP, 10 μm FCCP, or DMSO control for 2 h prior to cell lysate fractionation (mitochondria enrichment) and SDS-PAGE followed by Western blotting or immunocytochemistry.
We found that 10 μm FCCP induces PINK1 accumulation, FLAG-Parkin, and optineurin recruitment to the mitochondria, degradation of mitofusin 1, and increase in Tom20 ubiquination in enriched mitochondria fractions, signifying the induction of mitophagy (Fig. 5, A and B) and autophagosome formation because FCCP also induced accumulation of LC3-II in the mitochondrial-enriched fractions. Conversely, while nigericin induced LC3-II recruitment to the mitochondrial-enriched fractions, this was independent of PINK1 accumulation and FLAG-Parkin recruitment.
FIGURE 5.
Nigericin activates autophagy independent of canonical PINK1/Parkin pathway. FLAG-Parkin SH-SY5Y neuroblastoma cells were treated with either 1 μm nigericin, 1 or 10 μm FCCP, or DMSO control for 2 h prior to cell lysate fractionation (mitochondria enrichment) and SDS-PAGE and Western blotting (A, see summary in B) or immunocytochemistry (C). The same protein loading was used for each lane in Western blots. A, mitochondrial-enriched fractions were separated on SDS-PAGE gels and Western blotted for mitochondria (CV, TOM20, COXII, TIM23), and mitophagy pathway (PINK1, FLAG-Parkin, optineurin, and mitofusin). Representative Western blots from n = 3 independent experiments. Significance was determined using ANOVA (Dunnetts Multiple comparisons) *, p = 0.05; **, p = 0.01 with CV is used as a loading control. C, immunocytochemistry images show a diffuse Parkin (anti-FLAG, red) pattern and a network of mitochondria (anti-HtrA2, green) in control cells. Upon incubation of 10 μm FCCP, Parkin (FLAG) is recruited to mitochondria (HtrA2), indicated by yellow co-localization, which disrupts mitochondrial networks. This process is absent in nigericin-treated cells.
Immunocytochemistry images also confirm that in contrast to 10 μm FCCP, incubation of the cells with 1 μm nigericin did not induce Parkin (FLAG) recruitment to mitochondria (HtrA2) but disrupted mitochondrial networks (Fig. 5C).
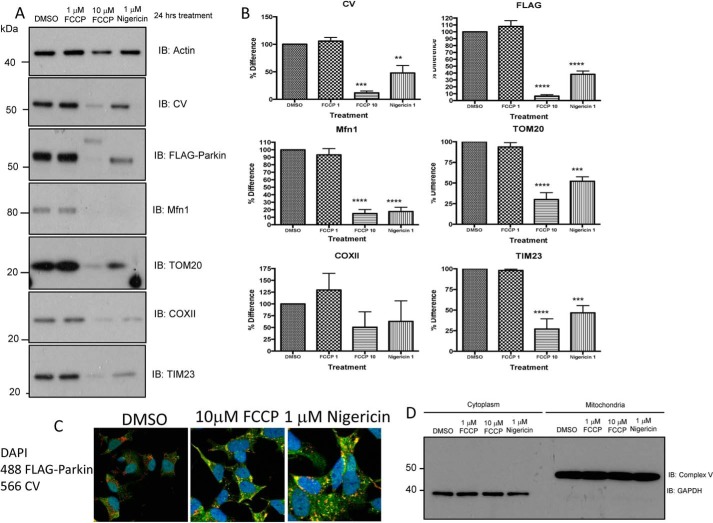
Thus, mitophagy triggered by short (2 h) pH changes is induced by alternatives to the PINK1/PARKIN pathway. A 24-h incubation of FLAG-Parkin SHSY5Y neuroblastoma cells with either 1 μm nigericin or 1 or 10 μm FCCP prior to cell lysate fractionation (mitochondria enrichment) induced degradation of mitochondrial proteins (CV, TOM20, COXII, TIM23; Fig. 6, A and B) for both 10 μm FCCP and 1 μm nigericin but not for 1 μm FCCP. 1 μm nigericin and 10 μm FCCP, but not 1 μm FCCP, had a similar effect on mitophagy proteins (FLAG-Parkin and mitofusin; Fig. 6, A and B) suggesting that prolonged acidification of the cytosol induces Parkin-dependent mitophagy.
FIGURE 6.
24-h treatment of cells induced similar effects of FCCP and nigericin on mitophagy. A and B, FLAG-Parkin SH-SY5Y neuroblastoma cells were treated with either 1 μm nigericin, 1 μm FCCP, 10 μm FCCP, or DMSO control for 24 h prior to protein extraction. Whole cell lysates were separated on SDS-PAGE gels and Western blotted for mitochondria (CV, TOM20, COXII, TIM23) and mitophagy pathway (FLAG-Parkin and mitofusin) markers, while actin is used as a loading control. The same protein loading was used for each lane in the Western blots. Representative Western blots from n = 3 independent experiments. Significance was determined using Anova (Dunnetts Multiple comparisons) **, p = 0.01. C, immunocytochemistry images show a diffuse Parkin (anti-FLAG, green) pattern and a network of mitochondria (anti-CV, red) in control cells. Upon incubation of 10 μm FCCP or 1 μm nigericin for 24 h, Parkin (FLAG) is recruited to mitochondria (CV) indicated by yellow co-localization. D, FLAG-Parkin SHSY5Y neuroblastoma cells were treated with either 1 μm nigericin, 1 μm, 10 μm FCCP, or DMSO control for 2 h prior to cell lysate fractionation (mitochondria enrichment) and SDS-PAGE. Fractionation efficiency was determined by Western blotting cytoplasmic and mitochondrial-enriched samples using CV (mitochondrial) and GAPDH (cytosolic).
Immunocytochemistry images also confirm that in contrast to short applications, 24-h acidification of the cells with 10 μm FCCP or 5 μm nigericin induced Parkin (FLAG) recruitment to mitochondria (CV) (Fig. 6C).
Intracellular Acidification Induces Mitophagy
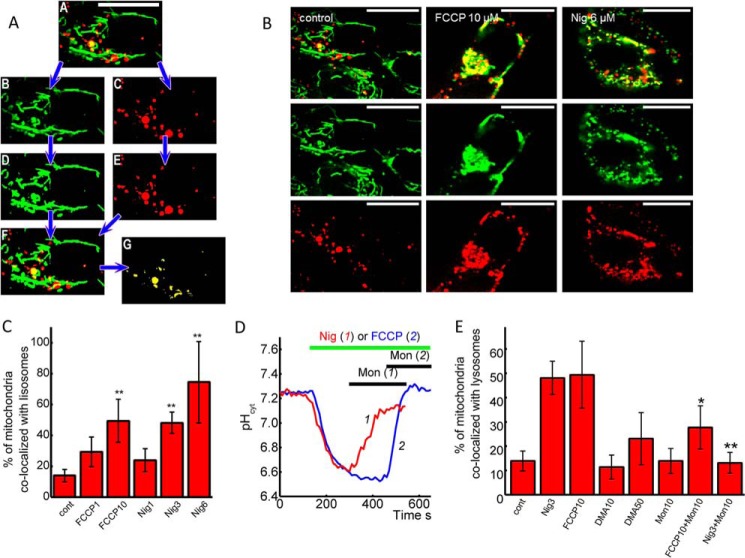
To identify the mitochondrial degradation independent of any specific pathway, we tracked the transport of mitochondria labeled with MitoTracker Green to lysosomes labeled with LysoTracker Red (Fig. 7A). The 30-min incubation of SH-SY5Y cells with 10 μm FCCP increased the percentage of mitochondria co-localization with lysosomes by 50 ± 4% (n = 10 experiments) compared to 1 μm FCCP, whose effect was insignificant (Fig. 7, B and C). Conversely 1 μm nigericin (n = 5 experiments) had a minimal effect on mitophagy, while 3 μm (n = 7 experiments) or 6 μm, (n = 10 experiments) increased co-localization of MitoTracker and LysoTracker to 48.7 ± 6.7% and 75 ± 2.4%, respectively (Fig. 7, D–C).
FIGURE 7.
pH-induced changes in co-localization of mitochondria and lysosomes. A, mitochondria to lysosomes colocalization. Double channel confocal image (A) was split into green (mitochondria, Ai) and red (lysosomes, Aii) channels using ImageJ software. Both 8-bit images were thresholded (Aiii, Aiv). Mitochondrial areas were calculated. Areas where mitochondria and lysosomes overlap (yellow) were identified (Av, Avi), and their area was calculated. B, images of experiments with a 2-h pretreatment of the SH-SY5Y neuroblastoma cells with 10 μm FCCP or 6 μm nigericin increase the number of mitochondria (MitoTracker Green, green) localized in lysosomes (LysoTracker red, red). The bar is 20 μm. C, percentage of mitochondria localized in lysosomes after 2 h of pretreatment with different concentrations of FCCP and nigericin. D, effect of monensin on FCCP and nigericin-induced acidification of cytosol of SH-SY5Y neuroblastoma cells. E, percentage of mitochondria localized in lysosomes pretreated with 3 μm nigericin or 10 μm FCCP for 30 min with or without subsequent treatment of the cells with 10 μm monensin. Monensin (10 μm) and 10 or 50 μm DMA were also tested without FCCP or nigericin.
Na+/H+ ionophore monensin A (10 μm) can successfully restore pH in cytosol after application of nigericin (3 μm, n = 4 experiments) or FCCP (10 μm, n = 3 experiments) (Fig. 7C). Recovery of pH in SHSY5Y cells by 10 μm monensin after a 3-min application of 10 μm FCCP or 3 μm nigericin was protective against nigericin-induced mitophagy by a much lower degree than its effect on FCCP-induced relocation of mitochondria to lysosomes (Fig. 7D). It also should be noted that the inhibitor of Na+/H+ exchanger DMA had no effect on co-localization of mitochondria and lysosomes (Fig. 7D). Thus, restoration of intracellular pH can be protective against pH-dependent mitophagy.
Discussion
Mitochondrial quality control involves a variety of cellular pathways regulating mitochondrial degradation, ensuring the functionality of these organelles during the lifetime of the cell. Several activators of mitophagy have been suggested (5, 26–28). Here we demonstrate the acidification of intracellular pH can also stimulate mitophagy; however this is independent from the canonical PINK1/Parkin pathway after short treatment.
Within this study, we show 1 μm FCCP causes complete depolarization of mitochondrial membrane, modest decreases in pHcyt, and almost no activation of PINK1/Parkin-dependent mitophagy. Conversely, 10 μm FCCP has a more profound effect on intracellular pH that also activates mitochondrial degradation. These data suggest complete mitochondrial depolarization is not a major trigger for mitophagy and that a change in [pH]c may contribute to this mechanism. Induction of mitophagy with the alternative compound nigericin, which induces significant acidification of cytosol but does not induce mitochondrial depolarization, suggesting that a decrease in pHcyt can be a stimulus for relocation of mitochondria to lysosomes. The role of carboxylic ionophores (including nigericin and monensin) in lysosomal protein degradation was shown previously, and interestingly monensin inhibited autophagy (29). Thus, monensin and nigericin produced opposite effects on pH and on autophagy and mitophagy that again, suggests the effect of intracellular pH on mitochondrial and protein degradation in lysosome acidification is to inhibit this process.
The source of cytosolic acidification is important for initiation and mechanism of mitophagy. FCCP induces an acidification of cytosol via the redistribution of H+ from mitochondria and lysosomes, while nigericin, does so from the extracellular medium, mitochondria, and a small contribution from lysosomes. As a result, 10 μm FCCP induces a PINK1/Parkin-dependent and independent mitophagy and nigericin induces translocation of mitochondria to lysosomes through PINK1 Parkin-dependent and independent mechanisms.
The inhibitory effects of monensin on nigericin and partially on FCCP-induced mitophagy is more likely to be due to the ability of this ionophore to increase pH that can quench effects of nigericin and FCCP on intracellular pH.
The activation of PINK1 Parkin-independent mitophagy by alkalization can be induced by activation of the LC3-related mechanism shown for AMBRA1 or ubiquitin kinase PINK1 (28, 30, 31).
Intracellular pH changes are typical for many processes, such as starvation (12) and ischemia (13), and importantly many of them are known to be activators of mitophagy (17).
Author Contributions
A. B., M. S., E. F., M. F. produced experiments. A. B., A. Y. A., H. P-F., V. P. Z. designed experiments. A. B., A. Y. A., V. P. Z., M. S., H. P-F. wrote the manuscript.
This work was supported by the Russian Foundation for Basic Research (Grant No. 14-04-31870) and The Leverhulme Trust (RPG-2012-447). The authors declare that they have no conflicts of interest with the contents of this article.
- mitophagy
- mitochondrial autophagy
- PINK
- PTEN (phosphatase and tensin homolog)-induced putative kinase
- Mfn
- mitofusin
- PD
- Parkinson disease
- DMA
- dimethyl amylorid.
References
- 1. Scarpulla R. C. (2011) Metabolic control of mitochondrial biogenesis through the PGC-1 family regulatory network. Biochim. Biophys. Acta 1813, 1269–1278 [DOI] [PMC free article] [PubMed] [Google Scholar]
- 2. Tait S. W., and Green D. R. (2010) Mitochondria and cell death: outer membrane permeabilization and beyond. Nat. Rev. Mol. Cell Biol. 11, 621–632 [DOI] [PubMed] [Google Scholar]
- 3. Green D. R., Galluzzi L., and Kroemer G. (2011) Mitochondria and the autophagy-inflammation-cell death axis in organismal aging. Science 333, 1109–1112 [DOI] [PMC free article] [PubMed] [Google Scholar]
- 4. Lemasters J. J. (2014) Variants of mitochondrial autophagy: Types 1 and 2 mitophagy and micromitophagy (Type 3). Redox Biol. 2, 749–754 [DOI] [PMC free article] [PubMed] [Google Scholar]
- 5. Ashrafi G., and Schwarz T. L. (2013) The pathways of mitophagy for quality control and clearance of mitochondria. Cell Death Differ. 20, 31–42 [DOI] [PMC free article] [PubMed] [Google Scholar]
- 6. Deas E., Wood N. W., and Plun-Favreau H. (2011) Mitophagy and Parkinson's disease: the PINK1-parkin link. Biochim. Biophys. Acta 1813, 623–633 [DOI] [PMC free article] [PubMed] [Google Scholar]
- 7. Kubli D. A., and Gustafsson Å. B. (2012) Mitochondria and mitophagy: the yin and yang of cell death control. Circulation Res. 111, 1208–1221 [DOI] [PMC free article] [PubMed] [Google Scholar]
- 8. Narendra D., Tanaka A., Suen D. F., and Youle R. J. (2008) Parkin is recruited selectively to impaired mitochondria and promotes their autophagy. J. Cell Biol. 183, 795–803 [DOI] [PMC free article] [PubMed] [Google Scholar]
- 9. Chu C. T. (2011) Diversity in the regulation of autophagy and mitophagy: lessons from Parkinson's disease. Parkinson's Disease 2011, 789431. [DOI] [PMC free article] [PubMed] [Google Scholar]
- 10. Cookson M. R. (2012) Parkinsonism due to mutations in PINK1, parkin, and DJ-1 and oxidative stress and mitochondrial pathways. Cold Spring Harbor Perspectives in Medicine 2, a009415. [DOI] [PMC free article] [PubMed] [Google Scholar]
- 11. Geisler S., Holmström K. M., Skujat D., Fiesel F. C., Rothfuss O. C., Kahle P. J., and Springer W. (2010) PINK1/Parkin-mediated mitophagy is dependent on VDAC1 and p62/SQSTM1. Nat. Cell Biol. 12, 119–131 [DOI] [PubMed] [Google Scholar]
- 12. Dechant R., Binda M., Lee S. S., Pelet öS., Winderickx J., and Peter M. (2010) Cytosolic pH is a second messenger for glucose and regulates the PKA pathway through V-ATPase. EMBO J. 29, 2515–2526 [DOI] [PMC free article] [PubMed] [Google Scholar]
- 13. Owens L. M., Fralix T. A., Murphy E., Cascio W. E., and Gettes L. S. (1996) Correlation of ischemia-induced extracellular and intracellular ion changes to cell-to-cell electrical uncoupling in isolated blood-perfused rabbit hearts. Circulation 94, 10–13 [DOI] [PubMed] [Google Scholar]
- 14. Bevensee M. O., and Boron W. F. (2008) Effects of acute hypoxia on intracellular-pH regulation in astrocytes cultured from rat hippocampus. Brain Res. 1193, 143–152 [DOI] [PMC free article] [PubMed] [Google Scholar]
- 15. Hartley Z., and Dubinsky J. M. (1993) Changes in intracellular pH associated with glutamate excitotoxicity. J. Neurosci. 13, 4690–4699 [DOI] [PMC free article] [PubMed] [Google Scholar]
- 16. Burchell V. S., Nelson D. E., Sanchez-Martinez A., Delgado-Camprubi M., Ivatt R. M., Pogson J. H., Randle S. J., Wray S., Lewis P. A., Houlden H., Abramov A. Y., Hardy J., Wood N. W., Whitworth A. J., Laman H., and Plun-Favreau H. (2013) The Parkinson's disease-linked proteins Fbxo7 and Parkin interact to mediate mitophagy. Nat. Neurosci. 16, 1257–1265 [DOI] [PMC free article] [PubMed] [Google Scholar]
- 17. Marino M. L., Pellegrini P., Di Lernia G., Djavaheri-Mergny M., Brnjic S., Zhang X., Hägg M., Linder S., Fais S., Codogno P., and De Milito A. (2012) Autophagy is a protective mechanism for human melanoma cells under acidic stress. J. Biol. Chem. 287, 30664–30676 [DOI] [PMC free article] [PubMed] [Google Scholar]
- 18. Togashi K., Wakatsuki S., Furuno A., Tokunaga S., Nagai Y., and Araki T. (2013) Na+/H+ exchangers induce autophagy in neurons and inhibit polyglutamine-induced aggregate formation. PloS one 8, e81313. [DOI] [PMC free article] [PubMed] [Google Scholar]
- 19. Ardley H. C., Scott G. B., Rose S. A., Tan N. G., Markham A. F., and Robinson P. A. (2003) Inhibition of proteasomal activity causes inclusion formation in neuronal and non-neuronal cells overexpressing Parkin. Mol. Biol. Cell 14, 4541–4556 [DOI] [PMC free article] [PubMed] [Google Scholar]
- 20. Plun-Favreau H., Klupsch K., Moisoi N., Gandhi S., Kjaer S., Frith D., Harvey K., Deas E., Harvey R. J., McDonald N., Wood N. W., Martins L. M., and Downward J. (2007) The mitochondrial protease HtrA2 is regulated by Parkinson's disease-associated kinase PINK1. Nat. Cell Biol. 9, 1243–1252 [DOI] [PubMed] [Google Scholar]
- 21. Yao Z., Gandhi S., Burchell V. S., Plun-Favreau H., Wood N. W., and Abramov A. Y. (2011) Cell metabolism affects selective vulnerability in PINK1-associated Parkinson's disease. J. Cell Science 124, 4194–4202 [DOI] [PMC free article] [PubMed] [Google Scholar]
- 22. Kockskämper J., Zima A. V., and Blatter L. A. (2005) Modulation of sarcoplasmic reticulum Ca2+ release by glycolysis in cat atrial myocytes. J. Physiol. 564, 697–714 [DOI] [PMC free article] [PubMed] [Google Scholar]
- 23. Ziegelstein R. C., Cheng L., Aversano T., Ouyang P., Lakatta E. G., and Silverman H. S. (1994) Increase in rat aortic endothelial free calcium mediated by metabolically sensitive calcium release from endoplasmic reticulum. Cardiovasc. Res. 28, 1433–1439 [DOI] [PubMed] [Google Scholar]
- 24. Appelqvist H., Wäster P., Kågedal K., and Öllinger K. (2013) The lysosome: from waste bag to potential therapeutic target. J. Mol. Cell Biol. 5, 214–226 [DOI] [PubMed] [Google Scholar]
- 25. Berg T. O., Strømhaug E., Løvdal T., Seglen O., and Berg T. (1994) Use of glycyl-l-phenylalanine 2-naphthylamide, a lysosome-disrupting cathepsin C substrate, to distinguish between lysosomes and prelysosomal endocytic vacuoles. Biochem. J. 300, 229–236 [DOI] [PMC free article] [PubMed] [Google Scholar]
- 26. Gegg M. E., Cooper J. M., Chau K. Y., Rojo M., Schapira A. H., and Taanman J. W. (2010) Mitofusin 1 and mitofusin 2 are ubiquitinated in a PINK1/parkin-dependent manner upon induction of mitophagy. Hum. Mol. Genet. 19, 4861–4870 [DOI] [PMC free article] [PubMed] [Google Scholar]
- 27. Frank M., Duvezin-Caubet S., Koob S., Occhipinti A., Jagasia R., Petcherski A., Ruonala M. O., Priault M., Salin B., and Reichert A. S. (2012) Mitophagy is triggered by mild oxidative stress in a mitochondrial fission dependent manner. Biochim. Biophys. Acta 1823, 2297–2310 [DOI] [PubMed] [Google Scholar]
- 28. Strappazzon F., Nazio F., Corrado M., Cianfanelli V., Romagnoli A., Fimia G. M., Campello S., Nardacci R., Piacentini M., Campanella M., and Cecconi F. (2015) AMBRA1 is able to induce mitophagy via LC3 binding, regardless of PARKIN and p62/SQSTM1. Cell Death Differ. 22, 419–432 [DOI] [PMC free article] [PubMed] [Google Scholar]
- 29. Grinde B. (1983) Effect of carboxylic ionophores on lysosomal protein degradation in rat hepatocytes. Exp. Cell Res. 149, 27–35 [DOI] [PubMed] [Google Scholar]
- 30. Lazarou M., Sliter D. A., Kane L. A., Sarraf S. A., Wang C., Burman J. L., Sideris D. P., Fogel A. I., and Youle R. J. (2015) The ubiquitin kinase PINK1 recruits autophagy receptors to induce mitophagy. Nature 524, 309–314 [DOI] [PMC free article] [PubMed] [Google Scholar]
- 31. Allen G. F., Toth R., James J., and Ganley I. G. (2013) Loss of iron triggers PINK1/Parkin-independent mitophagy. EMBO Rep. 14, 1127–1135 [DOI] [PMC free article] [PubMed] [Google Scholar]


